_____________________________________________________________________________________________________
Assessing the Share of Impaired Visual Function,
Fine Motor Coordination and Visual-motor
Integration in Dyslexic Children with the
Eta/Mu Model
Carlo Aleci
1*and Francesca Vai
11Department of Neuro-Ophthalmology, University of Turin, Ophthalmic Hospital, Via Juvarra 19,
10100, Turin, Italy.
Authors’ contributions
This work was carried out in collaboration between both authors. Author CA devised the Eta/Mu model performed the statistical analysis and wrote the first draft of the manuscript. Author FV administered the test collected the results and approved the final version of the manuscript.
Article Information
DOI: 10.9734/ACRI/2019/v18i230134 Editor(s): (1) Amal Hegazi Ahmed Elrefaei, Division of Radioisotope Production, Hot Laboratory and Waste Management Center, Atomic Energy Authority, Egypt. Reviewers: (1) Asaad Ahmed Ghanem, Mansoura University, Egypt. (2)Engy M. Mostafa, Faculty of Medicine, Sohag University, Egypt. Complete Peer review History:http://www.sdiarticle3.com/review-history/51054
Received 16 June 2019 Accepted 26 August 2019 Published 31 August 2019
ABSTRACT
Aims: A computational model aimed to estimate the proportion of visual/motor deficits (first-order
defects) and visual-motor abnormal integration (second-order defect) in dyslexic children is described.
Study Design: Single-masked case-control study.
Place and Duration of Study: Sample: Service of Neuro-Ophthalmology, University of Turin,
between December 2017 and November 2018.
Methodology: Twenty subjects (age 8-10) were administered a set of tests that recruit the visual
and motor domain in different proportions. The score obtained in each trial is weighed by the correspondent share of visuoperceptive and motor recruitment. This way two indexes are obtained: Eta () and Mu (), that quantify the expected and estimated damage of the two functions across the range of average performance. The difference between the expected and estimated level of damage in the two domains represents the quota of selective visuoperceptive / motor impairment
of the subject. In turn, no or negligible difference in the presence of abnormal z-score would reveal impaired visual-motor integration with no evident visual or motor damage.
Results: The model detected a prevalent first-order defect in the visuo perceptive or motor domain
in 58% of the cases (visuo perceptive alteration: 27%, motor alteration: 73%), and a prevalent second-order defect in the remaining 42% of the subjects. Internal consistency was adequate for research and screening purpose (Cronbach’s coefficient alpha: from 0.77 to 0.84).
Conclusion: The Eta/Mu model seems a promising tool to detect cases of visual and motor
alteration as well as the level of visual-motor integration in dyslexic children. Further effort is needed to improve test-retest reliability by examining larger samples, so as to make it suitable to customize the rehabilitation program of children suffering from learning disabilities.
Keywords: Dyslexia; Eta/Mu model; motor; visual, visual-motor integration.
1. INTRODUCTION
In everyday life vision drives action so that in order to perform a common task like catching a ball, copying from a blackboard, writing, or riding a bike three requirements are expected: normal visual perception, intact motor function, and effective visual-motor integration.
Visual-motor integration (VMI) is defined as the cooperation of the visual and fine motor function required to accomplish an action: in other terms, it accounts for the capacity to coordinate visual and motor skills [1]. Beery distinguished between visual-motor integration in the strict sense, that is defined as the capacity to reproduce geometric items in the Developmental Test of Visual-Motor Integration [2], and eye-hand coordination, that estimates the ability to trace tasks (namely the capacity of drawing a line following a predetermined track). It is evaluated by the correspondent subtest of the Developmental Test of Visual Perception (DTVP). In a more general sense, Hammil, Pearson, and Voress defined visual-motor integration as the comprehensive result of spatial relations perception, drawing, and copying skills [3]. In this sense, it encompasses both the capacity to reproduce geometrical items and eye-hand coordination. This is, indeed, the definition of visual-motor integration adopted in this study.
Since there is wide evidence that VMI is related to the academic performance [4-6], investigating its functioning and detecting VMI selective damage in school-age children is an issue worth to be considered.
A number of tests are currently available to evaluate visual perception (e.g. the Developmental Test of Visual Perception: DTVP [3], the Motor-Free Visual Perception Test [7], or the Supplemental Developmental Test of Visual
Perception [1]) and motor coordination (like the Supplemental Developmental Test of Motor Coordination [1]) in children. In addition, the Beery-Buktenica Developmental Test of Visual Motor Integration (VMI [2]) is a specific protocol of evaluation devised to diagnose a second-order defect that is a failure in the integration of the visuoperceptive information with the motor response. The VMI provides a score based on a series of subtests that estimate motor coordination and the visual perceptual function. In the VMI the examinee is asked to copy a series of geometric items with an increasing degree of complexity.
Even if the VMI is a useful tool to estimate deficits of visual-motor integration [8], Kulp & Sortor [1] recalled that in its actual form it is not able to differentiate between visual perception deficit, difficulty in motor coordination, or difficulty in visual-motor integration.
Efforts in this sense have been made by Kulp and Sortor, who added to the Developmental Test of Visual Motor Integration the Supplemental Developmental Test of Motor
Coordination and the Supplemental
Developmental Test of Visual Perception, in order to discriminate conditions of reduced visual ability, reduced motor coordination, and/or abnormal visual-motor integration [1].
In the Supplemental Developmental Test of Motor Coordination, the child is asked to accurately connect patterns of dots so as to reproduce a shape, while the Test of Visual Perception requires to identify matching forms.
Still, it remains to establish to what degree a failure in the visual or in the motor domain, when found, involves the process of visual-motor integration, and, in turn, to what extent abnormal visual-motor integration affects the overall performance of the child in absence of an evident visuoperceptive or motor defect.
For this purpose, rather than evaluating separately the three domains it can be more suitable examining the subject in experimental conditions that concurrently engage the visuoperceptive and the fine motor function, and subsequently extracting the missing quota of visuoperceptive recruitment, motor recruitment, or visual-motor integration necessary to normalize the performance.
Yet, this solution is not straightforward, since the paradigm itself makes it difficult to perform this diagnostic process of categorization.
This exploratory paper aims at addressing this subject by using this approach: so, rather than administering three specific tests, each targeting a domain (visual, motor and visual-motor) and providing a specific score, the results obtained from a set of exams that recruit the visual and motor domain in different proportions are elaborated by a computational model: this way, the contribution of each variable in determining the overall performance of the subject is estimated. By doing so, the model presented in this paper provides an index that would quantify the proportion of visuoperceptive and motor deficit and would identify cases of purely defective visual-motor integration.
In this first, exploratory investigation dyslexic children have been chosen as a pathological sample. As a matter of fact, normal lexical development requires not only visuoperceptive skills but also efficient fine motor coordination [9], and a normal visual-motor integration [10].
Based on these assumptions, the validity of the Eta/mu model in detecting first- and second-order defects in dyslexic school-age children has been investigated.
2. MATERIALS AND METHODS
2.1 The η/μ (Eta/Mu) Model: Rationale and Description of the Tests
The η/μ model is a paradigm aimed at evaluating the amount of impairment in the visual and motor
domain, as well as defective visual-motor integration. A preliminary version has been described in a previous paper [11].
In the actual version seven visual and visual-motor tests covering 6 different visuoperceptive and visual-motor coordination skills have been selected, namely:
• Spatial relationship perception (SRP) • Interocular inhibition
• Saccadic pattern • Eye-hand coordination • Visual-motor orientation • Visual-motor precision.
Some exams of the set test the visual domain (VD). Other exams estimate both the visual and the motor domain (MD), but to a different extent. In each test, the proportion of VD and MD involvement has been established in advance based on an arbitrary (albeit accurately pondered) evaluation.
It should be noted that contrary to the Supplemental Developmental Test of Visual Perception, that involves high-order operations of perceptual analysis, the exams administered in the eta/mu model measure the effect of low-order visual functions (namely: spatial relationship perception, interocular reciprocal inhibition, and visual scanning) on the visual-motor integration.
The outcome of each exam is expressed as z-score.
2.1.1 Spatial relationship perception
Spatial relationship (SR) is synonymous with aspect ratio, and spatial relationship perception (SRP) can be defined as the perceived spatial extent of a stimulus along the x, y cardinal axes [12].
integration is an issue worth to be investigated: for this reason, the estimation of SRP anisotropy has been included in the protocol.
A detailed description of the procedure (we have called Eidomorphometry™) is reported in previous papers [12,13]. In brief, the test measures the discrimination threshold between circles and horizontal/vertical ellipses presented tachistoscopically on a PC screen. The variable is the length of the focal axis. The observer is required time after time to recognize the stimulus as a circle, vertical or horizontal ellipse according to a triple forced-choice response design. The convergence to the threshold is provided by a modified staircase procedure. The procedure estimates separately the just noticeable difference (jnd) between circles and vertical ellipses and between circles and horizontal ellipses. The difference between the two thresholds has been taken as the indicator of SRP anisotropy.
2.1.2 Interocular inhibition
The binocular function is stated to be of great importance for performing motor tasks, especially in those children with neurodevelopmental disorders [15].
A consistent body of evidence shows that inhibitory inputs affect the binocular integration of the stimulus [16-18]. As recalled by Said and Heeger [19], the current models for binocular rivalry rely on two pools of monocular neurons (left and right, each sensitive to a particular spatial property) that inhibit reciprocally and send projections to a pool of binocular summation neurons that are equally subjected to mutual inhibition. There is reason to believe that interocular inhibition plays a crucial role in processing the visual information: abnormal binocular input, in fact, affects a number of important visuoperceptive performances, like contour integration [20], and could be
responsible for poor academic skills. As a matter of fact, we found strong interocular
inhibition in a consistent proportion of normal children (“immature readers”), so that the inhibitory frequency distribution in the
normal pediatric population appears bimodal [21]. Interestingly, the cluster of strongly
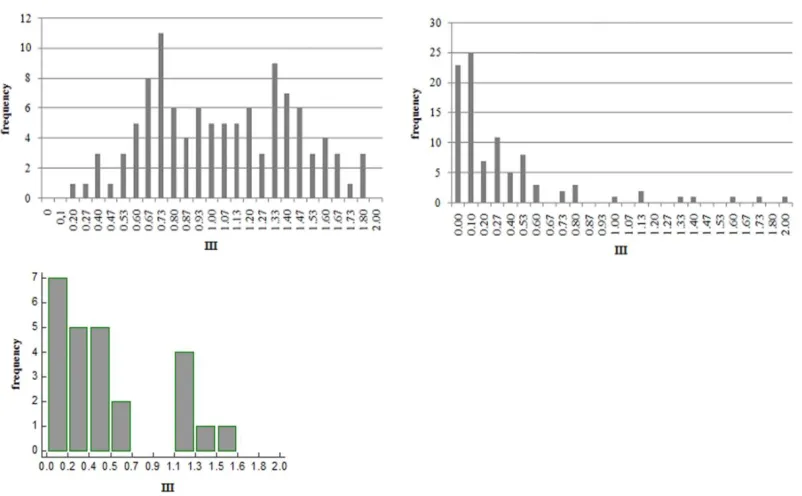
inhibited subjects disappears in adult (“mature”) readers [22], but persists in adult dyslexics [14] (Fig. 1). This finding
suggests that interocular inhibition may affect reading and in general the academic performance, and has therefore been included in the model.
Fig. 1. Frequency distribution of the interocular inhibition expressed as Interocular Inhibitory Index (III, see below). Upper left: normal children (immature readers), upper right: mature
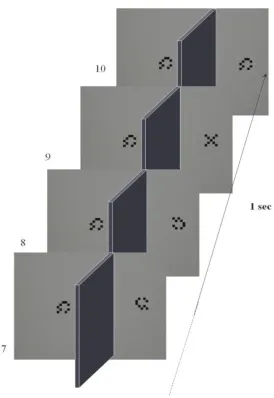
The detailed description of the procedure devised for this purpose is reported in a previous paper [21]. Briefly resuming, 10 pairs of sequences of stimuli are displayed dichoptically according to a rapid serial visual presentation paradigm (RSVP [23]). The left and right sequences were presented simultaneously and the binocular perception of each stream was prevented through a rectangular mask placed perpendicularly between the midline of the screen and the face of the patient, and aligned to the nose. The task was to detect a target (a 5x5 matrix made of black and white squares arranged to form an "X") embedded in a sequence of null stimuli (black and white squares of the matrix arranged in pseudorandom order). At every trial, the target was presented to either the left or the right eye in a random manner and in a random temporal position within the sequence. The subject was asked to detect the target after each trial (Fig. 2).
Fig. 2. The last four presentations of a stream of stimuli in the RSVP technique used in the
experiment. Each stimulus is displayed to one eye. In this trial, the target is presented to
the right eye at position 9. (From Aleci et al. [21])
In each subject, the proportion of correct responses is assumed to reflect the degree of interocular inhibition, computed as Interocular Inhibitory Index (III: see [21] for the computation).
2.1.3 Saccadic pattern
A normal saccadic function is fundamental for perceiving and scanning visual scenes, and it is required to ensure a correct visual-motor
coordination [24,25]. The effect of abnormal saccadic pattern on the academic performance of school-age children, indeed, has been established since the eighties [26].
The Developmental Eye Movement test (DEM [27]) assesses the saccadic pattern in a condition similar to reading. Two columns, 20 digits per column (first and second subtest), and an array of digits displaced in a pseudorandom order (third subtest) are reported on a white sheet. The subject is required to read the digits in vertical, then in horizontal order. The time spent to complete the first and second subtest and the time and number of errors/omissions in the third subtest are measured. A Ratio Score between the horizontal time (adjusted for the number of errors) and the vertical time is computed as an indicator of saccadic integrity.
2.1.4 Eye-hand coordination
Two subtests similar to the subtest 1 of the DTVP have been used to evaluate the eye-hand coordination. The subtests require the patient to draw a line within a gray track 17.4 min arc wide at a viewing distance of 40 cm (2 mm).
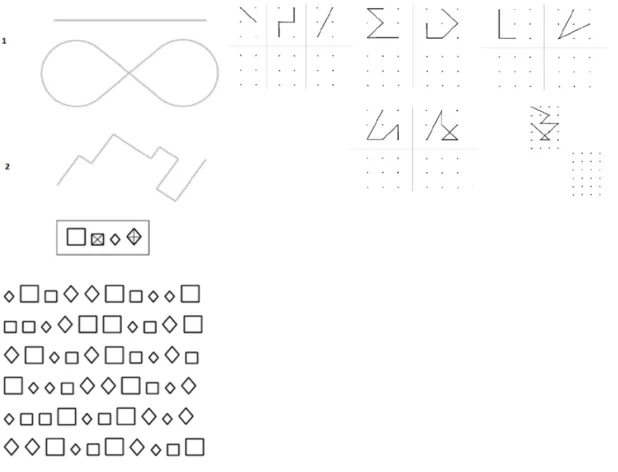
In the first subtest two tracks, one straight, the other "8" shaped, are presented; in the second trial, the track turns abruptly at a right angle. Unlike the DTVP, the tracks are narrower and not flanked by any visible boundary (Fig. 3, left upper panel).
At the end of the trial, a score is assigned based on the number of times the draw crosses the boundaries of the track and (in case) on the extent of each deviation, and on the number of times the child lifts the pencil, thereby interrupting the drawing of the line.
2.1.5 Visual-motor orientation
This test assesses the graphic precision in connecting dots placed:
• Within a rectangular matrix 596x300 arcmin wide (at a viewing distance from of 40 cm) made of 3x2 points horizontally and vertically spaced by 300 arcmin: item 1; • Within a square matrix 600x600 arcmin
wide made of 3x3 points horizontally and vertically spaced by 300 arcmin: item 2; • Within a rectangular matrix 810 x514
The subject is required to copy the same pattern on a matrix placed aside. A score is assigned based on the number of wrong items (wrongly connected dots) and on the extent of the correspondent positional error.
2.1.6 Visual-motor precision
A series of 30 stimuli made of squares and diamonds each of two different sizes (big squares and big diamonds: 128 arcmin; small squares and small diamonds: 86 arcmin) are randomly displaced and separated by 42.5 arcmin at a viewing distance of 40 cm. The subject is asked to mark with an "X" each small square, and with a "+" each big diamond. The time allowed for completing the exam is one minute.
Errors are computed as the number of figures not identified or not correctly marked (the trace should connect the opposite corners of the stimuli), and on the number of omissions (Fig. 3, lower panel).
2.1.7 The computational model
After completion of the session, the average z-score (that reflects the global performance of the
child) is computed from the z-values obtained in each subtest. Since each z-score refers to the amount of the defect in a subtest, positive values refer to departure from the normal performance (performance worse than expected). The z-scores provided by the DEM, that are negative, are turned into inverse values before being included in the model.
Two indexes of functional loss in the VD and MD, defined η and μ respectively, are computed by combining the z-score obtained at each test and the relative proportion of VD/MD recruitment as follows:
η= -Σn1…ni (VD%n * z scoren) /n (1a)
μ = -Σn1…ni (MD%n * z scoren) /n (1b)
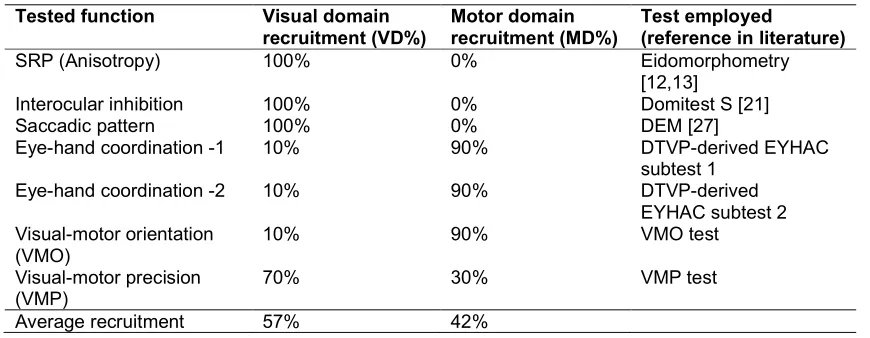
In Table 1 the seven tests with the correspondent VD/MD proportion of recruitment are reported. To be noted that the proportion of visual-perceptive involvement is set higher in the VMP compared to the VMO test and to the EHC subtests: the task required in the VMP, in fact, would presumptively rely on the visual channel more than the subtests of the DTVP used to evaluate eye-hand coordination [28].
Fig. 3. Upper left panel: the subtests for eye-hand coordination in the Eta/Mu model; upper right panel: the items for assessing visual-motor orientation in the eta mu model. Lower panel:
Table 1. The diagnostic set
Tested function Visual domain
recruitment (VD%)
Motor domain recruitment (MD%)
Test employed
(reference in literature)
SRP (Anisotropy) 100% 0% Eidomorphometry
[12,13]
Interocular inhibition 100% 0% Domitest S [21]
Saccadic pattern 100% 0% DEM [27]
Eye-hand coordination -1 10% 90% DTVP-derived EYHAC
subtest 1
Eye-hand coordination -2 10% 90% DTVP-derived
EYHAC subtest 2 Visual-motor orientation
(VMO)
10% 90% VMO test
Visual-motor precision (VMP)
70% 30% VMP test
Average recruitment 57% 42%
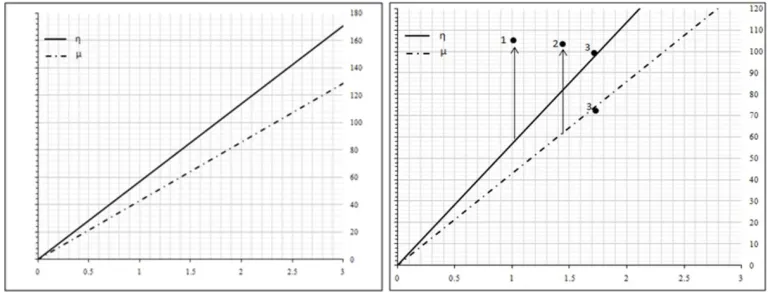
Based on the equations 1a and 1b, η or μ will be negative if defective. In case the global performance of the child was normal (average z-score = 0), η and μ will be 0, suggesting no impairment of the visual and motor domain. As the performance of the child moves away from the normative value, η and μ grow proportionally, as shown by the continuous and dotted lines of Fig. 4.
It should be noted that as a result of the overall higher visuoperceptive recruitment compared to the fine motor recruitment (57% vs 42%) required to the subject to correctly perform the diagnostic set, the slope of the linear model η (Eta) is steeper than μ (Mu).
If his/her visuoperceptive and fine motor function were defective exactly by the same amount, all the z-scores resulting from the seven tests will be the same, irrespective of the preferential domain (VD or MD) each test addresses. In this hypothetical case the resulting η and μ express, respectively, the level of visuoperceptive and motor performance the examinee should exhibit to have his/her average z-score normalized (i.e. z-score=0): for average z-score =1, indeed, the loss of visuoperceptive performance is 57 units η and of fine motor performance is 42 units μ, reflecting the visuoperceptive and motor proportion of recruitment proper of the diagnostic set. In this case, improving the visuoperceptive performance by 57 η and the motor performance by 42 μ will normalize the z-score of the subject. Likewise, in case of an average z-score =2, improving the visuoperceptive performance by 114 η and the motor performance by 84 μ will normalize the z-score. The amount of η and μ recruitment as a function of the z-score in case
the VD and MD were equally affected is provided by the two regression lines of the model (Fig. 4, left panel), generated by the following equations:
ηexp= - (57* z-scoreavg) (2a)
μexp =- (43* z-scoreavg) (2b)
In case the z-score was higher for tests recruiting mainly the visual domain, η would be greater than expected from eq. 2a. In this case the difference Δη between |ηexp|-|η| quantifies the prevalent impairment of the visual domain.
In turn, if the z-score were higher for tests recruiting mostly the motor domain, μ would be greater than expected from eq. 2b. In this case the difference Δμ between |μexp|-|μ| quantifies the prevalent impairment of the motor domain1.
Finally, abnormal visual-motor integration is theorized in case the performance of the subject (average z-score) consistently deviates from the normality and η and μ are negligible.
The three scenarios are depicted in the right panel of Fig. 4.
2.2 Sample
The Eta/Mu model has been administered to 20 dyslexic children (12 males, 8 females, age 8-10,
recruited from a neuropsychiatric service) and 25 normal children (14 males, 11 females, age
8-11, selected during routine ophthalmological checkups). The normal and pathological groups were age-matched (Mann-Withney: P= .71).
1 For the sake of clarity It is worth recalling that since Δη and
Fig. 4. Eta (η) and μ (ordinate) as a function of the average z-score (abscissa). Left panel: a hypothetical case of identical VD and MD impairment. Abscissa: average z-score; ordinate: functional loss in the VD and MD domain, expressed as arbitrary units (η and μ, respectively). Right panel: graphical representation of the three hypothetical cases described in the text. The
module of the vectors represents the amount of functional loss in the visual (Δη, case 1) and motor (Δμ, case 2) domain. Case 3 refers to abnormal visual-motor integration. See text for
explanation
The inclusion criterion in the case group was developmental dyslexia and good collaboration. The diagnosis of dyslexia has been conducted according to the operational definition of the condition, i.e. lexical age reduced of at least 2.5 years with reading rate and accuracy below the second standard deviation compared to normal age-matched readers, normal intellectual ability and normal or above normal IQ (measured by the Wechsler Intelligence Scale for Children [WISC-R]), with natural visual acuity 60/60 and no behavioural problems or auditory impairment [29]. In both samples exclusion criteria were general conditions like diabetes, neurological problems, neuropsychiatric problems like ADHD, and ophthalmological diseases like congenital cataract, nystagmus, retinopathy of prematurity; in addition: hyperopia/myopia >2D, astigmatism >1.5D, eso/exotropia, poor convergence, auditory impairment, behavioral problems, and poor collaboration. In all the cases the best-corrected visual acuity was ≥ 60/60. The socio-cultural context of the dyslexic and normal readers was the same but the academic achievement of the normal children matched that expected for their age. The parents of the children were contacted and their informed consent was obtained after explanation of the aim, nature and possible consequences of the study.
After the preliminary orthoptic and
ophthalmological examination (cover test, near convergence point estimate, slit lamp examination of the anterior segment and
retinoscopy), each subject underwent the diagnostic set whose exams were administered in random order at an interval of about 10 minutes. In case the test was judged not reliable, it was repeated after a resting period of a few minutes. The operator FV was unaware of the group (case or control) the subject under examination belonged to, according to a single masked design. After completion of the diagnostic set the average z-score, Δη and Δμ have been computed and results have been compared in the two samples.
All authors hereby declare that the experiment has been performed in accordance with the ethical standards laid down in the 1964 declaration of Helsinki.
3. RESULTS
Z-scores for each test (except for the DEM, whose values are available [30]) were computed from the mean and SD of the normal sample. In all the subtests the raw scores were normally distributed (Table 2).
p=.01), and between the EHC tests and VMO (EHC1 –VMO: r= 0.46, p=.01; EHC2-VMO: r= 0.52, p=.007). Apart from these exceptions, the tests of the set did not correlate.
After the cut off for poor performance is set 1 SD below the normal mean (in line with the criterion adopted by Kulp & Sortor, 2003 1) the average performance at the Eta/Mu battery was defective in only 1 normal subject (4.7%) vs 15 disabled readers (75%). The visual-perceptual function was found abnormal in 16 % of the normal readers (4 cases), whereas no prevalent motor impairment was detected.
In patients, (η,μ) ranged from |0.31| to |77.75| (mean: |25.54|), with a subject (ID: 12) showing a deep defaillance in the motor domain (μ= -209.81). This observation has been detected as an outlier at Grubb's test and removed. In the control group, (η,μ) ranged from |2.33| to |39.08| (mean: |13.48|).
As explained, a deficit in the VD or MD higher than expected means that the impairment in the pathological group involves specifically the visual or the motor domain (first-order functions). In turn, a deficit in the VD and MD not higher than
expected (η or μ close to 0, i.e. no deviation from the regression model) supposedly indicates that the impairment is not specifically related to either of the two first-order functions, but affects the visual-motor integration (second-order function). The third quartile of the normative frequency distribution of (η,μ) =|20| was set as the cutoff for detecting patients with abnormal visual-motor integration (below the cutoff) and children with prevalent motor or visual defect (above the cutoff). A first-order defect was found in 58% of the patients (11 cases): more specifically, a prevalent VD and MD impairment was found in 27% and 73% of the cases, respectively. A second-order defect was found in the remaining 42% of cases.
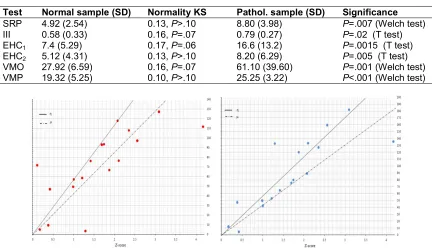
Data from the pathological sample are shown in Fig. 5. Average z-score and (η,μ) correlated in
the pathological sample (r= 0.56, p=.012), but not in controls (r= -0.12, p=.57). The few
cases of prevalent defective visual function (Fig. 5, left panel: observations above the
continuous line) are localized at the lowest z-scores and are in contrast with the great number of observations of abnormal motor function (Fig. 5, right panel: observations above the dotted line).
Table 2. Raw scores and tests for normality of the diagnostic set
Test Normal sample (SD) Normality KS Pathol. sample (SD) Significance
SRP 4.92 (2.54) 0.13, P>.10 8.80 (3.98) P=.007 (Welch test)
III 0.58 (0.33) 0.16, P=.07 0.79 (0.27) P=.02 (T test)
EHC1 7.4 (5.29) 0.17, P=.06 16.6 (13.2) P=.0015 (T test)
EHC2 5.12 (4.31) 0.13, P>.10 8.20 (6.29) P=.005 (T test)
VMO 27.92 (6.59) 0.16, P=.07 61.10 (39.60) P=.001 (Welch test)
VMP 19.32 (5.25) 0.10, P>.10 25.25 (3.22) P<.001 (Welch test)
Fig. 5. Relationship between average z-score and η (left panel) and between average z-score
In addition, a consistent number of subjects showed no evident visuoperceptive or motor deficit (observations close to the continuous line in Fig. 5, left panel, and close to the dotted line in Fig. 5, right panel), suggesting a problem in their visual-motor integration.
Internal consistency for the EYHAC-subtest 1, EYHAC-subtest 2, VMO, and VMP has been assessed by computing Cronbach’s coefficient alpha after repeating the test. Bland and Altman stated that alpha > 0.70 is needed for research and screening purposes, while 0.90 is the cutoff for diagnostic purposes [31]. Cronbach’s alpha for ECH1, ECH2, VMO, and VMP in the pathological sample was, respectively, 0.84 (lower 95% confidence limit: 0.65), 0.79 (0.55), 0.80 (0.56), and 0.77 (0.51).
4. DISCUSSION
An academic performance like writing or reading requires not only good visuoperceptive and fine motor skills, but also efficient visual-motor integration [10,32,33]. It follows that a correct evaluation of how well the visual perception of a child cooperates with his/her motor skills involves the assessment of visual perception, of manual motor coordination (first-order functions) and of the way the visual information is passed to the motor system (second-order function).
The methods used so far provide an estimate of each of the three variables by administering separate trials, each of them aimed at segregating a single function. Yet, when each of the three functions is measured one at a time
with dedicated tests, the strict relationship between visual and fine motor skills may affect the diagnostic process of categorization. Indeed, to some extent, the protocols actually available seem to suffer from this flaw.
The Eta/Mu model has been devised to quantify the impairment in the visual or motor domain and the abnormal visual-motor integration without segregating the three functions, but extracting the correspondent quotas after trials with different proportion of visuoperceptive and motor recruitment have been administered. To investigate the effectiveness of the model in detecting visual-motor problems potentially affecting the development of academic skills, in this exploratory investigation dyslexic children have been chosen as a pathological sample.
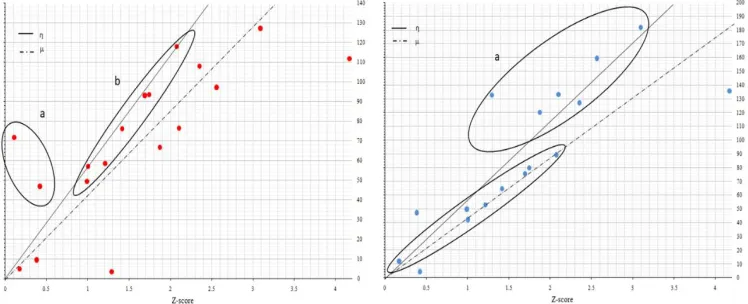
In the group of disabled readers, the model detected a few cases of visual defect and a more consistent number of subjects with impaired motor coordination. In addition, almost half of the dyslexic children showed neither visual nor motor evident defect. These cases can be identified close to the continuous and dashed lines of Fig. 6.
In about half of the cases, our small sample showed a predominant first-order impairment, referred to the visuoperceptive or to the fine motor coordination function. In the remaining subjects, the poor visual-motor performance highlighted by the average z-scores does not seem explainable by a specific problem involving one of the two domains. The solution could be a second-order alteration that is a failure at the level of visual-motor integration.
Fig. 6. Left panel: cases with a deficit in the visual domain (a), and impaired visual-motor integration (b, the same as Fig. 5, left panel) as detected by the eta/mu model. Right panel: cases with a deficit in the motor domain (a), and impaired visual-motor integration (b, the same
Kulp & Sortor evaluated the clinical value of the VMI, the Supplemental Developmental Test of Visual Perception, and the Supplemental Developmental Test of Motor Coordination in 193 school-age children [1]. The authors found that 5.6% performed poorly at the Visual Perception test, and 15.6% performed poorly at the Motor Coordination test. In our study, the visuoperceptive function was found abnormal in 16% of the subjects, whereas the motor function was normal in all the cases. Even if it is not possible to compare these data with those provided by the authors of the previous study due to the different methodologies (a single procedure vs three different tests measuring three separate functions) and the different type of samples (ascertained normal children vs unselected sample), the amount of defective visuoperceptive function found with our model is overall in line with the results reported by the two authors. On the contrary, the motor outcome is different, suggesting either that the eta/mu model has lower sensibility (but higher specificity) in assessing the fine motor function compared to the visuoperceptive function, or that (as it is more likely) the Motor Coordination test is more effective in detecting failures in the motor domain.
Moreover, the same authors reported a correlation between the two supplemental tests and between each of the two supplemental tests and the standard score of the VMI. If on the one hand these correlations suggest that << [...] Visual Perception and Motor coordination are parts of overall Visual Motor integration>> [1], p.314 (but see [34]), on the other hand they let us assume that the functions evaluated by the three tests overlap to a certain degree. In turn, except for the EYHAC and VMO, the subtests of the Eta/Mu model did not correlate, demonstrating therefore that the exams included in the model are not redundant with regard to their diagnostic value.
How can abnormal visual-motor integration be
accounted for in these cases? Any
considerations based on the results obtained in this preliminary, exploratory study risk to be too speculative: nonetheless, it is worth recalling that the two parallel pathways upon which the visual system relies and through which it interacts with the motor domain are the ventral stream and the dorsal stream. Goodale and Milner suggested that the ventral stream is responsible for perception (the “what” pathway”) while the dorsal
stream processes also visually-guided action (the “where” pathway [35]). Kovács hypothesized a different timing in the development of the two pathways, as the maturation of the ventral stream is delayed compared to the development of the dorsal system: the maturation of the ventral stream, in fact, continues until the end of childhood [36]. Assuming that such asynchrony is an essential requisite for correct visual-motor integration, its perturbation could affect the cooperation between ventral and dorsal system, eventually causing poor visual-motor integration.
Under a practical perspective, knowing the module and direction of the ημ can help customize the rehabilitation protocol. The computational phase, after test completion and data collection, is provided by a simple program. An interesting feature of the model is that it is an open tool, suitable to be enriched or improved with new exams.
The time required to perform the protocol is acceptable (about 15 min for the execution and 10 minutes for scoring).
The small size of the recruited samples is a major limitation of this study that, in fact, is just exploratory. Undoubtedly, the investigation needs to be replicated with a far larger number of participants. In addition, the heuristic criterion adopted to assign each test the VD and MD proportion of recruitment should be replaced by an experimental-based approach. Finally, even if the internal consistency is suitable for research and screening purposes, it is not enough to ensure diagnostic and rehabilitative value.
5. CONCLUSION
In conclusion, the Eta/Mu model is an interesting solution to assess the relationship between visuoperceptive and fine motor function, as well as the failure of their integration in learning disabled children. Effort is needed to make it suitable for decision-making purpose and eventually for better guiding of rehabilitation programs in children suffering from learning disabilities.
CONSENT
ETHICAL APPROVAL
All authors hereby declare that all experiments have been examined and approved by the appropriate ethics committee and have therefore been performed in accordance with the ethical standards laid down in the 1964 Declaration of Helsinki.
AVAILABILITY OF DATA
Data are available upon request to the authors.
COMPETING INTERESTS
Authors have declared that no competing interests exist.
REFERENCES
1. Kulp MT, Sortor JM. Clinical value of the Beery visual-motor integration
supplemental tests of visual perception and motor coordination. Optom Vis Sci. 2003;80(4):312-5.
2. Beery KE. The beery-buktenica
developmental test of visual-motor integration. 5th ed. Minneapolis, MN: NCS Pearson, Inc; 2004.
3. Hammill DD, Pearson NA, Voress JK. Developmental test of visual perception. 2nd ed. Austin, TX: Pro-Ed; 1993.
4. Keogh BK, Smith CE. Visuo-motor ability for school prediction: A seven-year study. Percept Mot Skills 1967;25(1):101-10. DOI: 10.2466/pms.1967.25.1.101
5. Kulp MT. Relationship between visual motor integration skill and academic performance in kindergarten through third grade. Optom Vis Sci. 1999;76(3):159-63. 6. Well MJ, Amudson SJ. Relationship
between visual-motor and handwriting skills of children in kindergarten. Am J Occup Ther. 1994;48(11):982-8.
7. Colarusso RP, Hammill DD. Motor-free visual perception test-revised. Novato, CA: Academic Therapy Publications; 1996. 8. Demsky Y, Carone DA Jr., Burns WJ,
Sellers A. Assessment of visual-motor coordination in 6- to 11-yr-olds. Percept Mot Skills 2000;91(1):311-21.
9. Marchand-Krynski ME, Bélanger AM, Morin-Moncet O, Beauchamp MH, Leonard G. Cognitive predictors of sequential motor impairments in children with dyslexia and/ or attention deficit / hyperactivity disorder. Dev Neuropsychol. 2018;43(5):430-53.
DOI: 10.1080/87565641.2018.1467421 10. Bellocchi S, Muneaux M, Huau A, Lévêque
Y, Jover M, Ducrot S. Exploring the link between visual perception, visual-motor integration, and reading in normal developing and impaired children using DTVP-2. Dyslexia. 2017;23(3):296-315. DOI: 10.1002/dys.1561
11. Aleci C, Piccoli M, Melotti V, Melis E, Canavese L. Separating visuospatial from visual-motor coordination in skill estimation in learning disabled children: The Eta-Mu model. Cureus. 2017;9(12):e1901.
DOI: 10.7759/ cureus.1901
12. Aleci C, Piana G, Anselmino F. Evaluation of spatial anisotropy by curvature analysis of elliptical targets. Open Ophthalmol J. 2010;4:20-6.
DOI: 10.2174/1874364101004010015 13. Aleci C, Piana G, Piccoli M, Bertolini M.
Developmental dyslexia and spatial relationship perception. Cortex. 2012; 48(4):466-76.
DOI: 10.1016/j.cortex.2010.10.004
14. Aleci C, Saldutto V, Canavese L. Detecting visuoperceptive defects in adolescent and adult disabled readers with the TETRA Analyzer™. Pathological sample and
comparison with normal readers.
Ophthalmology Research: An International Journal. 2017;7(4):1-12.
15. Howard IP. Reaching and moving in 3D space perceiving in depth. Oxford: Oxford University Press. 2012;3.
16. Baker DH, Meese TS, Hess RF. Contrast masking in strabismic amblyopia: Attenuation, noise, interocular suppression and binocular summation. Vis Res. 2008; 48(15):1625-40.
DOI: 10.1016/j.visres.2008.04.017
17. Hess RF, Hutchinson CV, Ledgeway T, Mansouri B. Binocular influences on global motion processing in the human visual system. Vis Res. 2007;47(12):1682-92.
18. Mansouri B, Thompson B, Hess RF. Measurement of suprathreshold binocular interactions in amblyopia. Vis Res. 2008; 48(28):2775-84.
DOI: 10.1016/j.visres.2008.09.002
19. Said CP, Heeger DJ. A model of binocular rivalry and cross-orientation suppression. PLoS Comput Biol. 2013;9(3):e1002991. DOI: 10.1371/ journal.pcbi.1002991:1-12 20. Kovács I, Polat U, Pennetfather PM,
of disrupted binocular experience during visual development. Vis Res. 2000;40(13): 1775-83.
21. Aleci C, Cavaglià L, Piana G, Usai T. Domitest-S: A Novel Dichoptic Technique to Assess Ocular Sensory Dominance In Children. A population study. British J Med Medical Res. 2014;4(6):1371-82.
22. Aleci C, Blanc M, Canavese L. Detecting visuoperceptive defects in adult disabled readers with the TETRA Analyzer™. Normative Data and Test-retest Reliability. Ophthalmology Research: An International Journal. 2017;7(3):1-13.
23. Raymond JE, Shapiro KL, Arnell KM.
Temporary suppression of visual
processing in an RSVP task: An attentional blink? J Exp Psychol Human. 1992;18(3): 849-60.
24. Gonzales CC, Mon-Williams M, Burke S, Burke MR. Cognitive control of saccadic
eye movements in children with
developmental coordination disorder. PLOS One. 2016;e0165380.
DOI: 10.1371/journal.pome.0165380 25. Summer E, Hutton SB, Kuhn G, Hill EL.
Oculomotor atypicalities in developmental coordination disorder. Dev Sci. 2018; 21(1):e12501.
DOI: 10.1111/desc.12501
26. Elterman RD, Abel LA, Daroff RB, Dell’Osso LF, Bornstein JL. Eye movement patterns in dyslexic children. J Learn Disabil. 1980;13(1):16-21.
27. Garzia RP, Richman JE, Nicholson SB, Gaines CS. A new visual-verbal saccade test: the developmental eye movement test (DEM). J Am Optom Assoc. 1990;61(2): 124-35.
28. Kaiser ML, Albaret JM, Doudin PA. Relationship between visual-motor integration, eye-hand coordination and quality of handwriting. J Occup Ther Early Intervention. 2009;2(2):87-95.
DOI: 10.1080/19411240903146228. 29. Remschmidt H, Schmidt M, Poustka F.
Multiaxiales Klassifikationsschema für Psychische Storüngen des Kindes-und Jugendaltersnach ICD-10 der WHO. Bern: SWI Verlag Hans Huber; 1994.
30. Facchin A, Maffioletti S, Carnevali T. The Developmental Eye Movement (DEM) test: Normative data for Italian population. Optom Vis Dev. 2012;43(4): 162-79.
31. Bland JM, Altman DG. Statistics notes: Cronbach's alpha. Br Med J. 1997;314: 572.
DOI: org/10.1136/bmj.314.7080.572 32. Fawcett AJ, Nicolson RI. Persistent deficits
in motor skill of children with dyslexia. J Mot Behav. 1995;27(3):235-40.
DOI: 10.1080/00222895.1995.9941713 33. Velay JL, Daffaure V, Giraud K, Habib M.
Interhemispheric sensorimotor integration in pointing movements: A study on dyslexic adults. Neuropsychologia. 2002;40(7): 827-34.
34. Leonard P, Foxcroft C, Kroukamp T. Are visual-perceptual and visual-motor skills separate abilities? Percept Mot Skills. 1988;67(2):423-6.
35. Goodale MA, Milner AD. Separate visual pathways for perception and action. Trends Neurosci. 1992;15(1):20-5.
36. Kovács I. Human development of
perceptual organization. Vis Res. 2000; 40(10-12):1301-10.
© 2019 Aleci and Vai; This is an Open Access article distributed under the terms of the Creative Commons Attribution License (http://creativecommons.org/licenses/by/4.0), which permits unrestricted use, distribution, and reproduction in any medium, provided the original work is properly cited.
Peer-review history: