Available online on 15.08.2019 at http://ajprd.com
Asian Journal of Pharmaceutical Research and Development
Open Access to Pharmaceutical and Medical Research© 2013-19, publisher and licensee AJPRD, This is an Open Access article which permits unrestricted non-commercial use, provided the original work is properly cited
Open
Access
Research Article
Exploring the Interaction of Tartrazine and Lipase: A
Multispectroscopic Analysis, Docking and Computational Simulation
Methods
Liu Baosheng
*, Zhang Hongcai, Cheng Xu
College of Chemistry & Environmental Science, Key Laboratory of Analytical Science and Technology, Hebei University, Baoding, PR China
A B S T R A C T
The interaction between food colorant tartrazine and lipase was studied by multi-spectroscopic and molecular docking simulation under simulated physiological conditions to evaluate the toxic of tartrazine at the protein level. The results showed that tartrazine could effectively quench the endogenous fluorescence of lipase. The thermodynamic parameters were obtained from the van't Hoff equation, and the Gibbs free energy ΔG<0, indicating that the reaction was spontaneous; ΔH<0, ΔS>0, indicating hydrophobic interaction played a major role in forming the tartrazine-lipase complex. as shown by the synchronous fluorescence, UV-vis absorption and circular dichroism data, tartrazine could lead to the conformational and micro environmental changes of lipase, which may affect its physiological function. Molecular docking results showed that tartrazine was site in the active center of lipase, which altered the microenvironment of amino acid residues at the catalytic active center of lipase.
Keywords: Tartrazine, Spectroscopic, Molecular, Docking;
A R T I C L E I N F O: Received 01 June 2019; Review Completed 09 July 2019; Accepted 22 July 2019; Available online 15 August 2019
Cite this article as:
Liu Baosheng , Zhang Hongcai, Cheng Xu, Exploring the interaction of tartrazine and lipase: A multispectroscopic analysis, docking and computational simulation methods,, Asian Journal of Pharmaceutical Research and Development. 2019; 7(4):01-07, DOI: http://dx.doi.org/10.22270/ajprd.v7i4.546
*Address for Correspondence:
Baosheng Liu, College of Chemistry & Environmental Science, Key Laboratory of Analytical Science and Technology, Hebei University, Baoding, PR China, Email:lbs @ hbu.edu.cn
INTRODUCTION
artrazine (structure formula see Fig. 1) is a synthetic acid azo dye; its aqueous solution is yellow. As a colorant, it is widely used in sugar coating and capsule of pastry, candy, beverage and pharmaceutical preparation1. Generally speaking, synthetic dyes contain azo functional groups and aromatic ring structures, which are harmful to human health. Long-term intake or intake of foods containing large amounts of tartrazine can cause allergies, migraines, eczema, anxiety, and digestive system2. Excessive intake of tartrazine may exceed the affordability of the liver and accumulate in the body, resulting in kidney
and liver damage3. Some reports also suggest that tartrazine can cause allergic reactions, hyperactivity, and restlessness and sleep disorders in children 4.
Lipase is a kind of hydrolytic enzyme that decomposes triacylglycerol. It belongs to intracellular enzyme. Its catalytic site contains nucleophilic catalytic triad (SHD or SHE), catalytic site is buried in the molecule. The surface is covered by a spiral cover structure formed by relatively hydrophobic amino acid residues; it has a protective effect on the catalytic site of triad 5. Human lipase is mainly secreted by pancreatic acinar cells, so it is also called pancreatic lipase and plays an important role in digesting fat
in the duodenum and in the absorption of triglycerides in the small intestine. Hydrolyzed triglycerides are converted into glycerol and fatty acids and are absorbed by human body 6, which plays an important role in the process of human digestion and absorption. Zhao Lining et al.7 studied the interaction between three mercaptopropionic acid-terminated CdTe quantum dots and lipase, and proved that three mercaptopropionic acid-terminated CdTe quantum dots have toxic and side effects on lipase. Zhang Rui et al. 8 studied the interaction between bisphenol A and lipase in vitro in order to better understand the toxicity mechanism of bisphenol A.
In recent years, fluorescence spectroscopy has become an important means to study the mechanism of ligand-protein system, but so far, the study of lipase binding to tartrazine by a variety of spectroscopy and molecular docking techniques has not been reported. In this paper, the binding constant, binding site number and thermodynamic parameters of tartrazine-lipase system were obtained by fluorescence spectroscopy and molecular docking method. Thus, the binding mechanism of tartrazine and lipase was revealed, which provided a theoretical basis for understanding the toxicity of tartrazine to human body at the molecular level.
Figure 1: The structure formula of tartrazine
Experimental
Apparatus
These fluorescence spectra were acquired with a Shimadzu RF-5301PC spectrofluorophotometer. Circular dichroism spectra were recorded on a MOS-450/SFM300 circular dichroism spectrometer (Bio-Logic, France). Absorption was measured with an UV-vis recording spectrophotometer (UV-3600, Shimadzu, Japan). All pH measurements were made with a pHS-3C precision acidity meter (Leici, Shanghai, China). All temperatures were controlled by a SYC-15B superheated water bath (Sangli, Nanjing, China).
Materials
Porcine pancreatic lipase (PPL) was purchased from Sigma-Aldrich (purity grade inferior 99%, Shanghai, China), standard solution (5.0×10⁻⁶ mol/L) was prepared. Tartrazine (TTZ) standard solution (1.0×10⁻³ mol/L) was prepared. Tris-HCl buffer solution was used to keep the pH of the solution at 7.40, containing NaCl (0.15 mol/L) to maintain the ionic strength of the solution. All other reagents were analytical grade and all aqueous solutions were prepared with newly double-distilled water and stored at 277 K.
The fluorescence intensity measured in the experiment was corrected by the "internal filter effect" Eq.(1) 9:
(Aex Aem)/2
cor obs
I
I
e
(1)Where Icor and Iobs are the fluorescence intensities corrected
and observed, respectively, and Aex and Aem are the absorption of the system at the excitation and the emission wavelength, respectively. The intensity of fluorescence used in this paper is the corrected fluorescence intensity.
Results and discussion
Experiment procedure
Fluorescence measurements
1.0 mL Tris-HCl buffer solution, 2.0 mL PPL (5.0×10⁻⁶ mol/L), and different volume of TTZ were added into 10.0 mL colorimetric tube successively. The samples were diluted to scaled volume with double-distilled water, mixed thoroughly by shaking, and kept static for 30 min at different temperatures (298 K, 310 K, and 318 K). Excitation wavelength with excitation and emission slit at 5 nm for PPL was 280 nm and 295 nm, respectively. The fluorescence spectra were measured (emission wavelengths of 280-450 nm). At the same time fixed Δλ=15 nm or Δλ=60 nm, the synchronous fluorescence spectra of PPL and TTZ were recorded.
Circular dichroism measurements
A total of 1.0 mL Tris-HCl buffer solution , 2.0 mL PPL solution (5.0×10⁻⁶ mol/L), and different volumes of TTZ were added into a 10.0 mL colorimetric tube successively. The samples were diluted to scaled volume with water, mixed thoroughly by shaking, and kept static for 30 min at 298 K. Each spectrum was recorded at wavelengths between 190 and 300 nm and a scan speed of 1 nm/s.
UV-vis measurements
1.0 mL Tris-HCl buffer solution, 2.0 mL PPL solution (5.0×10⁻⁶ mol/L) and different volume of TTZ were successively added to a 10.0 mL colorimetric tube, and the reference solutions were the corresponding concentration of TTZ solutions. The samples were diluted to scaled volume with water, mixed thoroughly by shaking, and kept static for 30 min at 298 K. The UV-vis absorption spectrum of TTZ in the presence and absence of PPL were scanned with 1cm quartz cells over the range from 190 nm to 400 nm.
Molecular docking
favorable docking model was selected according to the binding energy and the geometry matching 10.
Results and Discussion
The Fluorescence spectra of TTZ-PPL system
At 280nm wavelength, the Trp and Tyr residues in PPL are excited, whereas a wavelength of 295nm excites only Trp residues 11. Fig. 2 showed that the fluorescence emission spectrum of PPL when TTZ was added at different concentrations. A typical emission peak was observed at about 348 nm when the excitation wavelength was λex=280 nm. (The fluorescence emission spectrum of TTZ-PPL was similar to λex=295 nm, but the fluorescence intensity was low.) As the TTZ concentration increased, the degree of fluorescence quenching increased, and the maximum emission peak was blue-shifted, indicating that TTZ interacted with PPL and formed a stable complex 12.
Figure 2: Fluorescence emission spectra of TTZ-PPL system (T=310 K,
λex=280 nm)
CPPL=1.0×10⁻⁶ mol/L, 1~9 CTTZ=(0, 0.1, 0.5, 1.5, 2.0, 2.5, 3.0, 3.5, 4.0)×10-5 mol/L
In order to study the quenching mechanism, the quenching data was processed according to the Stern-Volmer Eq. (2) 13, and the results were shown in Table 1.
]
[
1
]
[
1
]
[
1
/
00
I
k
L
K
L
K
L
I
q
sv
D (2)Where, I0 and I are the fluorescence intensities of PPL in the
absence and presence of the TTZ, respectively. kq is the bimolecular quenching constant and [L] is the concentration of the quencher, τ0 is the average lifetime of fluorescence (about 10-8 s) and Ksv is the Stern-Volmer quenching constant. From Table 1, it could be seen that the kq value was greater than 2.0×10¹⁰ L/mol·s at different
temperatures14.The Ksv value was inversely correlated with temperatures. The result indicated that the combination process of TTZ-PPL system was a static quenching process. Stern-Volmer plots of the fluorescence of PPL quenched by TTZ at different temperatures were shown in Fig. 3. The good linear relationship reflected the existence of a single annihilation.
Figure 3: Stern-Volmer plots for the quenching of PPL by TTZ at different temperatures
CPPL= 1.0×10⁻⁶ mol/L, CTTZ=(0, 0.1, 0.5, 1.5, 2.0, 2.5, 3.0, 3.5, 4.0, 4.5) mol/L
The relationship between fluorescence intensity and the concentration of quencher can usually be described using Eq. (3) 15 to obtain the binding constant (Ka) and the number of binging sites (n):
t
a B
I I I n L K
n I
I I
0 0
0 lg nlg
lg (3)
Where [L] and [Bt] are the concentrations of TTZ and PPL, respectively. On the assumption that n in the bracket is equal to 1, the curve of lg(I0-I)/F versus lg{[L]-n[Bt](I0-I)/I} is drawn and linearly fitted, then the value of n can be obtained from the slope of the plot. On the basis of value of n obtained, the binding constant Ka can also be determined. The results were listed in the Table 1. The results showed that all the values of n were approximately equal to 1 at different temperatures, indicating that TTZ had only one high-affinity binding site when bound to PPL 16, that was, TTZ and PPL formed a 1:1 complex. When the temperature rose, the binding constant Ka value was in the order of 104 and showed a decreasing trend, and the binding ability of TTZ to PPL was reduced, which further proved that the TTZ-PPL system was static quenching.
Table 1: Quenching reactive parameters of TTZ-PPL system at different temperatures
λex (nm) T/(K) Ksv (L/mol·s) kq (L/mol) r1 Ka(L/mol) n r2
λex=280 298 1.93×10⁴ 1.86×10¹² 0.9953 2.11×10⁴ 1.21 0.9966
310 1.75×10⁴ 1.61×10¹² 0.9949 1.89×10⁴ 1.11 0.9937
318 1.46×10⁴ 1.34×10¹² 0.9978 1.51×10⁴ 0.94 0.9962
λex=295 298 1.36×10⁴ 1.51×10¹² 0.9912 1.38×10⁴ 1.16 0.9955
310 1.19×10⁴ 1.27×10¹² 0.9949 1.26×10⁴ 1.12 0.9948
318 1.11×10⁴ 0.99×10¹² 0.9922 1.08×10⁴ 0.89 0.9931
Type of interaction force of TTZ-PPL system
Thermodynamic parameters of TTZ-PPL system can be calculated by the van’t Hoff equations 17.
T H S K
Rln / (4)
S T H G
(5)
Table 2: The thermodynamic parameters of TTZ-PPL at different temperatures
system T/(K) Ka/(L/mol) ΔH/(kJ/mol) ΔS/(J/mol·K) ΔG/(kJ/mol)
λex= 280 nm 298 2.11×10⁴ -12.71 40.15 -24.66
310 1.89×10⁴ 40.75 -25.33
318 1.51×10⁴ 40.05 -25.45
R is the gas constant (R=8.314 J/mol·K). Based on the linear fit plot of RlnKa versus 1/T, the ΔH and ΔS values can be obtained. The results obtained are listed in Table 2. It can be seen from Table 2 that ΔG<0, indicating that the quenching reaction of TTZ to PPL was spontaneous; ΔS>0, suggesting that there was hydrophobic interaction between TTZ and PPL; ΔH<0 cannot be used as a sign of inter molecular electrostatic attraction, Ross pointed out that when ΔH≈0, ΔS>0, it could be considered as electrostatic attraction, and ΔH<0 is considered as the result of hydrogen bonding 18-20. Therefore, the force between TTZ and PPL was mainly hydrophobic interaction and hydrogen bonding.
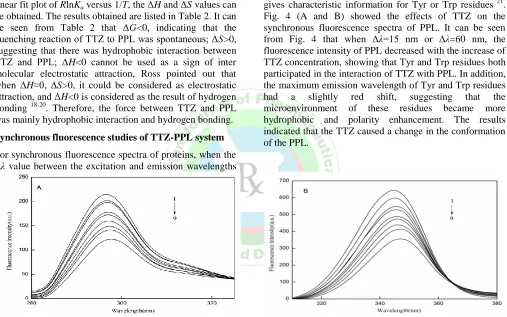
Synchronous fluorescence studies of TTZ-PPL system
For synchronous fluorescence spectra of proteins, when the Δλ value between the excitation and emission wavelengths
is stabilized at 15 or 60 nm, the synchronous fluorescence gives characteristic information for Tyr or Trp residues 21. Fig. 4 (A and B) showed the effects of TTZ on the synchronous fluorescence spectra of PPL. It can be seen from Fig. 4 that when Δλ=15 nm or Δλ=60 nm, the fluorescence intensity of PPL decreased with the increase of TTZ concentration, showing that Tyr and Trp residues both participated in the interaction of TTZ with PPL. In addition, the maximum emission wavelength of Tyr and Trp residues had a slightly red shift, suggesting that the microenvironment of these residues became more hydrophobic and polarity enhancement. The results indicated that the TTZ caused a change in the conformation of the PPL.
Figure 4: synchronous fluorescence spectra of TTZ-PPL system (T=298 K). (A) Δλ=15 nm; (B) Δλ=60nm
CPPL=1.0×10⁻⁶ mol/L, 1~9 CTTZ=(0, 0.1, 0.5, 1.5, 2.0, 2.5, 3.0, 3.5, 4.0)×10-5 mol/L
UV-vis absorption spectra studies of TTZ-PPL system
The UV-vis absorption spectra of TTZ-PPL system was shown in Fig. 5. PPL had two absorption peaks, the strong absorption peak at about 208 nm reflects the framework conformation of the protein, the weak absorption peak at about 280 nm appears to be due to the aromatic amino acids (Trp, Tyr, and Phe) 22. With gradual addition of TTZ to PPL solution, the intensity peak of PPL at 208 nm decreased with a red shift and the intensity of the peak at 280 nm had minimal changes (Fig. 5). The intensity of the absorption peak at 280 nm was reduced, illustrating that the interaction between TTZ and PPL happened in the ground-state molecules. The results showed that type of fluorescence quenching of TTZ-PPL system was static quenching 23. This
conclusion was consistent with the conclusion of the fluorescence quenching experiment.
Figure 5: Absorption spectrum of TTZ-PPL system (T=298 K)
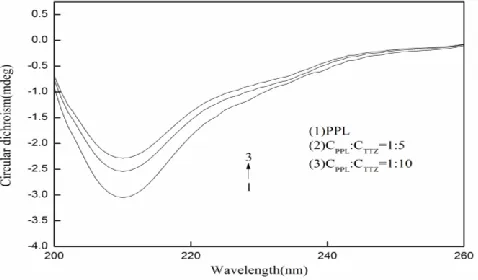
Circular dichroism spectra studies of TTZ-PPL system
Circular dichroism (CD) spectroscopy is commonly used to detect changes in the secondary structure of proteins 24. The CD spectrum of the TTZ-PPL system was shown in Fig. 6. When the concentration ratio of PPL to TTZ was 1:0, 1:5 and 1:10, the α-helix content of PPL decreased from
10.55% to 6.48%. As the concentration of TTZ increased, the absorption intensity of the negative peak gradually decreased, implying that TTZ caused a change in the secondary structure of PPL, and made the protein structure loose. But the peak shape and peak position had not been changed, indicating that the α-helix in the PPL molecule still dominated.
Figure 6: The circular dichroism spectra of TTZ-PPL system (T=298 K)
CPPL= 1.0×10⁻⁶ mol/L; CTTZ= (0, 1.0, 2.0) ×10-5 mol/L
Molecular docking
Molecular docking method can simulate the interaction between small molecules and proteins at the atomic level, so that it can find small molecules at the target protein
binding site and clarify interesting biochemical processes. The best combination mode predicted by the docking software Autodock 4.2.6 was shown in Fig. 7.
Figure 7: Computation docking model of the interaction between TTZ and PPL
TTZ located within the hydrophobic pocket in PPL (B) Detailed illustration of the amino acid residues lining the binding site in the TTZ and PPL cavity
Fig. 7 (A) showed the optimal binding configuration of the TTZ-PPL complex. The active sites of different lipases are usually composed of serine (Ser) residues and histidine (His) residues, and together with aspartic (Asp) residues or glutamic(Glu) residues to form a ternary catalytic center 25. It can be seen from Fig 7(B) that the binding site of TTZ was near the active center of PPL, indicating that the binding of TTZ to PPL might affect the catalytic activity of PPL, and the binding site of TTZ was very close to the residues of Tyr269 and Trp85, as a result, the combination of TTZ and PPL could effectively quench the intrinsic fluorescence of PPL. It is consistent with the conclusion of fluorescence experiment. TTZ was surrounded by various hydrophobic residues, such as Phe335, Tyr269, Leu275, ILE274 and Trp85, which indicated that hydrophobicity promotes the binding process between TTZ and PPL. And the Asn334, Asn92, His264 residues in PPL formed three hydrogen bonds with TTZ, and the bond lengths are 2.241
the main force types of TTZ-PPL system were hydrophobic interaction and hydrogen bonding interaction. Table 3: Docking energy of TTZ-PPL system (unit: kJ/mol)
Protein PDB ID ΔG0 ΔE1 ΔE2 ΔE3
1OIL -22.58 -35.04 -33.33 -1.75
ΔG0 is the binding energy in the binding process.
ΔE1 denotes intermolecular interaction energy, which is a sum of van der Waals energy, hydrogen bonding energy, desolvation free energy and electrostatic energy.
ΔE2 is the sum of van der Waals energy, hydrogen bonding energy and desolvation free energy. ΔE3 is the electrostatic energy.
CONCLUSION
Under simulated physiological conditions, a variety of spectroscopy and molecular docking techniques were used to explore the interaction between TTZ and PPL. Experiments have proved that TTZ has a strong binding ability to PPL, which provides theoretical guidance for further understanding the toxicity of colorants to human and further studies are needed to provide for health risk assessment of food colorants. At present, the use of spectroscopy to study the interaction between proteins and ligands is more and more popular and favored by
researchers. Compared with other research methods such as chromatography, this research method has the advantages of low experimental cost and short measurement period. Therefore, this study provides an important reference for the efficient and rapid study of the interaction between proteins and ligands.
ACKNOWLEDGMENTS
The authors gratefully acknowledge the financial support of National Natural Science Foundation of China (No. 21375032).
REFERENCES
1. Mehedi N, Ainadtabet S, Mokrane N, Addou S, Zaoui C, Kheroua O, Saidi D. Reproductive toxicology of tartrazine (FD and C Yellow No. 5) in Swiss albino mice.[J]. American Journal of Pharmacology & Toxicology.2009; 4(4):130-5.
2. Dorraji PS, Jalali F. Electrochemical fabrication of a novel ZnO/cysteic acid nanocomposite modified electrode and its application to simultaneous determination of sunset yellow and tartrazine. Food Chemistry.2017; 227:73-7.
3. Basu A, Kumar GS. Studies on the interaction of the food colorant tartrazine with double stranded deoxyribonucleic acid. Journal of Biomolecular Structure & Dynamics.2016; 34(5):935-42.
4. McCann D, Barrett A, Cooper A, Crumpler D, Dalen L, Grimshaw K, Kitchin E, Lok K, Porteous L, Prince E, Sonuga-Brake E, Warner JO, Stevenson J. Food additives and hyperactive behaviour in 3-year-old and 8/9-year-old children in the community: a randomised, double-blinded, placebo-controlled tria. Lancet.2007; 370(9598):1560-7.
5. Li CY, Huang ZL, He P, Wu ZQ, Chu ZZ, Wu GD, Zhan FJ. Effect of Isopropanol on Catalytic Kinetics and Molecular Spectrum of Porcine Pancreas Lipase. Chemistry & Bioengineering.2007; 24(9):46-9.
6. Eom SH. Pancreatic Lipase Inhibitory Activity of Phlorotannins Isolated from Eisenia bicyclis. Phytotherapy Research.2013; 27(1):148-51.
7. Zhao L, Hu S, Meng Q, Hu M, Zhang H, Liu R. The binding interaction between cadmium-based, aqueous-phase quantum dots with Candida rugosa lipase. Journal of Molecular Recognition Jmr. 2018; 31(46): e2712.
8. Zhang R, Zhao L, Liu R. Deciphering the toxicity of bisphenol a to Candida rugosa lipase through spectrophotometric methods. Journal of Photochemistry & Photobiology B Biology. 2016; 163:40-6.
9. Ma LH, Liu BS, Wang CD, Zhang HC, Cheng X. The interaction mechanism of nifedipine and pepsin[J]. Monatshefte für Chemie - Chemical Monthly. 2018; 149(11): 2123-30.
10.Elmas G, Esra Y. Fluorescence interaction and determination of sulfathiazole with trypsin. Journal of Fluorescence.2014; 24(5):1439-45.
11.Zhang LH, Liu BS, Li ZY, Guo Y. Comparative studies on the interaction of cefixime with bovine serum albumin by fluorescence
quenching spectroscopy and synchronous fluorescence spectroscopy. Asian Journal of Chemistry. 2015; 30(5): 686-92.
12. Tayyab S, Izzudin MM,Kabir MZ, Feroz SR, Tee WV, Mahanmd SB, Alias Z. Binding of an Anticancer Drug, Axitinib to Human Serum: Fluorescence Quenching and Molecular Docking Study. Journal of Photochemistry & Photobiology, B: Biology. 2016; 162:386-94.
13. Raza M, Yang J, Yun M, Ahand A, Khan A, Yuan QP. Insights from Spectroscopic and In-silico Techniques for the Exploitation of Biomolecular Interactions Between Human Serum Albumin and Paromomycin. Colloids and Surfaces B: Biointerfaces. 2017; 157:242-53.
14. Moeinpour F, Mohseni-shahri FS, Malaekeh-nikouei B, Nassirli H. Investigation into the Interaction of Losartan with Human Serum Albumin and Glycated Human Serum Albumin by Spectroscopic and Molecular Dynamics Simulation Techniques: Acomparison Study. Chemico-Biological Interactions. 2016; 257:4-13.
15. Feroz SR, Teoh YJ, Mohamzd SB, Hong SL, Malek S, Tayyab S. Interaction of Flavokawain B with Lysozyme: A Photophysical and Molecular Simulation Study. Journal of Luminescence. 2015; 160:101-9.
16. Amroabadi MK, Taheri-kafrani A, Saremi LH, Rasteqai AA. Spectroscopic Studies of the Interaction Between Alprazolam and Apo-human Serum Transferrin as a Drug Carrier Protein. International Journal of Biological Macromolecules. 2018; 108:263-71.
17. Naik KM, Nandibewoor ST. Spectroscopic studies on the interaction between chalcone and bovine serum albumin. Journal of Luminescence. 2013; 143:484-91.
18. Salam M, Rokonujjaman M, Rahman A, Sultana UN, Sultan N.Study of in Vitro Interaction of Sildenafil Citrate with Bovine Serum Albumin by Fluorescence Spectroscopy [J]. Pharmacology & Pharmacy. 2015; 6(2):94-101.
19. Ross PD, Subramanian S. Thermodynamics of protein association reactions: forces contributing to stability. Biochemistry. 1981; 20(11):3096-102.
20. Jahanban-Esfahlan A, Panahi-Azar V, Sajedi S. Spectroscopic and molecular docking studies on the interaction between N-Acetyl Cysteine (NAC) and bovine serum albumin[J]. Biopolymers. 2015; 103(11): 638-45.
atomoxetine. Journal of Pharmaceutical Analysis. 2017; 7(3):148-55.
22.Hu X, Yu Z, Liu R. Spectroscopic investigations on the interactions between isopropanol and trypsin at molecular level. Spectrochim Acta A Mol Biomol Spectrosc. 2013; 108:50-4.
23.Cagnardi P, Villa R, Gallo M, Locatelli C, Carli S, Moroni P, Zonca A. Cefoperazone sodium preparation behavior after intramammary administration in healthy and infected cows. J. Dairy Sci. 2010; 93(9): 4105-10.
24.Bhogale A, Patel N, Mariam J, Donger PM, Miotello A, Kothari DC. Comprehensive studies on the interaction of copper nanoparticles with
bovine serum albumin using various spectroscopies. Colloids Surf B Biointerfaces. 2014; 113(13):276-84.
25. Fan ZF, Zeng WC, Dai JL, He Q. Interaction of Epigallocatechin-3-gallate with Porcine Pancreas Lipase. Food Science. 2013; 34(7):20-3.