Prediction of Two-dimensional Impressions of
Images of Facial Emotions using features of EEGs
Abstract
Theviewingofcategoriesoffacialemotionsispredictedusingfeaturesofviewer’sscalppotentials,suchas event-relatedpotentials(ERPs)measuredduringtheviewingofpicturesoffacialemotions.Allvisualstimuli wereratedusing two-dimensionalemotionalscales,and theresponsesforeachviewerwereconverted into sensitivities using item response theory (IRT). This sensitivity to facial emotions can be predicted using discriminationanalysis andtheextractedfeatures ofERPs recordedduringtheviewingofthe images.The categoriesoffacialemotionsviewedwereestimatedtoacertainlevelofsignificanceusingregressionanalysis, andthesensitivitiespredictedfortheemotionalscaleswerecalculatedaccurately,asperformancedepended onthereactionstotheimagesoftheemotions.Theresultsshowedthatcategoriesoffacialemotionsviewed canbepredictedtoalevelofsignificanceusingfeaturesofscalppotentials.
Received on 26 December 2019; accepted on 21 January 2020; published on 23 January 2020 Keywords: Facial Expressions, ERPs, Emotion, Prediction, Item Response Theory
Copyright © 2019 Satoru Waseda etal., licensed to EAI. This is an open access article distributed under the terms of the Creative Commons Attribution license (http://creativecommons.org/licenses/by/3.0/), which permits unlimited use, distribution and reproduction in any medium so long as the original work is properly cited.
doi:10.4108/eai.20-8-2019.162800
1. Introduction
The recognition of facial emotion as a form of human visual information processing has been widely discussed [1]. In particular, individual performance in the perception of facial emotions is often measured and compared [2–4]. The emotional perception process is measured using electroencephalograms (EEG) and other bio-signals [5–7]. Some behavioural analysis suggests that emotional perception activity may promote the reproduction of the certain impressions, such as emotional synchronisation [8]. On the other hand, the emotional impressions viewers perceived have to be determined using their responses, such as by rating using a scale. For the presentation of facial emotions, a two-dimensional survey scale, which is known as an “Affect Grid” and consists of scales for two dimensions: “Pleasant” and “Arousal”, is often used [9]. The performance and validity of the scale have been confirmed in previous studies [10,11].
However, the rating activities produce some individ-ual differences because each individindivid-ual’s emotional sen-sitivity may influence the ratings. This issue sometimes
∗Corresponding author. Email:[email protected]
influencestheperceptionalaccuracyoffacialemotional expressions.Asmostviewersrespondtothe“Pleasant” scale[12],thepicturesoffacialemotionsviewedwere accurately classifiedusing features of EEGsmeasured whiletheimageswereviewed[13].Ifthe rating accu-racyforpicturesoffacialemotionsweretobeimproved, itmaybepossibletopredicttheperceivedcategoriesof emotionsusing the featuresof EEGs.Thismeansthat the developmentof anemotionmonitoringprocedure using viewer’s EEGs could be used to estimate emo-tionalcategoriesundervariousconditions.
Inordertocreaterelationshipsbetweentheviewer’s EEG activityandtheirperceived impressionsof facial emotions, both the EEGs and the rating procedure were analysed carefully, and prediction models were developedtopresenttheassociationsbetweenthetwo. In particular, individual differences in perception of facial emotions and rating behaviour should be considered in order to determine the appropriate relationships.Thispaperfocuses onthesepointsusing a compensation procedure, such as item response theory. The details of theapproach used in thispaper will be summarised in a comparison with previous studiesinthesectionwhichfollows.Inshort,whenthe scoresof emotionalscales wereestimatedusingEEGs,
Satoru Waseda
1and Minoru Nakayama
1,*1Tokyo Institute of Technology, Japan
the emotional categories can be predicted using the estimated scores. In this paper, the following topics will be addressed using experimental data from a previous study [13]:
1. The observer’s rating behaviour concerning the characteristics of individuals was analysed, and item response theory was used. Surveyed responses were analysed, and their effectiveness was evaluated.
2. The possibility of estimating the sensitivity of viewer’s ratings is examined using potentials attached to the scalp while images of facial emotions are viewed.
3. The possibility of predicting both the characteris-tics and emotional category of visual stimuli while images of facial emotions are viewed is examined.
Thefollowingsectionswillfirstbrieflysummarisethe topical papersrelated tothesubject,andthenpresent an experiment which observes the viewer’s subjective evaluationsofimagesoffacialexpressionsandrecords EEGs.In Section 4arethe detailedresponses and the viewer’sbehaviourduringtheratingactivities,withthe predictionproceduresandtheirperformancefollowing inSection5.Section6isadiscussion,andtheextracted resultsaresummarisedinSection7.
2. Related
works
Event-related potentials (ERPs), which sum up EEG waveforms in response to stimuli, are widely used to analyse chronological information processing of picturesoffacialemotions.Thefundamentalapproach isto compare ERP waveforms of twofacial emotions, such as emotional and unemotional expressions [14, 15]. Also, activity areas of the scalp on the brain are measuredforlateranalysisbypresentingvariousfacial emotions, which activate specific regions of the brain [5,16].Byconsideringindividualresponses,theratings forthetwolevelsofemotionscouldbepredictedusing featuresofEEGsorERPs[13].Sincethetwolevelsare relatively different, the possibility of predicting the emotionalcategoryshouldbeconfirmed.
Theperceptionof facialemotionsisoftenmeasured using a two-dimensional scale [17] called an “Affect Grid”[9],whichiswidelyusedtoassessfacialemotions [18]. However, the rating depends on psychophysical measuring issues [19], in addition to the attitude of the viewer and other factors such as some ability to recognise emotions [20]. Even with the data set of published facialemotions, perceptual performance depends greatly on the characteristics of the viewers [3].In order toexplain the individualdifferences, the concept of emotionalsensitivity has been introduced. Individual differences in sensitivity are analysed for
3 ~ 4s
3 ~ 4s
3 ~ 4s 3s
3s
Figure1. Diagramofstimulishown.
their effect on the perception of facial emotions [21– 23],asthissensitivitymayinfluencetheaccuracyofthe ratings[24].
Since the deviations in ratingbehaviourare related to a psychometric issues, item response theory (IRT) [25] can be applied. This technique is very useful to compensate for individual bias in ratings [26]. For facialemotionassessmentexperiments,theIRTmodel has been introduced in order to extract individual characteristics[27].Thistechniquecanstandardisethe ratingvaluesoftheviewers,andtheirresponsescanbe moreeasilycompared.Also,thecharacteristicsofeach individual’s ratingbehaviour areanalysed. Therefore, this technique is introduced to the analysis which follows using the datasetof the previousexperiment [13].
This paper will create relationship models between the viewer’s scalp potentials and their emotional categories during the viewing of pictures of facial emotions. If a possible model can be established, viewer’s perceived emotional categories could be predictedusing the model.The possibility ofthis will beconfirmedinthefollowingsections.
3. Experimental
Method
3.1.
Stimulus
Imagesoffacialexpressionsemployedasvisualstimuli werepreparedusingtheJapaneseandCaucasianFacial Expressionsof Emotion(JACFEE)collection [28].This collection consists of 56 colour photographs of 56 different individuals who illustrate one of the seven different emotions: Anger, Contempt, Disgust, Fear, Happiness,SadnessandSurprise.
1 2 3 4 5 6 7 8 9 1
2 3 4 5 6 7 8 9
Cluster 1 (141) Cluster 2 (195)
Pleasant Feelings Unpleasant
Feelings
High
Arousal
Sleepiness
Figure2. Resultsofclusteranalysisofviewer’sresponsesusing
theAffectGrid.(Bluecirclesindicate“Pleasant”clusterandred blocksindicate“Unpleasant”cluster)[30].
a duration of 6 minutes in total. Three trials were conducted inwhich differentsetswere shownto each subject,followedbyshortbreaks.
Thesubjects,whohadsufficientvisualacuity,were6 maleuniversitystudentsagedbetween19to23years. The contents of the experiment were explained to all participantsinadvance,andinformedconsentwasthen obtained.
3.2.
Measurement
Procedure
Theresponsesevokedbyvisualstimuliweremeasured as scalp potentials, using three electrodes [13]. Three scalp electrodes for measuring EEGs were positioned in the Frontal (Fz), Central (Cz) and Occipital (Oz) areasofthecortex,accordingtotheInternational10-20 system.Theresponses generatedweremeasuredusing abio-amplifier(ADInstruments:PowerLab4/30,ML13) andrecordedassignalsonaPC,atasampling rateof 400Hz,usingalowpassfilterof30Hzandahighpass signalfilterwithatimeconstantof0.3sec.EEGsignals were filtered using a band pass filter of 2.0 to 30Hz. Thoughsubjectrepeatedmeasuredesignwasemployed to determine the factors of the responses, individual differenceswerealsoconsidered.All validparticipants weretestedacrossthreetrialsinordertoobtainreliable measurements.
3.3.
Subjective
evaluation
of
facial
images
To avoid individual differences and misperceptions duringtherecognitionoffacialexpressions,allsubjects were asked to evaluate the facial expression of every photo.Theimpressionsthatthefacialimagesproduced weremeasuredusing an “AffectGrid”, which consists of a two dimensional (9 × 9 point) scale displaying “Pleasant- UnpleasantFeelings”and“High Arousal
-−100−4 0 100 200 300 400 500 600
−2 0 2 4 6
Fz
Amplitude [μV]
−100−4 0 100 200 300 400 500 600
−2 0 2 4 6
Cz
Amplitude [μV]
−100−4 0 100 200 300 400 500 600
−20 2 4 6
Oz
Time [ms]
Amplitude [μV]
Pleasant Unpleasant
Figure 3. ERP comparisons between two clusters of Electrodes
Fz, Cz and Oz, with a dotted line box indicating the time spans where there are significant differences between the two ERPs
(p <0.05) [30].
Sleepiness” ratings. All 56 photos were rated after being used in the three viewing sessions.
The results of the ratings of all subjects across all facial expressions (336 responses: 56 photos × 6 subjects) are summarised in Figure 2 [13]. To extract the rating patterns of the viewers, cluster analysis using the WPGMA method was performed, and two clusters labeled “Pleasant” and “Unpleasant” were formed along the axis of “Pleasant - Unpleasant Feelings” [30]. The percentage of all rated photos rated which are included in the “Pleasant” cluster is 42%.
The ERPs generated between the two clusters on the three electrodes are compared in Figure 3. There are significant differences in potentials between the two clusters on electrodes Fz and Cz at the early stage of perception, around 150ms ∼ 200ms [13]. This result shows evidence that the ERPs respond to images of facial emotions.
3.4. Item response theory
An IRT model was applied to the ratings of two-dimensional emotional impressions using an “Affect Grid” scale.
Pi = 1
1 +exp(−Slope∗(x+thi))
Here, Pi is the probability to obtaining a score,
which is higher than grade i for sensitivity x, which consists of two parameters: Slope and thi. All IRT
parameters in the above equation were estimated using the IRT package as a graded rating model (GRM) [31]. The parameters, Slope and thi, suggest the indices
Table 1. Estimated IRT parameters for “Pleasant” scale
Subjects Slope th1 th2 th3 th4 th5 th6 th7 th8
sub1 4.76 -1.27 -0.57 -0.14# 0.33 0.95 1.09 1.48 -sub2 3.98 -1.34 -1.06 -0.28 0.40 - - 1.28 1.50 sub3 3.17 -1.45 -0.77 -0.23 0.24# 1.04 1.18 1.54 2.02 sub4 5.11 - -0.96 -0.45 0.22# 0.92 1.28 1.50 2.07 sub5 3.18 -2.00 -0.94 -0.42 0.15# 0.67 1.13 1.72 2.70 sub6 3.57 -0.93 -0.63 -0.10# 0.13# 0.46 0.60 1.04 2.15 #: not significant (p >0.10)
Table 2. Estimated IRT parameters for “Arousal” scale
Subjects Slope th1 th2 th3 th4 th5 th6 th7 th8
sub1 3.77 - - -2.17 -1.19 -0.51 -0.19# 0.29 1.09 sub2 1.18 -3.33 -2.68 -1.67 -0.53 0.07# 0.95 1.72 2.88 sub3 2.65 -2.67 -2.28 -1.25 -0.73 -0.32 0.32 0.73 1.27 sub4 2.78 - -2.69 -1.47 -1.35 -0.78 -0.18# 0.74 1.70 sub5 2.34 - -1.97 -1.29 -0.65 -0.06# 0.94 1.57 -sub6 1.23 -2.49 -1.79 - -0.39 0.07# 0.60 1.23 2.02 #: not significant (p >0.10).
-3 -2 -1 0 1 2 3
0.0
0.2
0.4
0.6
0.8
1.0
Sensitivity to “Pleasant” scale
Probability
1 2 3 4 5 7 8 9
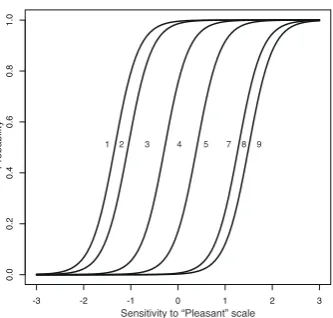
Figure 4. An example of operating characteristic curves (OCCs)
for sub2 in Table1.
respectively. They are estimated using an expectation-maximum (EM) algorithm. In this paper, the SAS procedure was applied [31].
4. Results
4.1. Individual parameters for IRT models
The details of the viewer’s rating behaviour for facial emotional expressions are evaluated using the IRT model mentioned above. The parameters of the IRT equation for each participant were estimated using a piece of software [31]. These parameters are summarised in Tables 1 and 2. The missing grades are not given parameters. In the results of significance
-3 -2 -1 0 1 2 3
0.0
0.2
0.4
0.6
0.8
1.0
Sensitivity to “Pleasant” scale
Probability
1
2 3
4 5-7
8 9
Figure 5. An example of category response curves (CRCs) using
the probabilities for sub2 of “Pleasant” ratings in Figure4.
tests for all parameters, some tests were not significant. These parameters show the rating behaviour, and suggest that rating sensitivity exists.
This is summarised as operating characteristic curves (OCCs), as shown in Figure4. If the spaces between the two curves are narrow, the two ratings may not be easily discriminable.
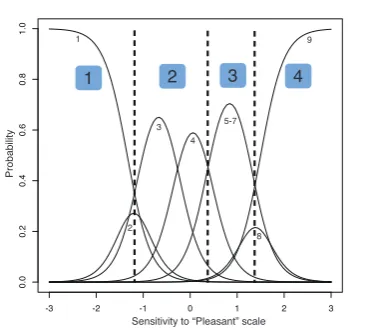
In order to illustrate the difficulty of rating emotional images using the scale, the category response curves (CRCs) which display the probabilities of rating sensitivities are calculated as the differences between the two curves in Figure 4. The results are calculated
as 1−P1 and Pi−1−Pi(i= 2, . . . ,9) and summarised in
rates for “2” and “8” have low probabilities, and they are varied by the neighbouring curves. Therefore, these ratings may not be effective.
4.2. Prediction of ratings for facial emotions using
EEGs
As mentioned in the introduction, the possibility of predicting two-dimensional rating values using the “Affect Grid” scale should be examined using the following features of EEGs and ERPs. Four frequency powers, 6.25, 12.5, 18.75 and 25.0Hz, were calculated for four 160ms durations from 100ms before to 540ms after stimulus onset using electrodes Fz, Cz and Oz. The prediction technique employed used a logistic regression procedure noted as follows:
ˆ
yi =a+b1f eature1,i+· · ·+bnf eaturen,i
pi = logit−1( ˆyi) =
1 1 + exp(−yˆi)
The f eaturen,i consists of the frequency power, as
mentioned above. Suffixirepresents one subject’s trial. The performance of each subject was evaluated using a subject leave-one-out procedure which measured the performance of a subject using a model consisting of the remaining subjects.
Predictions based on Single-trial features. The 9-point scale ratings were predicted using frequency powers for 3-channel EEGs. In order to consider individual differences, prediction functions were produced for each subject. The analysed data consisted of 168 sets (single trials: 56 photos ×3 sessions) with 48 features (frequency band: 4× electrodes: 3 ×time zone: 4) for each subject. The prediction models were evaluated using a subject leave-one-out procedure.
The prediction performance remained around the level of chance (accuracy = 12.89%), however. During the analysis, two major points were extracted as causes of the reduced performance, such as ambiguous rating behaviour and deviations in features. As mentioned in the previous section, the sensitivity of the rating scale is sometimes relatively low. In regards to the overall features of the category response curves for all subjects, the rating scales should be reduced from 9 to 4 points. Also, single-trial EEGs contained a lot of noise, so that ERPs were calculated for the identical pictures over three sessions.
Predictions based on ERPs for 3 trials. The picture ratings were converted into a 4 point scale to better reflect individual responses on a scale. The conversion considered the sizes of the areas in the category response curves in Figure 5. As a result, Figure 6
shows an example for a case of sub2, with three new
-3 -2 -1 0 1 2 3
0.0
0.2
0.4
0.6
0.8
1.0
1 2 3 4
Sensitivity to “Pleasant” scale
Probability
1
2 3
4 5-7
8 9
Figure 6. An example of a modified scale which considers CRCs
in Figure5.
Table 3. Prediction performance for ”Pleasant” scale
Converted Prediction
Rating 1 2 3 4 Total
1 13 27 3 0 43
2 44 110 27 2 183
3 1 20 36 4 61
4 0 0 6 43 49
Total 58 157 72 49 336
criteria and four levels applied to rate sensitivities. The ERPs were calculated from 3 sessions for each image of a facial emotion, and prediction analysis of the four levels was then applied to 56 sets (ERPs for 3 trials) with 48 features. The logistic regression technique was also applied, and the prediction was based on the highest probability of the four levels. All features were employed in the prediction.
Prediction performance was evaluated using a subject leave-one-out procedure which predicted the responses of each subject using a model trained with response data of the remaining subjects.
The results for the four levels in “Pleasant” is summarised in Table3. The rows indicate 4-point scale ratings and the columns indicate predicted ratings. Therefore, the diagonal cells show correct predictions. The rating is an ordered scale, and the rank correlation coefficients can be calculated from these. Though the frequencies for lower or higher ratings, such as “1” or “4” are lower, certain numbers of predictions of these were observed. The rank correlation coefficients are
Accuracy of “Pleasant” scale
Accuracy of “Arousal” scale
Level of chance
Figure 7. Prediction performance of emotional scales for
“Pleasant” and “Arousal”, and their means.
Happiness Surprise Fear
Contempt
Sadness Disgust
Anger
Sensitivity to “Pleasant” scale
Sensitivity to “Arousal” scale
Figure 8. Mean IRT factor scores from “Affect Grid” rating scores
in Figure2
The result shows that both emotional scales can be estimated using features of ERPs, when the responses to the scales are characterised using IRT models.
5. Prediction of characteristic values for each facial
image
5.1. Sensitivity to the pictures presented
As mentioned in the section above, the IRT procedure can provide rating scores which consider the charac-teristics of individuals. Mean scores of sensitivity for both the “Pleasant” and “Arousal” scales of each image, which were rated by participants during the experiment as shown in Figure2, summarise sensitivities using IRT analysis, and are shown in Figure 8. This figure illus-trates that the emotional states in the pictures presented
are almost always reproduced using the sensitivities, and the 8 pictures of each specific emotional category are located in positions surrounding each of the emo-tions. Therefore, participants might recognise most of the facial emotions in the pictures presented, and rate them according to their individual bias.
In comparison with previous studies such as Rus-sel & Bullock [17], positive ratings for the “Arousal” scale were suppressed. Some factors in this experi-ment might have influenced the impressions of view-ers. Though several facial emotions, such as “Anger”, “Disgust”, “Fear” and “Surprise”, are located in neigh-bouring positions of the scales [17], the discrep-ancy seems unclear because the amplitudes of both scales are relatively small. Another previous study suggested that the recall rate for emotions is almost as high as it is for emotional perception (“Hap-piness”:98.3%, “Surprise”:92.3%, “Fear”:54.6%, “Dis-gust”:74.7%, “Anger”:64.2%, “Sadness”:71.9%, “Con-tempt”:76.7%) [3]. This performance may reflect the speed and accuracy of perception of facial emotions [2,4,32].
In this section, the possibility of predicting the sensitivity of each picture of a facial emotion is discussed using observed features of EEG signals during viewing.
5.2. Prediction of sensitivity values from EEG signals
during viewing
Prediction procedure. Since the perception of facial emotions may affect viewer’s EEG responses, the relationships between features of EEG waveforms and the sensitivity towards emotional impressions when viewing pictures of facial emotions are analysed. The procedure for predicting the sensitivities of both “Pleasant” and “Arousal” from features of EEG signals was developed using logistic regression analysis of both of the sensitivities and the sets of EEG features for each photo. Each viewer rated the 56 pictures of facial emotions using the “Affect Grid”. Mean sensitivities of 56 pictures of facial emotions are estimated using features of EEGs of viewers, as shown in Figure 8. The features of EEGs are extracted using the following procedures, as shown in Figure9:
1. The ERP waveforms of all viewers from every trial were summed up (56 ERP waveforms).
2. Both Fz and Cz were selected as the targeted elec-trodes since emotional reactions were confirmed in Figure3.
−100−4 0 100 200 300 400 500 600 −20
2 4 6
Amplitude [μV]
Time [ms]
40ms 160ms
Figure 9. ERP feature extraction procedure: 160ms windows move stepwisely by 40ms.
Pleasant Arousal
3 2 1 0 -1 -2 -3 3
2
1
0
-1
-2
-3
Sensitivity to emotional metrics
Predicted sensitivity to emotional metrics
Figure 10. Relationship between Sensitivity to emotional metrics
and Predicted values.
4. Since some delayed responses to images of facial emotions were observed, the observation time window at 160ms moved step-wisely from 0ms-160ms to 440ms-600ms in 12 steps, in order to cover temporal changes in the wide range of images, as Figure3shows.
5. As a result, 192 dimensional features (2ch × 8 frequency powers×12 time zones) were extracted from ERPs for 56 pictures of facial emotions.
The sensitivity values were also predicted using a logistic regression function which is mentioned in the section above. In order to extract the key features of the estimation, the optimisation of feature selection was conducted using a stepwise procedure.
Prediction results. As a result of the optimisation process, two regression functions for each sensitivity toward facial emotions were produced. For the values of the “Pleasant” scale, the function consisted of four features (R2= 0.58): three features came from 2.5, 5,and 12.5Hz on the Cz electrode at 240 ∼ 400ms, and one feature came from 7.5Hz on the Cz electrode at 160 ∼ 320ms. For the values of the “Arousal” scale, the function consisted of five features (R2= 0.37): two
features came from 2.5 and 10Hz on the Fz electrode at
Sensitivity to “Pleasant” scale
Sensitivity to “Arousal” scale
Happiness Surprise
Fear
Contempt
Sadness Disgust
Anger
Figure 11. Measured and predicted sensitivities for seven
emotional categories (Error bars indicate Standard Errors).
280ms∼440ms and 440ms∼600ms respectively, and three features came from 10, 15, and 20Hz on the Cz electrode at 40ms∼200ms, 240∼400ms, and 280ms∼ 440ms respectively.
Most features were selected from around 200ms ∼ 400ms, which might be an image processing phase after the perception of emotional images was detected in Figure 3. Also, most features came from the Cz electrode. In regards to the 9 ERP features of each picture viewed, two-dimensional sensitivities were predicted using the two functions above.
These predicted values are compared with the original values as an index of sensitivity to emotional metrics, in Figure10. They are strongly correlated with each other, and the correlation coefficient for “Pleasant” is 0.76, and 0.61 for “Arousal”. Therefore, the prediction functions almost exactly reproduced the sensitivity values of the features of ERPs during the viewing of images of facial emotions. Though the regression line is almost a diagonal one, the range of the predicted values is more narrow than the deviation of the original values (“Pleasant”:[-1.4,2.3]→[-1.1,2.1], “Arosal”:[-2.3,1.3]→ [-1.2,1.2]).
valuesofsensitivityforthe8picturesineachcategory of emotionaresummarised alongwith theirstandard errors,inFigure11.Thesemeansareconnectedbylines tocreateapolygonshowingfacialemotionsensitivities. As the means of sensitivity for “Happiness” and “Sadness”arerelativelylarge,thesefacialimagescanbe recognisedmoreeasily.Additionalmeansofsensitivity are calculated using the predicted values which are illustratedinFigure10.Allplotsformeansofpredicted values are located inside the polygon. As Figure 11
shows, some emotions are locatedaround the central position of the “Affect Grid”, which suggests a non-emotional,orneutralimpression.Inparticular,thefour emotions “Surprise”, “Fear”, “Disgust”, and “Anger” almost over-lap each other. Though the sensitivity values were almost all predictedusing the optimised regression functions, and were correlated with the original values, the prediction performance between facial emotions was different, as Figure 11 shows. Because the estimation conducted was based on ERP waveforms, some key pieces of information can be detectedatotherpointsonviewerscalps.
Thisresultsuggeststhatthepredictionofsensitivities of facialemotions cannotbe estimated forall images, though the overall tendencies can almost all be reproduced. The improvement of these insufficient estimationprocedures willbea subjectof ourfurther study.
6. Discussion
Thispaper examinesthe possibilityof predicting two-dimensionalscalesofemotionalimpressionsduringthe viewingimages of facial emotions,using severalscalp potentials of the viewers.Since EEG responses during the viewing of facial images may reflect the viewer’s facial image processing process, these activities must suggest that viewers recognised the emotional impressions they saw. In general, recording EEGs requiresmany electrodes,suchas16chormore,based on the international 10/20 system, and the measurementofscalpresponsesduringevery-daylifeis not easy. Therefore, this study conducted a feasibility study of prediction of emotional scales of images of facial emotions viewed using only several scalp responses,wherethesepotentialsweremeasuredusing just two or three electrodes. As the previous studies suggested, individual differences always influenced most of the metrics. In Section 4, the individual differencesinratingbehaviourwereconfirmed,andthe deviationsinresponsesduetoindividualcharacteristics were compensated for using IRT models. As a result, individual accuracy for both emotional scales was significantwhenthepredictionmodelswereused,and the deviations between subjects were suppressed, as Figures7and8show.
Theestimationof the7emotionalcategoriesofboth emotional scales is possible using ERP signals during thepredictionphase,buttheaccuracyisinsufficientfor some emotions, as Figure 11 shows. Since the ERP signals were based on two electrodes, these limited information resources might influence performance. Because this feasibility study was conducted using a smallnumberofparticipants,thevalidityoftheresults and the ability to use the procedure should be confirmedwithalargernumberofparticipants.
The final goal of this study is to predict a viewer’s emotional condition using simple biological information and images of goods and services. In a sense,thispreliminaryworkconfirmsthepossibilityof the plan. In order to develop a more detailed examination process,additional biologicalinformation andtheindividualdifferencesofthemanyparticipants shouldbeexamined.Thesestudieswillbethesubjectof ourfurtherstudy.
7. Conclusion
In order to estimate viewer’s emotional states in response to viewing images of facial emotions, the possibility of estimating viewer’s perceived rates of emotional impressions in two-dimensions were examined using their EEGs recorded while viewing the facial emotion visual stimuli. In the results, the followingpointswerediscovered.
1. Viewer’s rating behaviour, which was based on two-dimensional emotions such as “Pleasant” and “Arousal” were analysed using an “Affect Grid” which involved applying item response theory (IRT) in order to compensate for individual characteristics in the perception of images of facial emotions. It was confirmed that the intensities which were calculated represented the categories of facial emotions viewed almost exactly.
2. Using the extracted features of ERPs, which were summed up using EEGs from the three viewings of each individual and picture, viewer’s rating sensitivities can be estimated accurately using discrimination analysis based on the IRT analysis.
Therecognitionoffacialemotionsisbasedonhuman imageprocessingandemotionsensitivity,andtherefore widerandmoreaccuratecollectionofinformationfrom scalp activity may be required. The improvement of performance and the introduction of more effective feature extraction procedures for more accurately predicting emotional expressions will be a subject of ourfurtherstudy.
References
[1] Bruce, V. (1988) Recognising faces (London, UK:
Lawrence Erlbaum Associations Ltd.).
[2] Kirouac, G.andDoré, F.Y.(1984) Judgement of facial
expressions of emotion as a function of exposure time. Perception and Motor skills59: 147–150.
[3] Biehl, M.,Matsumoto, D.,Ekman, P.,Hearn, V.,Heider, K., Kudoh, T. and Ton, V. (1997) Matsutmoto and
Ekman’s Japanese and Cacasian facial expressions of emotion (jacfee): Reliability data and cross-national differences.Journal of Nonverbal Behavior21(1): 3–21. [4] Scherer, K.R. and Scherer, U. (2011) Assessing the
ability to recognize facial and vocal expressions of emotion: Construction and validation of the emotion recognition index.Journal of Nonverbal Behavior35: 305– 326.
[5] Batty, M.andTaylor, M.J.(2003) Early processing of
the six basic facial emotional expressions.Cognitive Brain Research17: 613–620.
[6] Lin, Y.P., Wang, C.H., Jung, T.P., Wu, T.L. and Jeng, S.K. (2010) EEG-Based emotion recognition in music
listening. IEEE Transaction on Biomedical Engineering 57(7): 1798–1806.
[7] Petrantonakis, P.C. and Hadjileontiadis, L.J. (2010)
Emotion recognition from EEG using higher order crossings.IEEE Transaction on information technology in biomedine14(2): 186–197.
[8] Suzuki, A. (2014) Facial expression recognition and
embodied simulation. Japanese Psychological Review 57(1): 5–23.
[9] Russell, J.A., Weiss, A.andMendelsohn, G.A.(1989)
Affect grid: A single-item scale of pleasure and arousal. Journal of Personality and Social Psychology 57(3): 493– 502.
[10] Takehara, T. and Suzuki, N. (2001) Robustness of
the two-dimensional structure of recognition of facial expression: evidence under differentt intensities of emotionality.Perception and Motor Skills93: 739–753. [11] Shibui, S. and Shigemasu,K. (2005) A model of
two-dimensional placement of the facial expressions of emotion.The Japanese Journal of Psychology76(2): 113– 121.
[12] Barrett, L.F.(2006) Solving the emotion paradox:
Cate-gorization and the experience of emotion.Personality and Social Psychology Review10(1): 20–46.
[13] Nakayama, M.andYasuda, M.(2019) Feature
character-istics of erps and eye movements in response to facial expressions.EAI Endorsed Transactions on Context-aware Systems and Applications18(15)(e3): 1–9.
[14] Eimer, M.andHolmes, A.(2002) An erp study on the
time course of emotional face processing. NeuroReport 13: 1–5.
[15] Holmes, A.,Nielsen, M.K.andGreen, S.(2008) Effects
of anxiety on the processing of fearful and happy faces: An event-related potential study. Biological Psychology 77: 159–173.
[16] Eimer, M. andHolmes, A. (2007) Event-related brain
potential correlates of emotional face processing. Neuropsychologia45: 15–31.
[17] Russell, J.A.andBullock, M.(1985) Multidimensional
scaling of emotional facial expressions: Similarity from preschoolers to adults. Journal of Personality and Social Psychology48(5): 1290–1298.
[18] Adolphs, R. (2002) Recognizing emotion from facial
expressions: Psychological and neurological mecha-nisms. Behavioral and Cognitive Neuroscience Reviews 1(1): 21–62.
[19] Marneweck, M., Loftus, A. and Hammond, G. (2013)
Psychophysical measure of sensitivity to facial expres-sion of emotion.Frontiers in Psychology4(63): 1–6. [20] Schlegel, K.,Palese, T., Mast, M.S., Rammsayer, T.H.,
Hall, J.A.andMurphy, N.A.(2019) A meta-analysis of
the relationship between emotion recognition ability and intelligence.Cognition and Emotion34(1): 1–23.
[21] Gao, X., Chiesa, J., Maurer, D. and Schmidt, L.A.
(2014) A new approach to measuring individual differences in sensitivity to facial expressions: influence of temperamental shyness and sociability. Frontiers in Psychology5(26): 1–9.
[22] Fischer, A.H., Kret, M.E. and Broekens, J. (2018)
Gender differences in emotion perception and self-reported emotional intelligence: A test of the emotion sensitivity hypothesis.PLoS ONE13(1): 1–19.
[23] Rutter, L.A., Scheuer, L., Vahia, I.V., Forester, B.P., Smoller, J.W. and Germine, L. (2019) Emotion
sensitivity and self-reported symptoms of generalized anxiety disorder across the lifespan: A population-based sample approach.Brain and Behavior9(6): 1–7.
[24] Lyusin, D. and Ovsyannikova, V. (2016) Measuring
two aspects of emotion recognition ability: Acuracy vs. sensitivity.Learning and Individual Differences 52: 129– 136.
[25] Linn, R.L. (1989) Educational measurement, 3rd edition
(New York, USA: Collier Macmillan Publishers). [26] Uto, M.andUeno, M.(2018) Empirical comparison of
item response theory models with rater’s parameters. Heliyon4: 1–32.
[27] Suzuki, A., Hoshino, T. and Shigemasu, K. (2006)
Measuring individual differences in sensitivities to basic emotions in faces.Cognition99: 327–353.
[28] Matsumoto, D. and Ekman, P. (1988), Japanese and
Caucasian facial expressions of emotion (JACFEE) and neutral faces (JACNeuF). San Fransisco State University, San Francisco, CA, USA.
[29] Brainard, D.H. (1997) The Psychophysics Toolbox.
Spatial Vision10: 433–436.
Acknowledgement
This research was partially supported by
[30] Yasuda, M.,Dou, Z.andNakayama, M.(2015) Features
of event-related potentials used to recognize clusters of facial expressions. In Proceedings of International Conference on Bio-inspired Systems and Signal Processing (BIOSIGNAL 2015): 165–171.
[31] SAS, SAS/STAT 14.1 User’s Guide: The IRT
Proce-dure. URLhttps://support.sas.com/documentation/
onlinedoc/stat/141/irt.pdf.
[32] Colonnello, V.,Russo, P.M.andMattarozzi, K.(2019)
![Figure 2. Results of cluster analysis of viewer’s responses usingthe Affect Grid. (Blue circles indicate “Pleasant” cluster and redblocks indicate “Unpleasant” cluster) [30].](https://thumb-us.123doks.com/thumbv2/123dok_us/8411670.1691022/3.595.312.543.85.251/analysis-responses-usingthe-aect-pleasant-redblocks-indicate-unpleasant.webp)