University of Pennsylvania
ScholarlyCommons
Publicly Accessible Penn Dissertations
2019
Discovering Pathway And Cell Type Signatures In
Transcriptomic Compendia With Machine
Learning
Gregory Philip Way
University of Pennsylvania, [email protected]
Follow this and additional works at:
https://repository.upenn.edu/edissertations
Part of the
Biology Commons,
Computer Sciences Commons, and the
Genetics Commons
This paper is posted at ScholarlyCommons.https://repository.upenn.edu/edissertations/3266 For more information, please [email protected].
Recommended Citation
Way, Gregory Philip, "Discovering Pathway And Cell Type Signatures In Transcriptomic Compendia With Machine Learning" (2019). Publicly Accessible Penn Dissertations. 3266.
Discovering Pathway And Cell Type Signatures In Transcriptomic
Compendia With Machine Learning
Abstract
Gene expression measurements capture downstream biological responses to molecular perturbations. This systems biology perspective can be investigated using both supervised and unsupervised machine learning approaches to rapidly derive insight, including cell type and pathway signatures, from transcriptomic
compendia. Machine learning applied to transcriptomic compendia can aid in biological discovery, hypothesis generation, and precision medicine. We introduce these topics and discuss their impact in Chapter 1. In Chapters 2-4, we describe and extend a supervised learning approach to detect aberrant gene and pathway activity in cancer. We apply this approach to identify patient tumors, cell lines, and patient derived xenograft models with TP53 loss of function, Ras signaling activation, and NF1 loss. This approach facilitates the discovery of phenocopying variants and potential hidden responders to specific therapies. In Chapters 5-6, we focus on deriving transcriptomic signatures using unsupervised learning. We show that unsupervised learning can identify disease subtypes and can be used to develop gene expression signatures without the need to specify labels a priori. In Chapter 5, we assess the reproducibility of high grade serous ovarian cancer (HGSC) gene expression subtypes across populations and clustering algorithms. In Chapter 6, we train a variational autoencoder on patient tumors and use latent space arithmetic to identify gene signatures most distinguishing HGSC subtypes. Lastly, in Chapter 7, we develop an approach to rapidly interpret compressed features engineered in unsupervised learning algorithms. We train a series of unsupervised models across a wide range of latent space dimensions and develop a network-based method for interpreting these compressed gene expression features. Using this approach, we observe that modifying the hidden layer dimensionality impacts the identification of specific geneset and cell-type activation patterns in cancer and normal tissue. Machine learning models scale to large genomic datasets and have provided state of the art results in a variety of biomedical domains. However, model interpretation is critical to build knowledge and to generate hypotheses.
Degree Type
Dissertation
Degree Name
Doctor of Philosophy (PhD)
Graduate Group
Genomics & Computational Biology
First Advisor
Casey S. Greene
Keywords
Cancer, Gene Expression, Machine Learning
Subject Categories
Biology | Computer Sciences | Genetics
DISCOVERING PATHWAY AND CELL TYPE SIGNATURES IN TRANSCRIPTOMIC
COMPENDIA WITH MACHINE LEARNING
Gregory Philip Way
A DISSERTATION
in
Genomics and Computational Biology
Presented to the Faculties of the University of Pennsylvania
in
Partial Fulfillment of the Requirements for the
Degree of Doctor of Philosophy
2019
Supervisor of Dissertation
______________________
Casey S. Greene, Ph.D.
Associate Professor of Pharmacology
Graduate Group Chairperson
______________________
Benjamin F. Voight, Ph.D.
Associate Professor of Pharmacology
Dissertation Committee:
Chair: John M. Maris, M.D., Professor of Pediatrics Yoseph Barash, Ph.D., Associate Professor of Genetics Nancy R. Zhang, Ph.D., Professor of Statistics
DISCOVERING PATHWAY AND CELL TYPE SIGNATURES IN TRANSCRIPTOMIC
COMPENDIA WITH MACHINE LEARNING
COPYRIGHT
2019
Gregory Philip Way
This work is licensed under the Creative Commons Attribution-NonCommercial-ShareAlike 3.0 License
To view a copy of this license, visit
iii
iv
ACKNOWLEDGMENTS
I would like to first thank Casey Greene for being a thoughtful and inspiring mentor
and leader. I would also like to thank my thesis committee: John Maris, Yoseph Barash,
Nancy Zhang, and Josh Stuart for providing invaluable guidance and insight as my
projects were coming together. Thank you to the GCB administration of Li San Wang,
Ben Voight, Hanna Chervitz, and Maureen Kirsch for their leadership, support, and for
making my transfer to Penn from Dartmouth as smooth as possible. Thank you also to
the 2014 Dartmouth QBS administrators Jason Moore, Anna Greene, and Krissy Giffin
for helping me to navigate a PhD program. I would also like to thank my Penn GCB
student cohort of Zerry Zhou, Di Zhang, Apexa Modi, Samantha Klasfeld, and Onur
Yoruk. Thank you to my Dartmouth QBS cohort of Jeff Thompson, Chris Rees, Elle
Nutter, Jen Franks, Sara Lundgren, and Mavra Nasir as well. Both groups provided
incredible support and friendship. I would also like to extend a special thanks to Maya
Bucan and Junhyong Kim for excellent training opportunities and insightful discussions.
The Greenelab was an amazing environment to grow as a scientist and to learn
computational biology and data science. I would like to specifically thank Daniel
Himmelstein and alumni Jaclyn Taroni, Jie Tan, and Brett Beaulieu-Jones for consistent
and amazing feedback and for their great scientific intuition. Many others in the
Greenelab including YoSon Park, Qiwen Hu, David Nicholson, Alex Lee, Michael Zietz,
Amy Campbell, Tim Chang, Kathy Chen, Chris Williams, and James Rudd were
instrumental in fostering a scientifically rigorous yet comfortable environment. I would
also like to thank the software engineers in the Greenelab including Dongbo Hu, Matt
Huyck, Rene Zelaya, Kurt Wheeler, and Deepa Prasad for their amazing support and
v
I am also extremely grateful to all of my collaborators that I have had the pleasure of
working with and learning from over the past several years. I would like to specifically
thank Jen Doherty, Yolanda Sanchez, Brock Christensen, Struan Grant, Elana Fertig,
and Jo Lynne Rokita for their scientific insight and productive collaborations. I would also
like to thank members of The Cancer Genome Atlas Research Network including Chen
Wang and Nikki Schultz for their great organizational skills, inspiration, and expertise.
Lastly, I would like to thank my family – past, present, and future. Thank you to my
parents, John and Lourdes, for raising me to have a strong work ethic and grit. Thank
you to my brother, Stewart, and sister-in-law, Paulina, for all of your support and internet
memes. Jessica, thank you for riding this roller coaster with me through each and every
thrill, dip, and turn. Also thank you Myshkin for your stress-erasing greetings upon
returning home from work every day. I would also like to thank my grandparents Ruth,
vi ABSTRACT
DISCOVERING PATHWAY AND CELL TYPE SIGNATURES IN TRANSCRIPTOMIC
COMPENDIA WITH MACHINE LEARNING
Gregory Philip Way
Casey S. Greene
Gene expression measurements capture downstream biological responses to
molecular perturbations. This systems biology perspective can be investigated using
both supervised and unsupervised machine learning approaches to rapidly derive
insight, including cell type and pathway signatures, from transcriptomic compendia.
Machine learning applied to transcriptomic compendia can aid in biological discovery,
hypothesis generation, and precision medicine. We introduce these topics and discuss
their impact in Chapter 1. In Chapters 2-4, we describe and extend a supervised learning
approach to detect aberrant gene and pathway activity in cancer. We apply this
approach to identify patient tumors, cell lines, and patient derived xenograft models with
TP53 loss of function, Ras signaling activation, and NF1 loss. This approach facilitates
the discovery of phenocopying variants and potential hidden responders to specific
therapies. In Chapters 5-6, we focus on deriving transcriptomic signatures using
unsupervised learning. We show that unsupervised learning can identify disease
subtypes and can be used to develop gene expression signatures without the need to
specify labels a priori. In Chapter 5, we assess the reproducibility of high grade serous
ovarian cancer (HGSC) gene expression subtypes across populations and clustering
algorithms. In Chapter 6, we train a variational autoencoder on patient tumors and use
latent space arithmetic to identify gene signatures most distinguishing HGSC subtypes.
vii
engineered in unsupervised learning algorithms. We train a series of unsupervised
models across a wide range of latent space dimensions and develop a network-based
method for interpreting these compressed gene expression features. Using this
approach, we observe that modifying the hidden layer dimensionality impacts the
identification of specific geneset and cell-type activation patterns in cancer and normal
tissue. Machine learning models scale to large genomic datasets and have provided
state of the art results in a variety of biomedical domains. However, model interpretation
viii
TABLE OF CONTENTS
ACKNOWLEDGMENTS
... iv
ABSTRACT
... vi
LIST OF TABLES
... xii
LIST OF ILLUSTRATIONS
... xiii
Chapter 1.
... 1
An Introduction to discovering pathway and cell type signatures in
transcriptomic compendia with machine learning
... 1
1.1. Introduction ... 1
1.2. Supervised learning to isolate expression signatures ... 4
1.2.1. A brief overview of supervised machine learning methodology ... 5
1.2.2. Initial successes of supervised machine learning applied to transcriptome data ... 5
1.2.3. Supervised machine learning to derive cell type and pathway signatures ... 6
1.3. Unsupervised learning to discover hidden expression states ... 10
1.3.1. A brief overview of unsupervised machine learning algorithms ... 11
1.3.2. Unsupervised machine learning to uncover cell types ... 12
1.3.3. Unsupervised machine learning reveals underlying gene expression states . 14 1.4. Interpreting machine learning models applied to transcriptomes ... 16
1.4.1. Supervised learning models reveal differences between sample statuses ... 16
1.4.2. Unsupervised learning models require interpretation of compressed features ... 17
1.5. Conclusion ... 21
1.6. Acknowledgements ... 21
Chapter 2.
... 22
A machine learning classifier trained on cancer transcriptomes detects NF1
inactivation signal in glioblastoma
... 22
2.1. Abstract ... 22
2.1.1. Background ... 22
2.1.2. Results ... 23
2.1.3. Conclusions ... 23
2.2. Background ... 24
2.3. Methods ... 25
2.3.1. The Cancer Genome Atlas data used for building the classifier ... 25
2.3.2. Hyperparameter optimization of the logistic regression classifier ... 26
2.3.3. Ensemble classifier construction and application to the validation set ... 27
2.3.4. Effect sizes and power analysis ... 28
2.3.5. Validation sample acquisition ... 28
2.3.6. Cell culture ... 29
2.3.7. RNA microarray ... 30
ix
2.3.9. Western blotting ... 31
2.3.10. Reproducibility of computational analyses ... 32
2.4. Results ... 33
2.4.1. Classifier performance ... 33
2.4.2. Identification and characterization of NF1 deficient glioblastoma tumor samples ... 33
2.4.3. Highly contributing genes ... 36
2.5. Discussion ... 38
2.6. Conclusions ... 41
2.7. Acknowledgements ... 41
Chapter 3.
... 42
Machine learning detects pan-cancer Ras pathway activation in The Cancer
Genome Atlas
... 42
3.1. Summary ... 42
3.2. Introduction ... 43
3.3. Results ... 45
3.3.1. Machine learning models to predict pathway activity ... 45
3.3.2. Detecting Ras activation pan cancer ... 46
3.3.3. Ras classifier benchmarking analyses ... 50
3.3.4. Detecting Ras activation in cell lines ... 52
3.3.5. Other Ras pathway variants phenocopy Ras activation ... 55
3.4. Discussion ... 57
3.5. Methods ... 60
3.5.1. Contact for reagent and resource sharing ... 60
3.5.2. Training machine learning classifiers to detect aberrant gene events ... 61
3.5.3. Evaluating machine learning classifiers ... 63
3.5.4. Classifier benchmarking analyses ... 64
3.5.5. Differential expression analysis ... 65
3.5.6. Cell line validation ... 65
3.5.7. Ras pathway and oncogenicity curation ... 66
3.5.8. Quantification and statistical analyses ... 66
3.5.9. Data and software availability ... 67
3.6. Acknowledgements ... 67
Chapter 4.
... 69
Machine learning derived expression signature predicts TP53 inactivation
... 69
4.1. Introduction ... 69
4.2. Results ... 70
4.3. Methods ... 74
4.3.1. In-silico prediction of TP53 inactivation ... 74
4.4. Conclusions ... 76
x
Comprehensive cross-population analysis of high-grade serous ovarian
cancer supports no more than three subtypes
... 78
5.1. Abstract ... 78
5.2. Introduction ... 79
5.3. Methods ... 81
5.3.1. Data inclusion ... 81
5.3.2. Clustering ... 82
5.3.3. Identification of analogous clusters within and across studies ... 83
5.3.4. Clustering analysis of randomized data ... 83
5.3.5. Assessing the reproducibility of single population studies ... 83
5.3.6. Data availability ... 84
5.4. Results ... 84
5.4.1. Clustering ... 84
5.4.2. Correlation of cluster-specific expression patterns ... 84
5.4.3. Comparison with previously-identified HGSC clusters ... 88
5.4.4. Meta-research into previous HGSC subtyping studies ... 90
5.5. Discussion ... 91
5.6. Acknowledgements ... 93
Chapter 6.
... 95
Extracting a biologically relevant latent space from cancer transcriptomes
with variational autoencoders
... 95
6.1. Abstract ... 95
6.2. Introduction ... 96
6.3. Methods ... 98
6.3.1. Model summary ... 98
6.3.2. Model implementation ... 98
6.3.3. Parameter selection ... 100
6.3.4. Input data ... 101
6.3.5. Interpretation of gene weights ... 101
6.3.6. The latent space of ovarian cancer subtypes ... 102
6.3.7. Enabling exploration through visualization ... 102
6.3.8. Reproducibility ... 103
6.4. Results ... 103
6.4.1. Tumors were encoded in a lower dimensional space ... 103
6.4.2. Features represent biological signal ... 104
6.4.3. Interpolating the lower dimensional manifold of HGSC subtypes ... 106
6.5. Conclusions ... 109
6.6. Acknowledgements ... 110
Chapter 7.
... 111
Sequential compression across latent space dimensions enhances gene
expression signatures
... 111
7.1. Abstract ... 111
xi
7.1.2. Results ... 111
7.1.3. Conclusions ... 112
7.2. Introduction ... 112
7.3. Results ... 114
7.3.1. BioBombe implementation ... 114
7.3.2. Assessing compression algorithm reconstruction ... 114
7.3.3. Evaluating model stability and similarity within and across latent dimensions ... 114
7.3.4. Sequential compression can optimize gene expression signature discovery ... 121
7.3.5. Assessing gene set coverage of compressed features ... 122
7.3.6. Assessing sample type correlation differences across latent dimensions .... 125
7.3.7. Interpretation of GTEx blood with VAE compression features ... 129
7.3.8. Validating GTEx neutrophil and monocyte signatures in external datasets .. 130
7.3.9. Using compressed features in supervised learning applications ... 132
7.4. Discussion ... 133
7.5. Conclusions ... 139
7.6. Methods ... 140
7.6.1. Transcriptomic compendia acquisition and processing ... 140
7.6.2. Training unsupervised neural networks ... 141
7.6.3. Optimizing training hyperparameters in neural network architectures ... 142
7.6.4. Training compression algorithms with sequential latent dimensions ... 142
7.6.5. Evaluating compression algorithm performance ... 143
7.6.7. Using BioBombe as a signature discovery tool ... 144
7.6.8. Gene network construction and processing ... 145
7.6.9. Rapid interpretation of compressed gene expression data ... 146
7.6.10. Calculating gene set coverage of sequentially compressed gene expression data ... 147
7.6.11. Downloading and processing publicly available expression data for neutrophil GTEx analysis ... 148
7.6.12. Downloading and processing publicly available expression data for monocyte GTEx analysis ... 149
7.6.13. Machine learning classification of cancer types and gene alterations in TCGA ... 150
7.7. Acknowledgements ... 152
Chapter 8.
... 153
Conclusions
... 153
xii
LIST OF TABLES
Table 5.1: Characteristics of the populations included in the five HGSC data sets... 82 Table 5.2: SAM moderated t score vector Pearson correlations between analogous
clusters across populations... 87 Table 5.3: Distributions of sample membership in the clusters identified in our study
compared to the original cluster assignments in the TCGA, Tothill, and Konecny studies... 89 Table 6.1: Summary of significantly overrepresented pathways separating HGSC
xiii
LIST OF ILLUSTRATIONS
Figure 1.1: RNA sequencing (RNA-seq) provides a systems biology perspective... 2
Figure 1.2: Supervised machine learning to derive cell type and pathway signature... 7
Figure 1.3: Unsupervised machine learning is used to discover cell type proportion and pathway signatures... 14
Figure 1.4: Interpretation of compressed gene expression features... 19
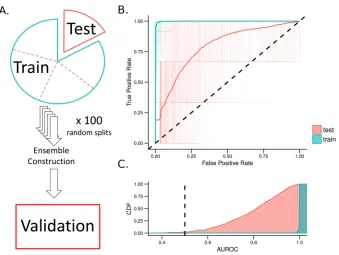
Figure 2.1: Ensemble classifier errors over 100 iterations for TCGA GBM RNAseq... 34
Figure 2.2: Performance of our classifier on an external validation set... 35
Figure 2.3: Genes that contribute to the NF1 classifier performance... 37
Figure 3.1: Supervised machine learning and data integration for TCGA PanCanAtlas... 46
Figure 3.2: Ras pathway alteration percentages in TCGA PanCanAtlas... 47
Figure 3.3: Evaluating machine learning classification of Ras activation... 49
Figure 3.4: Benchmarking PanCanAtlas Ras classifiers... 51
Figure 3.5: Cell line predictions of Ras activity by PanCanAtlas Ras classifier... 54
Figure 3.6: Ras activation across Ras variants and alternative Ras pathway members... 55
Figure 3.7: TCGA PanCanAtlas NF1 classification performance... 56
Figure 3.8: Predicting BRAF status with the TCGA PanCanAtlas Ras classifier... 58
Figure 4.1: Machine learning to predict TP53-inactivating mutations in cancer... 71
Figure 4.2: Pan-Cancer TP53 classifier scores by cancer-type... 72
Figure 4.3: TP53 exon-exon junctions for samples with c.375G>T mutations in TP53.. 74
Figure 5.1: Sample by sample Pearson correlation matrices across HGSC Populations... 85
Figure 5.2: NMF consensus matrices for HGSC datasets when k = 2, k = 3, and k = 4... 86
Figure 5.3: Pearson correlation heatmaps reveal consistency across HGSC datasets... 86
Figure 5.4: Pearson correlation heatmaps of randomly shuffled HGSC datasets... 87
Figure 5.5: Pearson correlations comparing k means and NMF clustering HGSC subtypes... 88
Figure 5.6: Comparing NMF consensus clustering in the Tothill dataset... 91
Figure 6.1: A variational autoencoder (VAE) applied to gene expression data... 99
Figure 6.2: Samples encoded by a variational autoencoder retain biological signals... 104
Figure 6.3: Specific examples of Tybalt features capturing biological signals... 106
Figure 6.4: Largest mean differences in HGSC subtype vector subtraction for each subtype... 108
Figure 7.1: Representing our BioBombe implementation workflow... 115
Figure 7.2: Overview of the BioBombe approach... 116
Figure 7.3: Reconstruction cost across datasets, algorithms and dimensions... 116
Figure 7.4: Assessing algorithm and dimension stability with singular vector canonical correlation analysis (SVCCA)... 118
Figure 7.5: Across algorithm stability as measured by singular vector canonical correlation analysis (SVCCA)... 119
Figure 7.6: Across latent dimension stability as measured by singular vector canonical correlation analysis (SVCCA)... 120
xiv
Figure 7.8: Assessing gene set coverage of specific gene set collections... 124 Figure 7.9: Absolute ranking of the top gene set BioBombe z scores across
algorithms... 125 Figure 7.10: Tracking the dimensions of highest BioBombe enrichment signal... 126 Figure 7.11: Tracking sample correlation across latent dimensions... 127 Figure 7.12: Pearson correlation between input and reconstructed samples in real
and permuted data... 128 Figure 7.13: Interpreting compressed features learned from GTEx using xCell
gene sets... 131 Figure 7.14: Using compressed features as features in supervised machine
1
Chapter 1.
An Introduction to discovering pathway and cell type signatures in transcriptomic
compendia with machine learning
This chapter was adapted from: Way, Gregory, P. and Greene, Casey, S.
“Discovering pathway and cell type signatures in transcriptomic compendia with machine learning.” To appear in Annual Review of Biomedical Data Science, 2019. Preprint: https://peerj.com/preprints/27229/
1.1. Introduction
The quantity of biological data and the pace of their generation have increased
dramatically over the past several years (1). Biological data are also increasing in
complexity, as multiple genomic modalities are being measured with improving
resolution. One such modality measures the transcriptome—the complete RNA products
of about 30,000 genes in a given organism, tissue, or cell. From the relatively low
sample sizes and early days of microarray technology to the large data sets currently
generated through RNA sequencing (RNA-seq) today, researchers have used
transcriptome measurements to interrogate various biological hypotheses (2). RNA
measurements can be used to investigate changes to specific expression patterns of
single genes or pathways. RNA measurements can also be examined from a systems
biology perspective, in which entire biological systems are studied rather than individual
parts. From this perspective, the transcriptome represents downstream molecular
consequences of perturbation or disease and captures alterations to gene regulatory
networks and environmental stimuli (3). In this dissertation, we consider the systems
2
Copy Number Environment
DNA Methylation Alternate Splicing
SNPs or Mutations
miRNA
Histone Modifications Unknown and Other
Mechanisms
Machine Learning
Supervised
Unsupervised
Figure 1.1: RNA sequencing (RNA-seq) provides a systems biology perspective
The downstream response to various molecular and environmental perturbations can be captured as signals in RNA-seq data. Supervised and unsupervised machine learning applied to RNA-seq interrogates this property to reveal expression signatures of cell type and pathway activity.
A significant challenge to transcriptome analyses is making sense of the
high-dimensional data. After data processing, there are many mechanisms by which
hypotheses can be tested and generated (4). One strategy uses machine learning,
which is capable of rapidly deriving insights and providing accurate results. Machine
learning is a branch of computer science used to derive solutions based on
high-dimensional input data and a target goal. By optimizing the target goal, or objective
function, the computer automatically learns a specific, and potentially insightful, solution.
There are many different machine learning algorithms, each with different costs and
benefits, including logistic regression, support vector machines (SVMs), random forests
(RFs), neural networks (NNs), principal components analysis (PCA), non-negative matrix
3
series of specific tunable knobs called hyperparameters. These knobs control how fast
an algorithm learns, how many features are learned, how many times to cycle through
data, and many other important considerations. Hyperparameter decisions can be
configured through cross validation (CV) in a dataset specific fashion. CV optimizes
performance by training on one portion of the data, evaluating performance on the
remaining set, and alternating which portion of the data is removed from training. A
common challenge in training these models is that the model performs well in training
but fails to generalize to new data. To mitigate this problem, termed overfitting,
researchers withhold a portion of the data from training and evaluate it later.
There are two basic classes of machine learning: supervised and unsupervised
learning. Each class can be used with varying goals, but the fundamental purpose of
each is the same: to test how well the model captures the underlying target biology and
to determine if the biology is consistent when the model is applied to new data. While
there are other classes of machine learning, such as semisupervised learning,
reinforcement learning, distantly and weakly supervised learning, and others (5), we
focus here on supervised and unsupervised learning. We apply supervised learning
approaches in Chapters 2, 3, and 4, and discuss unsupervised learning projects in
Chapters 5 and 6. Lastly, we discuss mechanisms to explore the dimensionality of latent
spaces and interpret unsupervised compression models in Chapter 7.
Early efforts applying supervised machine learning to transcriptome data were
largely successful. However, the approaches involved relatively simple supervised
classification tasks such as cancer versus normal detection (6, 7), outcome prediction
(8), or gene module detection (9, 10). Additionally, unsupervised tasks like cancer
subtype discovery (11) and gene pattern identification (12) were also applied in early
4
biology resulted in large sources of variation. Larger data sets have allowed
investigators to test more specific hypotheses and extract more subtle expression
patterns. Many current machine learning algorithms applied to transcriptome data
involve more subtle tasks, including the detection and characterization of pathway- and
cell type–based signatures that exist in an underlying subspace of the observable data.
The extraction of pathway– and cell type–specific gene expression signatures can
reveal the function and heterogeneity of transcriptome data, and these signatures are
often the result of molecular perturbations that may be important to a disease or
phenotype of interest (13–16). Machine learning methods can extract biological signals
(17). In this introduction, we highlight specific machine learning techniques applied to
transcriptomic compendia to reveal underlying patterns representing cell type and
pathway signatures. We discuss supervised and unsupervised machine learning for
tasks including cell type deconvolution, expression signature discovery for the prediction
of pathway activity, and the use of dimensionality reduction, or compression, to uncover
and explain hidden cellular states. We also discuss recent machine learning approaches
to extract pathway activity in single-cell data and recent deep learning algorithm
advancements. Lastly, we focus on specific challenges associated with interpreting
machine learning models.
1.2. Supervised learning to isolate expression signatures
Supervised machine learning applied to transcriptome data is a powerful approach to
test hypotheses about a given model system and to make predictions based on target
biology. Leveraging the ability of the transcriptome to capture the differential
mechanisms underlying biological states (see Figure 1.1), supervised machine learning
can stratify samples and states that are based on specific cell type or pathway
5
methodology, (b) briefly discuss initial landmark studies applying supervised machine
learning to transcriptome data, and (c) conclude with a review of current studies that
train supervised models on large transcriptomic compendia to derive pathway and cell
type signatures.
1.2.1. A brief overview of supervised machine learning methodology
The goal of supervised machine learning is to train a computer to determine the
status of a known sample and to make accurate predictions on a new sample (18).
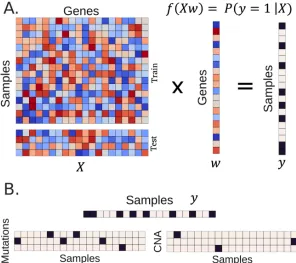
Generally, the models receive as input an n × p data matrix X and a vector y of length n. Here, n is the number of samples, p is the number of features, and y represents the predefined status, or target classes. In many supervised learning algorithms, the models
reach a solution of weights w that are optimized against the classification or regression task, often through an iterative learning process, such as stochastic gradient descent.
Additionally, various algorithms place different emphasis on the training process and
restricting, or regularizing, the solution of weights. For example, one common algorithm
is logistic regression, which can add penalty terms like Lasso or elastic net into the
objective function, which will enforce sparse solutions (19, 20). SVMs maximize the
distance between class labels in feature space, and RFs will determine over many
iterations features used to split samples based on information content (21, 22). There
have been many applications of supervised machine learning across a variety of
domains. Here, we focus on supervised learning applied to deriving cell type and
pathway signatures. In Chapters 2, 3, and 4, we apply supervised learning approaches
to detect aberrant pathway activity in cancer.
1.2.2. Initial successes of supervised machine learning applied to transcriptome data
Various supervised learning algorithms have been applied to transcriptome data for
6
gene expression features, and the vector y is defined by a target hypothesis or measured value. When it is important that only a few genes explain the target
hypothesis, a researcher may prefer models that are constrained to provide sparse
solutions, whereby only a small percentage of measurable genes contribute to
performance. Sparsity may be helpful to define biomarker panels for downstream
analyses. For example, a sparse classifier predicted metastases in breast cancer (24).
This discovery led to the 70-gene Mammaprint panel, demonstrating that only 70 genes
need to be measured to predict breast cancer severity. However, careful validation of
prognostic signatures must be performed, as over 90% of gene signatures with 100
random genes were associated with breast cancer outcomes (25). Additional pioneering
applications of supervised learning to gene expression data have identified top genes
that differentiate acute lymphoblastic leukemia from acute myeloid leukemia (7),
distinguished tumor from normal biopsies (6), predicted treatment response in lymphoma
(8), and predicted the function of novel yeast open reading frames (9). These studies
were performed on microarray data and were limited to small sample sizes. Therefore,
the target goals of these approaches required that the two classes contain large
differences in signal. While these studies did not directly interrogate hypotheses relating
to cell type and pathway activity, the signals identified may have represented differential
cell type or pathway expression. Current applications train machine learning models on
data sets that are orders of magnitude larger, and can thus detect more subtle
signatures hidden in the data.
1.2.3. Supervised machine learning to derive cell type and pathway signatures
Applying supervised machine learning to large transcriptomic compendia allows
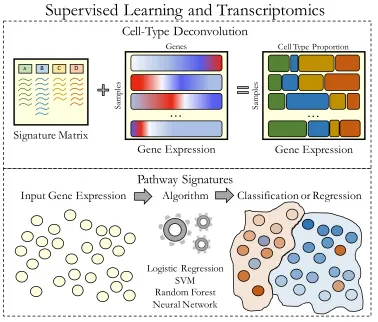
researchers to test specific hypotheses about cell type and pathway signatures (Figure
7
estimate cell type proportions in samples from bulk tissue expression. In a supervised
setting, deconvolution uses regression and borrows information from sets of predefined
marker genes or proportion estimates associated with specific cell types. One method,
CIBERSORT, requires an input signature matrix of immune cell marker genes that,
through support vector regression (SVR), deconvolves an input gene expression matrix
Signature Matrix
A B C D
Gene Expression
…
Sa m pl es Genes Gene Expression…
Sa m pl esCell Type Proportion
Supervised Learning and Transcriptomics
Cell-Type Deconvolution
Pathway Signatures
Classification or Regression Algorithm
Logistic Regression SVM Random Forest Neural Network
Input Gene Expression
Figure 1.2: Supervised machine learning to derive cell type and pathway signatures
8
from bulk tissue (26). Similar approaches use linear regression based on other
predefined cell type signature matrices to deconvolve immune cell types. This approach
has been applied to bulk cancer and systemic lupus erythematosus gene expression
data (27, 28). Other deconvolution algorithms implement least squares regression with
input proportion matrices predefined in various ways. For example, the matrices can be
defined by cell type–specific probes (29), by using purified reference samples (30), or
from a pathologist’s estimation (31). In a related study with different goals, an in-silico
dissection approach trained an SVM on bona fide cell type–specific genes to identify
other genes in a guilt-by-association analysis (32). Other cell type deconvolution
methods exist (reviewed in Reference 33), and many are based on unsupervised
learning to reveal underlying patterns (discussed in Section 1.3).
Another use case for supervised learning stratifies samples based on pathway
activity (Figure 1.2). A key step in this process is to assign accurate labels to samples
that exhibit pathway misregulation. Assigning the correct status to a sample is costly,
difficult, and often inaccurate. Therefore, this assignment is usually determined through
orthogonal means (e.g., pathway mutation status in cancer). Despite this challenge,
many studies have revealed interesting insights. For example, Guinney et al. (34) trained
an elastic net classifier on colon cancer transcriptomes to detect KRAS-mutated tumors resistant to EGFR (epidermal growth factor receptor) inhibition therapy. The model
generalized to unseen data sets, and misregulation was associated with survival and
response to MEK inhibition. In other words, the model identified a subspace that
separated wild-type KRAS samples from KRAS-mutant samples, which was validated in an external cell line data set. In Chapter 2, we discuss a similar approach applied to
detecting NF1 loss of function in glioblastoma patients. We found that this model
9
there was a relatively low number of positive examples, an ensemble logistic regression
model was implemented. An ensemble machine learning model trains several classifiers
on a single task and can help assess solution stability (36). In Chapter 3, we introduce a
machine learning Ras classifier based on logistic regression with an elastic net penalty.
We trained the model using data from The Cancer Genome Atlas (TCGA) PanCanAtlas
project (37). The model predicted Ras activation across a variety of cancer types,
including colon cancer, and generalized to alternative data sets and tissues. Additionally,
sensitivity to MEK inhibition was strongly correlated with classifier scores in wild-type
Ras cell lines. We also discuss a similar model applied to detecting TP53 inactivation in
Chapter 4 (38). This model revealed an inactivating silent mutation in the splice donor of
TP53 exon 4, which was corroborated by orthogonal exon–exon splice junction evidence (39).
Other supervised learning algorithms and custom modifications have been applied to
detecting pathway activity in transcriptomes. For example, custom SVM variants and
boosting methods have been applied to identify mechanisms that increase malignancy in
tumors (40). Including biological knowledge a priori in the classification task during
training can also aid in feature selection and pathway activity stratification (41).
Furthermore, one-class learning regression algorithms train models on gold standard
gene expression of specific tissues or pathways, and can generalize to other data sets
without knowledge of negative labels (42). This approach was recently applied to predict
oncogenic potential, or stemness, in TCGA PanCanAtlas tumors (43). A similar
approach, termed positive unlabeled learning, uses gold standard positively labeled
genes alone to implicate other disease-associated genes (44). Supervised learning has
also been applied to single-cell transcriptome data. For example, supervised learning
10
approach can also be used to predict cellular state and cell type (46). Generative
adversarial networks, which train two competing NNs (47), have been trained to simulate
single-cell gene expression profiles, which can identify rare cell populations (48, 49). In
conclusion, supervised learning can determine specific cell type and pathway activity
and can test hypotheses directly. However, sample labels are costly and often
inaccurate. It is also important to assess the performance of these models in alternative
data sets and to provide orthogonal biological evidence when making conclusions.
1.3. Unsupervised learning to discover hidden expression states
Unsupervised machine learning identifies underlying structures in data without the
need for sample labels (50). The goals of unsupervised learning include clustering
samples into similar groups and identifying hidden, or latent, variables present in
lower-dimensional subspaces. Applied to gene expression data, unsupervised learning has
been used to identify disease subtypes (11), deconvolve cell types (33), and extract
underlying gene expression modules present in various percentages in
lower-dimensional data representations (51). In the following subsection, we (a) broadly
introduce unsupervised learning methodology, (b) discuss the extraction of cell types
from expression data in an unsupervised manner, and (c) review a series of recent
publications that train dimensionality reduction, or compression, models on large
transcriptomic compendia to uncover hidden representations in data that reflect pathway
activity. In Chapter 5, we apply unsupervised learning approaches to determine the
concordance of high grade ovarian cancer subtypes (HGSC) across populations. In
Chapter 6, we train a variational autoencoder (VAE) on gene expression data and
perform latent space arithmetic to reveal underlying differences between these HGSC
11
1.3.1. A brief overview of unsupervised machine learning algorithms
In many unsupervised algorithms, the models learn through minimizing
reconstruction cost, in an n × p input data matrix X, where n and p are defined as above. The algorithms reconstruct the input matrix after passing the data through one or more
intermediate layers and projecting the matrix back onto input feature space. Most often,
the intermediate layers have fewer dimensions than the number of input features and
are considered bottleneck layers. Additionally, most algorithms use only a
single-bottleneck layer. Dimensionality-reduction algorithms such as PCA, independent
components analysis (ICA), NMF, and autoencoders are often evaluated by their ability
to reconstruct input data. Researchers can add various constraints on the reconstruction
loss to help increase feature sparsity or penalize the model to enforce specific feature
learning. In each compression algorithm, there are two distinct and valuable matrices
extracted that require interpretation. The matrices represent the learned components
scores across samples, as well as the relative contribution of each expression feature to
each component. In all cases, the researcher must select the bottleneck dimensionality
or rely on heuristics.
The application of unsupervised machine learning to growing transcriptomic
compendia has facilitated the rapid generation of biological hypotheses. Compression
algorithms receive input gene expression from thousands of samples and apply a
bottleneck layer to learn the most important sources of variation. These sources are
learned in different ways. For example, PCA learns sources of variation that are
orthogonal and that explain a decreasing amount of variation in the data. ICA solves a
signal processing problem of disentangling sources of independent signals, which are
not necessarily orthogonal. NMF, which has widely been used in the deconvolution
12
expression patterns (52). NMF is also popular for cell type deconvolution because cell
types exist in positive, linear proportions in bulk tissue. NN-based compression
algorithms, such as autoencoders and their many variations, also compress data into
lower dimensions (53, 54). These methods compress data with a nonlinear activation
and can therefore learn subtle, nonlinear patterns in gene expression data given enough
samples. Applied to transcriptomic compendia, compression algorithms have provided
insights into underlying pathway activity.
Other instances of unsupervised learning algorithms involve clustering, including
k-means clustering, Gaussian mixture models, hierarchical clustering, t-distributed
stochastic neighbor embedding (t-SNE), and many more (55). These models use
distance measures in various ways to group similar samples together for class
stratification and class discovery. There are many examples of unsupervised learning
applied to cluster gene expression data for subtype identification and gene module
detection. For example, Hoadley et al. grouped tens of thousands of tumor samples from
TCGA to highlight subtypes found independent of tissue of origin (56). We specifically
discuss an application of k-means clustering and non-negative matrix factorization to
various HGSC datasets in Chapter 5 (57). However, in this introductory section, we do
not focus on clustering applications and instead focus on compression algorithms
applied to uncover cell type and pathway signatures.
1.3.2. Unsupervised machine learning to uncover cell types
Unsupervised learning can be used as a powerful approach to extract cell type
signatures in transcriptomic compendia (Figure 1.3). Several unsupervised algorithms
have been used for cell type deconvolution, including self-organizing maps, hierarchical
clustering, and matrix decomposition methods like NMF and singular value
13
differentially expressed genes when no marker genes or reference data exist (59, 60).
The NMF core algorithm can be guided to identify cell types by restricting the component
matrix columns to sum to one (61). Additionally, a Markov chain Monte Carlo approach
has been proposed to estimate cell type proportions in an unsupervised fashion (62).
Nearest shrunken centroids, a technique that minimizes the number of genes required to
describe subtypes (63), was also used to deconvolve tumors into malignant,
nonmalignant, and stroma components (64). It is likely that other compression
algorithms, in addition to NMF, also capture cell type associations in their compressed
latent spaces. However, proper interpretation of learned gene expression components is
required to determine if the observed signatures are representative of cell type
expression.
One mechanism to obviate cell type deconvolution is to directly measure single-cell
expression profiles. There has been a recent explosion of unsupervised learning
algorithms, including NMF and autoencoders, applied to derive insights from single-cell
transcriptome data (65–74). The application goals are usually batch correction,
imputation, visualization, cell state identification, or identifying pathway activity
underlying homogeneous cell type populations. These differential patterns of pathway
activity can aid in cell state identification. For example, differential pathway activity in a
homogenous population of B cells in lupus patients was predictive of patient outcome
(75). Additionally, by applying methods to increase the distance between points in a
homogeneous cell type population of Schistosoma parasites, Tarashansky et al. identified subsets of cells that do not express specific marker genes previously thought
to be omnipresent (71). Therefore, unsupervised models can keep pace with expanding
14 Gene Expression
…
G en es SamplesUnsupervised Learning and Transcriptomics
Cell-Type Deconvolution (e.g. NMF)
Pathway Signatures
Signature Discovery Compression PCA ICA NMF Autoencoders Input Gene ExpressionG en es Cell-Type Signature Matrix
…
Proportion Matrix Ce ll-Typ e Samples…
High Dimensional Landscape Sample Pathway Activation
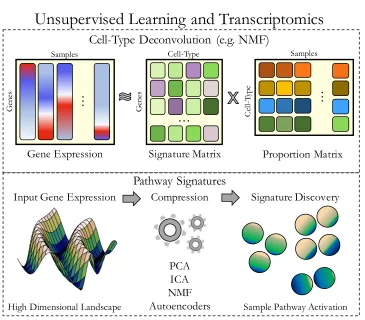
Figure 1.3: Unsupervised machine learning is used to discover cell type proportion and pathway signatures
(top) An illustrated example of unsupervised machine learning for cell type deconvolution. The input gene expression matrix is compressed into two component matrices, a signature matrix and a proportion matrix. The proportion matrix can be associated with cell type proportion in a given sample, and the signature matrix represents gene contributions to each signature. (bottom) Compression algorithms applied to a high-dimensional input matrix will automatically aggregate gene features into a lower-dimensional latent space. These latent spaces may represent pathway activities and other biological processes. Abbreviations: ICA, independent components analysis; NMF, non-negative matrix factorization; PCA, principal components analysis.
1.3.3. Unsupervised machine learning reveals underlying gene expression states
Compression algorithms applied to transcriptome data reveal pathway signatures
hidden in latent spaces that represent a lower-dimensional data manifold (Figure 1.3).
For example, PCA applied to a large compendium of nearly 80,000 transcriptomes
15
cancer (76). ICA has also been applied to transcriptome data to assign genes to gene
modules and to identify pathway signatures and other hidden transcriptional programs
(51, 77, 78); reviewed in Reference (79). In a direct comparison, ICA outperformed PCA
in identifying gene modules significantly related to pathway activity in breast cancer
samples (78). NMF is increasingly becoming the method of choice to derive pathway-
and cell type–specific signatures from transcriptomic compendia (80–82). NMF does not
constrain solutions to be orthogonal, and can therefore identify interconnected biological
processes. A similar constrained latent variable approach provides interpretable pathway
signatures and can identify pathway-specific activities while isolating technical artifacts
(83). This method, called PLIER (pathway-level information extractor), has also been
applied to large compendia to train a model that can provide insights into rare diseases
through transfer learning (84). Other similar methods use Bayesian optimizations of
matrix factorization to uncover patterns of biological processes hidden in transcriptome
data (82, 85).
NMF identifies nonorthogonal linear patterns in data, which can be helpful in many
tasks. Different techniques can use nonlinear activation functions to identify pathway
activity from transcriptomic compendia. For example, denoising autoencoders (DAEs)
trained on a large compendia of publicly available Pseudomonas transcriptomes were able to uncover biological pathways associated with the pathogen’s response to media
and oxygen exposure (86, 87). In this setting, the DAE was shallow, consisting of only
one hidden latent space layer with a nonlinear activation function. DAE and stacked
DAEs were also applied to yeast transcriptome data to reveal cell cycle expression
signatures (88). DAEs compress input data through noise corruption and then
reconstruct the original input through a nonlinear bottleneck layer (89). The corruption
16
applications have converted the autoencoder architecture into a generative model. A
generative model learns a specific latent code that can be sampled from to simulate new
data. VAEs are generative models (90, 91) and have gained popularity in transcriptome
applications for a variety of purposes, including improving visualization and extracting
hidden patterns underlying data (92). In Chapter 6, we discuss a VAE trained on TCGA
PanCanAtlas expression data. This model revealed biological patterns associated with
patient sex and various patterns of cell type and pathway activity, including immune cell
infiltration (93). VAEs have also identified patterns of response to drug treatment in a
panel of cell lines (94). However, it remains to be determined what other features are
being compressed from transcriptomic compendia and what other signals representing
known and potentially novel biology are being aggregated. In conclusion, unsupervised
machine learning applied to transcriptomic compendia can reveal underlying patterns of
cell type and pathway variation.
1.4. Interpreting machine learning models applied to transcriptomes
Machine learning models enable the accurate detection of cellular states and robust
predictions of pathway activity. In addition, interpreting supervised and unsupervised
models can reveal important biology. Model interpretation is crucial to the success of any
machine learning algorithm applied to transcriptome data. In Chapter 7, we discuss a
novel approach to interpret compressed gene expression features using network
projection.
1.4.1. Supervised learning models reveal differences between sample statuses
Supervised learning models assign weights, or importance scores, to each gene
expression feature given a classification or regression task. For example, an RF model
will determine important gene expression features to split classes. Many methods have
17
Ontology (GO) terms to predict gene expression changes. This technique has been
applied to determine important genes in the aging process and response to chemical
compounds in Caenorhabditis elegans (95, 96). Likewise, regression models and SVMs identify a subspace that represents specific activation patterns in the input feature
space. The magnitude of these features can be interpreted as the most important genes
for the classification task. Several methods penalize scores using recursive feature
elimination and use hinge loss penalties to reduce the number of explanatory genes
(97–99). A logistic regression model predicting Ras pathway activation identified similar
genes as a differential expression analysis comparing Ras wild-type to mutant tumors
(37). However, caution must be exercised when interpreting gene importance scores,
since the algorithms can rely heavily on initializations, and different solutions are likely to
implicate different genes (100). Models may select correlated genes and ignore causal
genes, which is detrimental to downstream interpretation. NN models are also
particularly difficult to interpret. The often black box models learn many layers of features
with increasing complexity, and it is important not to over interpret what the models are
learning. For instance, a sparse stacked autoencoder trained on yeast transcriptomes
revealed transcription factor machinery in intermediate layers, but hidden layers are
especially difficult to interpret (101).
1.4.2. Unsupervised learning models require interpretation of compressed features
Compression algorithms applied to transcriptome data output features with different
combinations of gene weights, or importance scores, that can be interpreted to represent
biological processes. There are many mechanisms by which ranked gene lists can be
interpreted, including overrepresentation pathway analysis and gene set enrichment
analysis (102). However, the interpretation of compressed features in gene expression
18
distribution of feature importance scores across different algorithms has different skews
and kurtosis values (Figure 1.4A). Therefore, it is not clear that interpreting compression
features is equivalent across algorithms. Furthermore, with the exception of the positive
values learned by NMF, all other algorithms learn positive and negative signatures. It is
not apparent if these values represent one general feature, two independent features, or
something else. It is also not clear if the compressed features are learning single
sources of variation, entangled sources of variation, or noise associated with technical
artifacts. Thus far, researchers have attempted to interpret compressed features from a
variety of algorithms in several ways (Figure 1.4B). For example, one can set a cutoff on
gene importance scores based on two or three standard deviations above or below the
mean (87, 103). Another strategy consists of sequentially removing top weighted genes
from positive and negative tails and performing Lilliefors test of normality until the
compressed feature resembles a normal distribution (77, 104). The removed genes
represent a ranked gene list of the feature-specific genes. Another strategy is to use
counterfactual analysis to observe which genes are strongly associated with covariates
and to weight their importance to the biological source (105). In Chapter 7, we introduce
a network projection approach that considers the full distribution of compressed gene
expression features. We build gene set networks from publically available gene set
compendia and determine enrichment of gene sets compared to permuted networks.
Another important question concerns how many compressed features exist. In other
words, how many sources of variation to be compressed are there that contain important
biology in a population? Researchers using a gene expression compendium of over
5,000 human tissues determined that only the first three principle components of a PCA
contained biologically relevant information (106). However, a follow-up study using the
19 Sa m pl es Genes Original Sa m ples Genes Reconstructed
…
Latent SpaceWeight Progressive Normal
14 32
Standard Deviation Full Distribution
Compressed Feature Interpretation
B.
PCA ICA NMF DA VAE
A.
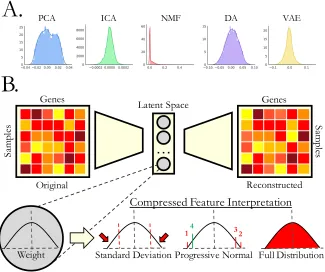
Figure 1.4: Interpretation of compressed gene expression features
(A) An example of a single random encoded feature of five different compression algorithms reveals the heterogeneity of the feature importance distribution. The input data are from The Cancer Genome Atlas PanCanAtlas gene expression data from 33 different tissue types spanning over 10,000 patients. (B) Defining genes that contribute to compressed features. These genes can be extracted in different ways. After the feature-associated genes are defined, there are various options for interpreting these compressed features, including various pathway- and network-based options. Abbreviations: DAE, denoising autoencoder; ICA, independent components analysis; NMF, non-negative matrix factorization; PCA, principal components analysis; VAE, variational autoencoder.
number of relevant compressed features was a sampling bias effect (107). Furthermore,
an application of ICA to over 9,000 microarray samples revealed 423 components
significantly associated with GO terms (51). A more recent analysis applying ICA to over
97,000 microarray samples revealed a total of 139 reproducible transcriptome modules
(108). An issue common to many compression algorithms is the requirement to set an
20
technical artifacts in regions without prior biological knowledge constraints (83). In fact, it
has been posited that gene expression consists of a series of compressed composite
measurements (109). Nevertheless, it is clear that compression algorithms extract
sources of variation in the underlying biology that are dependent on the strength of the
signal, the number of samples that contain the biology, the assumptions of the model
(e.g., linear versus nonlinear), and the predefined internal dimensionality. In Chapter 7,
we investigate the dimensionality of gene expression data by serially compressing input
matrices with an increasing bottleneck layer. More specifically, compress the data into 2
dimensions, 3 dimensions, 4 dimensions and so on up to 200. We project gene set
networks onto the compressed features to quickly determine enriched gene sets
captured in these features and determine how the bottleneck layer contributes to their
identification.
Lastly, the stability of unsupervised learning solutions is of utmost importance.
Because many unsupervised models are trained through an iterative process, the
solutions identified will be different depending on internal conditions. Therefore, it is
important to recognize stable patterns identified across various initializations. To this
end, a method called stability NMF evaluates solutions from multiple starting points and
determines stable basis vectors, or principle patterns, if they are consistently identified
and correlated (110). Ensemble models have been used to aggregate solutions into a
single model (87). Other methods have also been proposed to assess the stability of
solutions, including adding dropout to NN models at test time (111). Nevertheless,
interpreting machine learning models, investigating model stability, and associating
21
1.5. Conclusion
Machine learning applied to transcriptomic compendia reveals interesting
substructures in high-dimensional data that often represent cell type and pathway
signatures. Both supervised and unsupervised machine learning models have been
successfully applied to derive expression signatures with a variety of goals. As
transcriptomic compendia continue to grow in size and resolution, so will the need for
rapid insight generation and decision making abilities. In many models, there are no
restrictions on which signals the machine learning models use to learn, so they can
include artifacts and batch effects. Therefore, models must be applied to independent
data sets to confirm the learned target biology. In addition to testing alternative data,
orthogonal evidence supporting the discovered biology can help determine which signals
are accurately interpreted and repeatable, and then additional molecular experiments
can confirm the model’s ability to identify biological signals. We are also in an age where
computational experiments should be made reproducible (112). Therefore, software to
reproduce machine learning models should be provided with publications to enable other
researchers to quickly build upon work. Transcriptomic compendia contain vast amounts
of signal and value, and machine learning is one technology that can tap into this
resource.
1.6. Acknowledgements
The authors would like to acknowledge funding from The Gordon and Betty Moore
Foundation under GBMF 4552 and the National Institutes of Health’s National Human
Genome Research Institute under R01 HG010067 and the National Institutes of Health
22
Chapter 2.
A machine learning classifier trained on cancer transcriptomes detects NF1
inactivation signal in glioblastoma
This chapter was originally published as: Way, Gregory, P.*, Allaway, Robert, J.*,
Bouley, Stephanie, J., Fadul, Camilo, E., Sanchez, Yolanda, and Greene, Casey, S. “A machine learning classifier trained on cancer transcriptomes detects NF1 inactivation signal in glioblastoma.” BMC Genomics 18:127 (2017). doi: 10.1186/s12864-017-3519-7. *indicates co-first authors
Conceptualization: G.P.W., R.J.A., C.E.F., Y.S., C.S.G.; Methodology: G.P.W., R.J.A., C.S.G.; Software: G.P.W.; Investigation: G.P.W., R.J.A.; Writing – Original Draft: G.P.W., R.J.A., S.J.B., Y.S., C.S.G.; Writing – Review and Editing: G.P.W., R.J.A., S.J.B., C.E.F., Y.S., C.S.G.; Resources: C.E.F., Y.S., C.S.G.; Visualization: G.P.W., R.J.A.
Contributions:
In the paper Way, Allaway et al. 2017, I was a co-first author. Specifically, I trained and evaluated the machine learning approach to detect NF1 loss of function. The other co-first author, Allaway, performed the molecular validation experiments. Allaway also wrote methods sections 2.3.5, 2.3.6, 2.3.7, and 2.3.9 and produced the western blot in Figure 2.2. He also wrote and interpreted the gene and pathway analysis in section 2.4.3 and 2.5. I drafted all other sections and compiled all other figures. All authors provided comments on various revision versions and helped to design the study.
2.1. Abstract
2.1.1. Background
We have identified molecules that exhibit synthetic lethality in cells with loss of the
neurofibromin 1 (NF1) tumor suppressor gene. However, recognizing tumors that have inactivation of the NF1 tumor suppressor function is challenging because the loss may occur via mechanisms that do not involve mutation of the genomic locus. Degradation of
23
transcriptional landscape of a tumor and allow a machine learning classifier to detect
which tumors will benefit from synthetic lethal molecules.
2.1.2. Results
We developed a strategy to predict tumors with low NF1 activity and hence tumors
that may respond to treatments that target cells lacking NF1. Using RNAseq data from
The Cancer Genome Atlas (TCGA), we trained an ensemble of 500 logistic regression
classifiers that integrates mutation status with whole transcriptomes to predict NF1
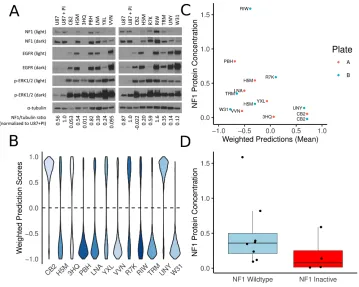
inactivation in glioblastoma (GBM). On TCGA data, the classifier detected NF1 mutated tumors (test set area under the receiver operating characteristic curve (AUROC) mean =
0.77, 95% quantile = 0.53 – 0.95) over 50 random initializations. On RNA-Seq data
transformed into the space of gene expression microarrays, this method produced a
classifier with similar performance (test set AUROC mean = 0.77, 95% quantile = 0.53 –
0.96). We applied our ensemble classifier trained on the transformed TCGA data to a
microarray validation set of 12 samples with matched RNA and NF1 protein-level
measurements. The classifier’s NF1 score was associated with NF1 protein
concentration in these samples.
2.1.3. Conclusions
We demonstrate that TCGA can be used to train accurate predictors of NF1
inactivation in GBM. The ensemble classifier performed well for samples with very high
or very low NF1 protein concentrations but had mixed performance in samples with
intermediate NF1 concentrations. Nevertheless, high-performing and validated
predictors have the potential to be paired with targeted therapies and personalized
24
2.2. Background
Genomic tools allow investigators to devise therapies targeting specific molecular
abnormalities in tumors. One such alteration is the loss of neurofibromin 1 (NF1), an
important tumor suppressor that regulates the activity of RAS GTPases (113, 114). Heterozygous mutation or deletion of NF1 causes neurofibromatosis type 1 (NF), one of the most frequently inherited genetic disorders (115). NF patients often develop
plexiform neurofibromas (PNs), benign nerve tumors for which the only therapy is
surgery. However, resection is often impossible due to the tumor’s intimate association
with peripheral and cranial nerves (116). PNs can transform to malignant peripheral
nerve sheath tumors (MPNSTs), which are chemo- and radiation-resistant sarcomas
with a dismal 20% 5-year survival (117). In addition, patients with NF are susceptible to
a broad spectrum of other tumors including low-grade/pilocytic astrocytomas,
pheochromocytomas, optic nerve gliomas, and juvenile myelomonocytic leukemias
(118). Many aggressive non-NF associated (sporadic) tumors have recently been shown
to harbor NF1 mutations, including glioblastoma (GBM), neuroblastoma, melanoma, thyroid, ovarian, breast, and lung cancers (119). Therefore, somatic and inherited loss of
NF1 function is emerging as a driver of tumors from different organ sites.
Several groups including our own have been working to develop therapeutic
approaches to target tumors with loss of NF1. Previously, our lab developed a high
throughput approach using yeast and mammalian screening platforms to identify tool
compounds and drug targets for cancer cells in which NF1 loss drives tumor formation.
Our pipeline identified small molecules that selectively kill or stop the growth of MPNST
cells carrying a mutation in NF1 or yeast lacking the NF1 homolog IRA2 (120). We also developed an assay in yeast to identify the targets of our lead tool compounds and found