University of Pennsylvania University of Pennsylvania
ScholarlyCommons
ScholarlyCommons
Publicly Accessible Penn Dissertations
2019
A Computational And Experimental Study Of Polymer
A Computational And Experimental Study Of Polymer
Conformation And Diffusion Under Confinement
Conformation And Diffusion Under Confinement
James F. Pressly
University of Pennsylvania, [email protected]
Follow this and additional works at: https://repository.upenn.edu/edissertations
Part of the Mechanics of Materials Commons
Recommended Citation Recommended Citation
Pressly, James F., "A Computational And Experimental Study Of Polymer Conformation And Diffusion Under Confinement" (2019). Publicly Accessible Penn Dissertations. 3534.
A Computational And Experimental Study Of Polymer Conformation And
A Computational And Experimental Study Of Polymer Conformation And
Diffusion Under Confinement
Diffusion Under Confinement
Abstract Abstract
Over the past several decades the use of polymers in applications such as microelectronics fabrication and nanocomposite materials has steadily increased. In these applications polymer chains are often confined to length scales comparable to their size. While it is well known that these confining
environments alter polymer properties, a generalized understanding of how different confining geometries alter polymer behavior has not been established. Here we investigate changes to polymer conformation and diffusion under cylindrical and planar confinement using a combination of computational and experimental techniques. Using molecular dynamics simulations of polymer melts, we systematically examine changes in the polymer radius of gyration, shape anisotropy, and entanglement network under geometric confinement for a range of polymer chain sizes and confinement lengths. We found that conformational changes in confined polymers follow similar trends in cylindrical and planar confinement, though changes are more pronounced in cylindrical confinement. Conversely, measurements of polymer diffusivity show distinctly different behavior in the two geometries, with diffusivity in planar confinement increasing continuously with increasing confinement while in cylindrical confinement polymer diffusion is nonmonotonic, initially increasing then decreasing. The results of these simulations are compared to experimental measurements of polymer diffusion in anodic aluminum oxide nanopores over a range of temperatures using elastic recoil detection (ERD). The ERD measurements indicate slower diffusion in confinement for all temperatures, with greater changes observed at higher temperatures. These results differ from the simulation measurements, most likely due to differences in the starting conditions of the systems (i.e., polymers starting inside the pore in simulations versus outside the pores in experiments). Finally, we used small angle neutron scattering (SANS) and dynamical theory analysis (DTA) to investigate polymer conformation under planar confinement using a unique confining template that enables
measurements of polymer conformation in confined and unconfined directions simultaneously. While the DTA model could reproduce the scattering from an empty channel template, the polymer scattering was too weak to isolate from the overall scattering pattern using the current template design. Single
component templates and contrast matched polymers are necessary to reduce the scattering contributions from the template and to better isolate polymer scattering.
Degree Type Degree Type
Dissertation
Degree Name Degree Name
Doctor of Philosophy (PhD)
Graduate Group Graduate Group
Materials Science & Engineering
First Advisor First Advisor
Karen I. Winey
Keywords Keywords
computational, confinement, experimental, polymer physics
Subject Categories Subject Categories
A COMPUTATIONAL AND EXPERIMENTAL STUDY OF
POLYMER CONFORMATION AND DIFFUSION UNDER CONFINEMENT
James F. Pressly
A DISSERTATION
in
Materials Science and Engineering
Presented to the Faculties of the University of Pennsylvania
in
Partial Fulfillment of the Requirements for the
Degree of Doctor of Philosophy
2019
Supervisor of Dissertation
Karen I. Winey
Professor, Materials Science and Engineering
Graduate Group Chairperson
I-Wei Chen
Professor, Materials Science and Engineering
Dissertation Committee
A COMPUTATIONAL AND EXPERIMENTAL STUDY OF POLYMER
CONFORMATION AND DIFFUSION UNDER CONFINEMENT
COPYRIGHT
2019
James F. Pressly
This work is licensed under the Creative Commons Attribution-NonCommercial-ShareAlike 3.0 License
To view a copy of this license, visit
ACKNOWLEDGMENT
There are many people I would like to acknowledge, without whom this work
would not have happened. First, my advisor, Karen Winey, who has helped me grow
tremendously as both a researcher and a person. She has always been supportive of
my work and interested in my success (despite assigning nigh impossible research
projects) and taught me the importance of never using yellow on a presentation
slide. She has been a wonderful mentor over the past five years and I am truly
grateful for the opportunity to work with her.
The advice and guidance of my thesis committee has also proven invaluable.
Robert Riggleman taught me the basics of computational modeling and always
took the time to meet with me when I needed assistance. Russell Composto was
always happy to discuss new ion beam data with me and answer questions about
the intricacies of ERD. Finally, Zahra Fakhraai, who’s insightful questions and
knowledge of thin film polymer dynamics helped me add context to my research.
I would also like to thank my external collaborators Rana Ashkar, Ronald
L. Jones, and J. Derek Demaree for their help with experiments, data analysis,
and insightful scientific discussion. And, of course, I am required to thank the
Department of Energy, Basic Energy Sciences for funding my research via grant
number DE-SC0016421.
Perhaps more important than my advisor and committee, are the members
Yang, Philip Griffin, Robert Middleton, Edward Trigg, Lu Yan, Eric Bailey, Tianren
Zhang, Benjamin Paren, Drew Wang, and Jinseok Park, as well as the multitudes of
undergrads we’ve had over the years who brighten up the office with their youthful
optimism. I have learned so much from each of them and they have made working
in a windowless office that much more bearable. In particular, I’d like to thank Rob
for giving me a crash course in polymer science before my qualifying exam, Phil
for mentoring and guiding me over my first few years, and Eric for always being
willing to discuss interesting research questions. I’d like to thank my other friends
in the MSE department, including Emmabeth Parrish, Boris Rasin, Natalie Gogotsi,
Nadia Krook, Kathryn Hasz, Stephanie Malek, Shawn Maguire, and Mike Boyle. I
would especially like to thank Nadia Krook for always taking classes and studying
with me and Kathryn Hasz for helping me understand Quantum Dynamics.
I would also like to thank the staff of the LRSM, who always keep things
running smoothly. I’d especially like to thank Doug Yates, for his tireless efforts
maintaining an aging ion beam (with only a few choice words), and Pat Overend,
for always being exceptionally helpful with every question I asked her. Additional
thanks to Jamie Ford, Steve Szewczyk, Irene Clements, Vicky Lee, and Abigail
Behrends.
I would also like to give a special shout-out to my laptop, which has tirelessly
stuck with me for nine years, throughout undergraduate and graduate school,
Of course, I would be remiss if I did not thank my wonderful and talented
girlfriend, Katie Rose. She has been a tremendous source of support, encouragement,
calmness, and happiness. Her personality is infectious and she can always make
me smile. This process would have been much more stressful without her presence
and I cannot wait to return the favor.
Finally, I would like to thank my family, without whom I would have never
made it this far. My parents, Bill and Nancy Pressly, have always supported and
encouraged me. They were the first to encourage my interest in engineering and
have been with me every step of the way. My siblings, Andrew, John, and Kathryn
have also supported me in their own unique ways, from my brothers’ lighthearted
cries of “Nerd!” when I get too sciency about something to my sister (somewhat
successfully) feigning interest as I explain the fundamentals of thermodynamic
phase diagrams. All of you have made this journey that much easier, and for that I
ABSTRACT
A COMPUTATIONAL AND EXPERIMENTAL STUDY OF
POLYMER CONFORMATION AND DIFFUSION UNDER CONFINEMENT
James F. Pressly
Karen I. Winey
Over the past several decades the use of polymers in applications such as
microelectronics fabrication and nanocomposite materials has steadily increased. In
these applications polymer chains are often confined to length scales comparable to
their size. While it is well known that these confining environments alter polymer
properties, a generalized understanding of how different confining geometries alter
polymer behavior has not been established. Here we investigate changes to polymer
conformation and diffusion under cylindrical and planar confinement using a
com-bination of computational and experimental techniques. Using molecular dynamics
simulations of polymer melts, we systematically examine changes in the polymer
radius of gyration, shape anisotropy, and entanglement network under geometric
confinement for a range of polymer chain sizes and confinement lengths. We found
that conformational changes in confined polymers follow similar trends in cylindrical
and planar confinement, though changes are more pronounced in cylindrical
behavior in the two geometries, with diffusivity in planar confinement increasing
continuously with increasing confinement while in cylindrical confinement polymer
diffusion is nonmonotonic, initially increasing then decreasing. The results of these
simulations are compared to experimental measurements of polymer diffusion in
anodic aluminum oxide nanopores over a range of temperatures using elastic recoil
detection (ERD). The ERD measurements indicate slower diffusion in confinement
for all temperatures, with greater changes observed at higher temperatures. These
results differ from the simulation measurements, most likely due to differences
in the starting conditions of the systems (i.e., polymers starting inside the pore
in simulations versus outside the pores in experiments). Finally, we used small
angle neutron scattering (SANS) and dynamical theory analysis (DTA) to investigate
polymer conformation under planar confinement using a unique confining template
that enables measurements of polymer conformation in confined and unconfined
directions simultaneously. While the DTA model could reproduce the scattering
from an empty channel template, the polymer scattering was too weak to isolate from
the overall scattering pattern using the current template design. Single component
templates and contrast matched polymers are necessary to reduce the scattering
Table of Contents
Acknowledgment iv
Abstract vii
Table of Contents ix
List of Tables xv
List of Figures xvi
Chapter 1 Introduction 1
1.1 Importance of Understanding Confined Polymer Behavior . . . 1
1.2 Types of Polymer Confinement . . . 2
1.3 Polymer Conformation . . . 6
1.4 Polymer Entanglement Networks . . . 9
1.5 Polymer Diffusion . . . 13
1.5.1 Diffusion in Bulk Polymer Melts . . . 13
1.7 References . . . 21
Chapter 2 Polymer Diffusion Is Fastest at Intermediate Levels of Cylindrical Confinement 36 2.1 Introduction . . . 36
2.2 Simulation Methods . . . 39
2.3 Results and Discussion . . . 42
2.3.1 Degree of Confinement and Chain Segregation . . . 42
2.3.2 Chain Conformation in Confinement . . . 45
2.3.3 Polymer Diffusion in Confinement . . . 48
2.3.4 Entanglement Network in Confinement . . . 51
2.3.5 Effect of Chain Segregation on Confined Diffusion . . . 55
2.4 Conclusions . . . 58
2.5 References . . . 60
Chapter 3 Increased Polymer Diffusivity in Thin Film Confinement 67 3.1 Introduction . . . 67
3.2 Simulation Methods . . . 70
3.3 Results and Discussion . . . 74
3.3.1 Chain Conformation in Planar Confinement . . . 74
3.3.2 Entanglement Networks in Confinement . . . 79
3.3.3 Chain Segregation . . . 81
3.3.5 Entropic Barriers to Polymer Diffusion . . . 86
3.4 Conclusions . . . 88
3.5 References . . . 91
Chapter 4 Slowed Diffusion of Polymers in Cylindrical Confinement as Measured Using Elastic Recoil Detection 99 4.1 Introduction . . . 99
4.2 Experimental Methods . . . 102
4.2.1 Materials . . . 102
4.2.2 Sample Preparation . . . 103
4.2.3 Tracer Diffusion Coefficients . . . 105
4.3 Results and Discussion . . . 108
4.3.1 High Energy Elastic Recoil Detection . . . 108
4.3.2 Polymer Diffusion in 40-nm AAO Pores . . . 109
4.3.3 Effects of Temperature on Confined Diffusion . . . 113
4.3.4 Polymer Diffusion in 20-nm AAO Pores . . . 116
4.4 Conclusions . . . 119
4.5 References . . . 121
5.2.1 Materials . . . 130
5.2.2 Sample Preparation . . . 133
5.2.3 SANS Measurements . . . 135
5.2.4 Data Reduction . . . 135
5.3 Results and Discussion . . . 137
5.3.1 Optimizing SANS Measurements of Channel Templates . . . . 137
5.3.2 Measuring Bulk Polymer Conformation . . . 141
5.3.3 Modeling Template Scattering Using Dynamical Theory Analysis . . . 142
5.3.4 Measuring Confined Polymer Conformation . . . 148
5.4 Conclusions . . . 151
5.5 References . . . 154
Chapter 6 Summary and Future Work 157 6.1 Summary . . . 158
6.2 Future Work . . . 165
6.2.1 Simulations of Confined Polymer Diffusion with Attractive Polymer-Wall Interactions . . . 165
6.2.2 Simulations of Confined Polymer Diffusion in Cylindrical Pores as a Function of Temperature . . . 166
6.2.4 ERD Measurements of Polymer Diffusion into Confining
Channels . . . 168
6.2.5 SANS of Polymer Confined to Homogeneous Channel Templates . . . 169
Appendix A Supporting Information for Chapter 2 170 A.1 Energy Barriers to Diffusion in Cylindrical Confinement . . . 170
A.2 No Evidence of Caging in Confined Diffusion . . . 171
A.3 Plots of dMSD/dt vs. t . . . 171
A.4 Cylindrical Confinement Simulation System Details . . . 173
Appendix B Supporting Information for Chapter 3 175 B.1 Plots of dMSD/dt vs. t . . . 175
B.2 Discussion of Z1 vs. CReTA Algorithms . . . 177
B.3 Self Monomer Density Comparison . . . 178
B.4 Thin Film Confinement Simulation System Details . . . 179
B.5 References . . . 181
Appendix C Phenyl-capping Procedure and Verification 182 C.1 Phenyl-capping Procedure . . . 182
C.2 Contact Angle Verification . . . 183
Appendix E Additional ERD Diffusion Profiles 187
E.1 100 kg mol−1dPS into 40-nm AAO Pores . . . 187
Appendix F Channel Template Fabrication Procedure 189 Appendix G SANS Contrast Matching of AAO Membranes 192 G.1 Introduction . . . 192
G.2 Methods . . . 193
G.2.1 Materials . . . 193
G.2.2 Sample Preparation . . . 193
G.2.3 SANS Measurements . . . 194
G.2.4 Data Reduction . . . 194
G.3 Results . . . 195
List of Tables
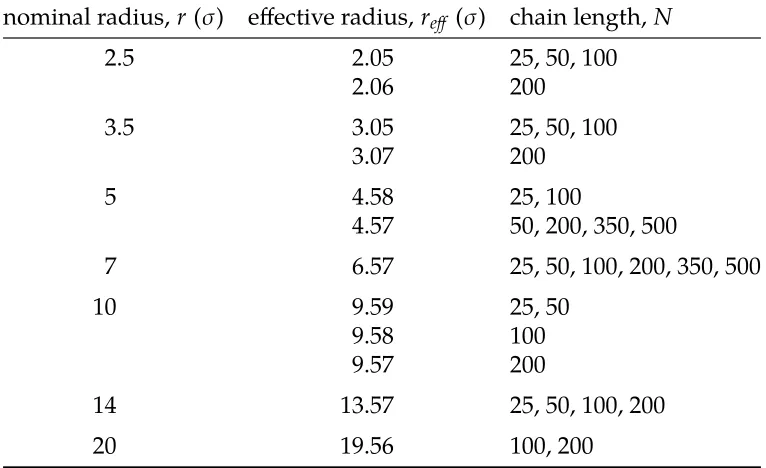
Table 2.1 Chain Lengths Studied for Each Nominal and Effective Pore Radius. 41
Table 3.1 Average Effective Film Thickness for Each Nominal Film Thickness. 72
Table 4.1 Matrix and Tracer Polymer Details. . . 103
Table 4.2 AAO Membrane Details. . . 103
Table 5.1 Polymer Molecular Weight, Polydispersity,Ree, andRg. . . 131
Table 5.2 Scattering Length Densities (SLDs) of Polymers, Blends, and
Tem-plate Components. . . 134
Table 5.3 Expected and MeasuredRgfor Several Polymer Blends. . . 142
Table A.1 Film Dimensions, Chain Lengths, and Number of Chains for Each
Simulation System. . . 173
Table B.1 Film Dimensions, Chain Lengths, and Number of Chains for Each
List of Figures
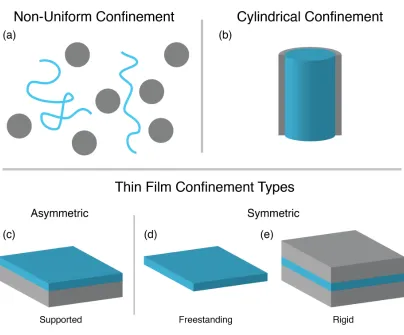
Figure 1.1 Schematic representations of several confinement types. (a)
Non-uniform confinement in a polymer nanocomposite. (b) Uniform
cylindrical confinement. (c) Uniform, asymmetric confinement in
a supported thin film. (d) Uniform, symmetric confinement in a
freestanding thin film and (e) between two rigid parallel plates. . 4
Figure 1.2 Schematic representation of (left) a polymer melt and (right) the
resulting primitive path network. . . 11
Figure 2.1 A representative image showing a confined polymer simulation
system (r 5,N 350). The pore wall (gray beads) is partially
cut away to expose the polymer. Each color represents a distinct
polymer chain. . . 39
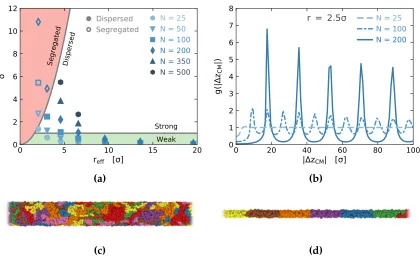
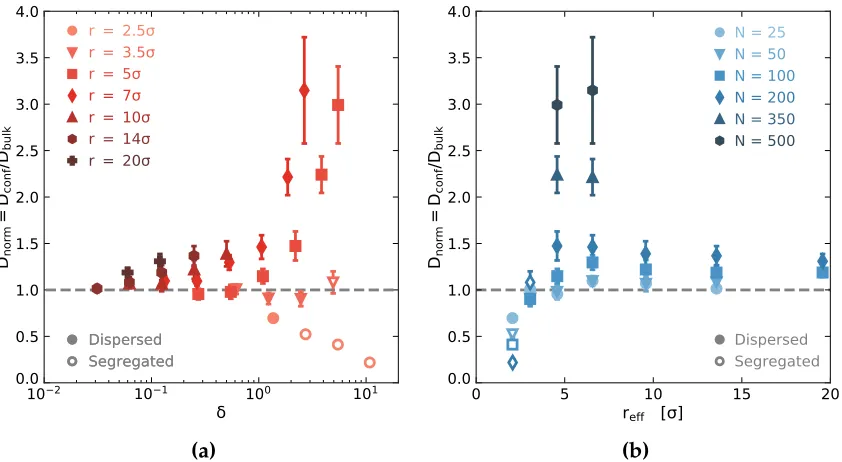
Figure 2.2 (a) The confinement parameter,δ N a2/πreff2, as a function of the
effective pore radius,reff. The colored domains indicate different
confinement regimes. The systems examined span both the weak
chains (filled markers) to segregated chains (open markers). (b)
Pair distribution functions between the polymer chain centers of
mass along the z-axis forN 25, 100, and 200 confined to a pore
ofr 2.5σandreff 2.05σ. The distribution is normalized such
that g(r) 1 indicates a random distribution of chain centers of
mass along the z-axis (i.e., dispersed chains). As the chain length
increases, the distribution of polymers becomes increasingly
correlated along the pore axis, indicating increased segregation
of polymers into individual domains. (c, d) Visualizations of
polymer chains in confinement for (c) a dispersed chain system
(N 200, r 7σ, δ 1.06) and (d) a segregated chain system
(N 200, r 2.5σ,δ 10.81). . . 44
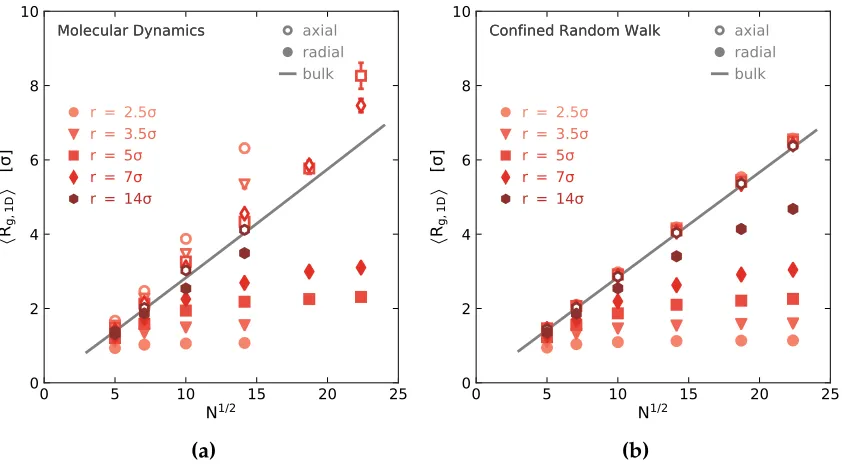
Figure 2.3 AverageRgvalues in the confined (radial, shown as filled markers)
and unconfined (axial, shown as open markers) dimensions,
calculated using (a) MD simulations and (b) random-walk model.
Note the difference in the unconfinedRg behavior between the
two methods. . . 46
Figure 2.4 Average relative shape anisotropy, hκ2i, of polymer chains for
both the MD simulations (closed markers) and the RW model
(open markers) plotted against the confinement parameter,δ
the simulation and model results to disagree forδ > 4. . . 47
Figure 2.5 Normalized diffusion coefficients plotted (a) as a function of
confinement, δ, and (b) as a function of effective pore size. Filled
and open markers indicate dispersed and segregated systems,
respectively. For reff 6.57 and 9.59σ the data points for N
25 and 50 overlap. . . 49
Figure 2.6 (a) Entanglement density as a function of distance from the wall
for chain lengthN 200 showing a reduction in the entanglement
density near the pore wall and a maximum at∼4σ. The dashed
line represents the bulk entanglement density. (b) Entanglement
density as a function of distance from the wall for pore radiusr
7σ. The entanglement depletion region widens with increasing
chain length. . . 53
Figure 2.7 (a) Entanglements per chain,Z, plotted as a function of effective
pore radius, reff. The solid lines represent fits to Equation 2.2,
wheretdis the fitting parameter, and the dashed lines represent
the number of entanglements per chain in the bulk. (b) Same
data as shown in (a), plotted in a linearized form where the data
collapses onto a line of slope −1, consistent with Equation 2.2.
(inset) The width of the entanglement depleted region, td, as a
Figure 2.8 (a) Entropy and (b) potential of mean force for two polymer chains
separated by a distancezin a pore of radius 2.5σ. Note the large
energetic and entropic barrier as the two chains come into contact
with one another. This barrier decreases as chain length decreases
and as pore radius increases. . . 57
Figure 3.1 Normalized polymer diffusion coefficient forN 200 beads as a
function of effective pore radius. The two representative images
of the cylindrically confined simulation systems correspond to
r 2.5σ(right, top) andr 7σ(right, bottom), both forN 200.
The segregation of the chains in ther 2.5σsystem creates large
entropic barriers to polymer motion that decrease the diffusion
coefficient. Figure adapted from previous work by Pressly et al. . 69
Figure 3.2 A representative image showing a confined polymer simulation
system (h7σ,N 200, L43.77σ). The confining wall (gray
beads) is partially cut away to expose the polymer. Different
colors represent different polymer chains. . . 71
Figure 3.3 AverageRgperpendicular (Rg,z, out-of-plane, filled markers) and
parallel (Rg,xy, in-plane, open markers) to the confining walls,
calculated using (a) MD simulations and (b) a confined
Figure 3.4 NormalizedRgperpendicular and parallel to the confining walls,
for planar (blue, filled) and cylindrical (green, open) confinement
as a function of the confinement parameterδfilm2Rg,bulk/heff for
planar confinement andδcyl Rg,bulk/reff for cylindrical
confine-ment. The change in Rg,⊥is the same in planar and cylindrical
confinement, while Rg,k increases more and at lower levels of
confinement for cylindrical confinement. Cylindrical confinement
data is taken from previous work by Pressly et al. . . 77
Figure 3.5 Average relative shape anisotropy, hκ2i, of polymer chains in
planar (blue, filled) and cylindrical (green, open) confinement for
(a) the MD simulations and (b) the RW model plotted against their
respective confinement parameters, δ 2Rg,bulk/heff for planar
andδcyl Rg,bulk/reff for cylindrical confinement. The dashed line
is hκ2i for bulk polymer chains and the dash-dotted line is for
a 2D random walk. Cylindrical confinement data is taken from
previous work by Pressly et al. . . 78
Figure 3.6 (a) Entanglements per chain, Z, in thin film (blue, filled) and
cylindrical (green, open) confinement, plotted as a function of
effective film thickness, heff, or twice the effective pore radius,
2reff, respectively. The solid lines represent fits to Equation 3.2, for
for cylindrical confinement, wheretdis the fitting parameter. The
dashed lines represent the number of entanglements per chain
in the bulk. (b) The width of the entanglement depleted region,
td, as a function of chain length,N, for thin film (blue, filled) and
cylindrical (green, open) confinement. In thin film confinement
td varies approximately asN0.2, while in cylindrical confinement
it varies approximately asN0.5. Cylindrical confinement data is
taken from previous work by Pressly et al. . . 80
Figure 3.7 (a) Self monomer density, ρself(rxy), profiles as a function of
radial, in-plane distance from the chain center of mass
normal-ized by Rg,bulk. Results shown forN 100 and 400 in bulk and
h 3.5 and 5σthin films. Self monomer density increases with
decreasing chain length and decreasing film thickness. (b)
Nor-malized self monomer density near the chain center of mass,
ρself(rxy 0)/ρself,bulk(rxy 0)as a function of confinement, δfilm.
The normalized self monomer density is bulklike for
approxi-mately δfilm < 1.7, vertical dashed line, and increases as δfilm0.75
for greater confinement. . . 82
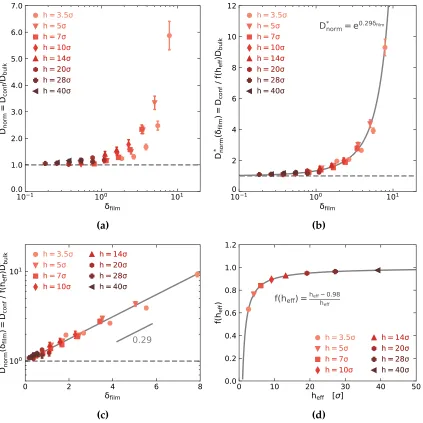
Figure 3.8 (a) Normalized diffusion coefficients,Dnorm, plotted as a function
of confinement, δfilm. (b, c) Dnorm∗ , plotted as a function of δfilm,
curve described by an exponential function. (d) The shift factor,
f, as a function ofheff. Fits to Equations 3.3 and 3.4 are shown in
b, c and d. . . 84
Figure 3.9 Entropic contribution to the potential of mean force for two
polymer chains separated by a distancerin (a) the bulk and (b)
a thin film of thickness 3.5σ. In the bulk −s(rCM) continually
decreases as chains get closer together while in the thin film the
initial decrease in−s(rxy,CM)is followed by a slight increase of
approximately 2kTforrxy,CM <10σforN 400. . . 88
Figure 4.1 SEM images of the (a) 20-nmand (b) 40-nmdiameter pores from
InRedox. . . 104
Figure 4.2 Representative ERD data and fitting showing the different
com-ponents of the fitting curve (instrumental resolution, unannealed
dPS profile, diffused dPS profile, and convoluted diffusion
pro-file). Data collected at the ion beam facility at the University of
Pennsylvania. . . 107
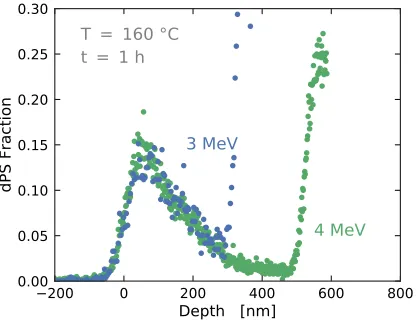
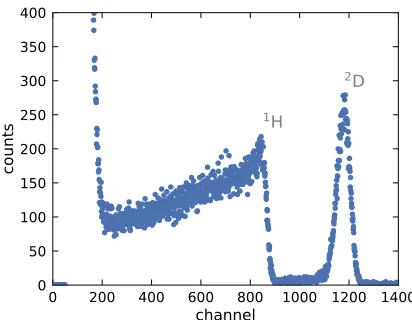
Figure 4.3 Deuterated PS diffusion profiles into 40-nm AAO pores measured
using ERD with incident beam energies of 3.022 MeV (blue) and
4.033 MeV (green). The sharp upturn in the data is the leading
edge of the 1H signal and is the limiting factor for the depth
the accessible depth. The diffusion profiles are nearly identical
over their accessible depth ranges. . . 109
Figure 4.4 Diffusion profiles of 100 kg mol−1 dPS into bulk PS (blue) and
40-nm AAO pores (green) for (a) 15 h at 140◦C and (b) 60 min at
160◦C. Polymer diffusion is slower in the 40-nm AAO pores than
in bulk PS. . . 110
Figure 4.5 Diffusion coefficients as a function of inverse temperature for
100 kg mol−1 dPS into bulk PS (blue) and 40-nm AAO pores
(green). The difference in diffusivity is greater at higher
tempera-tures. . . 114
Figure 4.6 The excess free energy barrier,∆FAAO, (Equation 4.2) plotted as a
function of temperature for 100 kg mol−1dPS diffusing into 40-nm
AAO pores. The lines represent fits of the free energy barrier
equation to the data at all temperatures (green, solid) and for
T 403–433 K (red, dashed). The slopes of the lines correspond to
the magnitude of the excess entropic free energy barrier, |∆SAAO|. 115
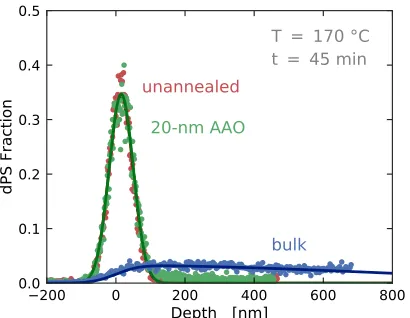
Figure 4.7 Diffusion profiles of 100 kg mol−1 dPS into bulk PS (blue) and
20-nm AAO pores (green). The dPS profile into 20-nm AAO pores
lies on top of the unannealed dPS profile (red). . . 117
Figure 4.8 The full, raw ERD profile for an unannealed 20-nm AAO pore
tracer film and the large, slightly sloping plateau on the left is the
1H signal from the PS matrix. The1H signal indicates that the
AAO pores have been infiltrated with PS. . . 118
Figure 5.1 Polymer Rg measured in the confined (open) and unconfined
(filled) directions from (a) experiments and (b) simulations.
Sim-ulations indicate an increase in unconfinedRg as film thickness
(d) decreases while experiments show conflicting results with
some studies reporting no change while others report an increase.
Only simulations have been able to measureRg in the confined
dimension. . . 128
Figure 5.2 Schematic image showing the process for fabricating the
chan-nel templates. Details on chanchan-nel fabrication can be found in
Appendix F. . . 132
Figure 5.3 Scanning electron microscope (SEM) images of the channel
tem-plates showing (a) top and (b) cross-sectional views. . . 132
Figure 5.4 Two-dimensional SANS pattern of an empty channel template
taken on the NGB 30 m SANS beamline at NIST at a detector
distance of 13 m. The periodic channels create a strong anisotropic
scattering pattern. The 2D pattern is reduced to 1D using 20°sector
averages in the direction of the strong scattering (perpendicular to
to the channel direction). . . 136
Figure 5.5 Reduced SANS data for single channel templates along the (a)
con-fined direction and (b) unconcon-fined direction. In both directions
the scattering patterns are similar for the empty and filled
tem-plates with the exception of the local minimum in the scattering
intensity nearqconf 0.015 Å
−1
for the empty template. . . 138
Figure 5.6 Reduced SANS data for a stack of three channel templates along
the (a) confined direction and (b) unconfined direction. Due
to slight template misalignments, the minimum near qconf
0.015 Å−1for the empty template is absent. Also, note the
differ-ence inqunconf for the 400 and 800 kg mol−1PS blends that is likely
due to a greater amount of polymer in the sample. . . 139
Figure 5.7 Reduced SANS data for bulk PS blends shown with fitted Debye
models (Equation 5.1). With the exception of the 800 kg mol−1PS
blend, Debye model agrees with the expectedRgbased onMW. 141
Figure 5.8 (a) Schematic representation of the channel template
demon-strating the different layers used in the DTA model calculations.
Transmission and reflection coefficients,T andR, are shown at
each layer boundary. (b) Schematic demonstrating how an
inci-dent neutron with orientational anglesθand φand wavelength
the channel template. . . 144
Figure 5.9 (a) Reduced SANS data (circles) and DTA fits (lines) for a single
empty template for detector distances of 4 and 13 m. The 4 m
data is shifted by 10−1. The simple 3 layer DTA model fits the
experimental data well with a few minor differences, likely due
to imperfections in the template. (b) Schematic of the channel
template showing the fitted dimensions used to calculate (a). . . . 147
Figure 5.10 Reduced SANS data and 3-layer DTA model for a single template
filled with a 400 kg mol−1 50/50 dPS/hPS blend. The SANS
pattern from the bulk 400 kg mol−1 blend is also shown. While
the 3-layer DTA model reasonably captures some features of the
experimental data at lowerq, there is a large difference between
the model and experiment at higherq. The difference between
the model and experimental scattering patterns (dark red circles)
does not look like the bulk polymer scattering (light red line). . . 149
Figure A.1 (a) Entropy and (b) potential of mean force for two polymer chains
separated by a distancezin a pore of radius 3.5σ. Note how the
energetic and entropic barriers are greatly reduced in the larger
3.5σradius pores compared to the 2.5σradius pores in Figure 2.8.170
Figure A.2 The mean squared displacement,hr2i, versus time curve for the
no evidence of caging. Additionally, the plot demonstrates how
hr2i profiles calculated using chain center of mass and using
individual monomers converge at long times, but the diffusive
regime is apparent earlier when using center of mass. . . 171
Figure A.3 Plots of(dhr2i/dt)/2 as a function of the Lennard-Jones (LJ) time.
hr2i was calculated using the centers of mass of the polymer
chains. A plateau in the profile indicates the diffusive regime has
been reached. The horizontal lines show the time window over
whichD was calculated. . . 172
Figure B.1 Plots of(dhr2i/dt)/4 as a function of the Lennard-Jones (LJ) time,
(dhr2i/dt)/6 for the bulk systems. hr2iwas calculated using the
centers of mass of the polymer chains. A plateau in the profile
indicates the diffusive regime has been reached. The horizontal
lines show average D and the time window over which it was
calculated. . . 176
Figure B.2 Entanglements per chain,Z, plotted as a function of effective film
thickness,heff, calculated using the CReTA (filled) and Z1 (open)
primitive path algorithms. Forh >7σthe two algorithms are in
excellent agreement, but the Z1 algorithm begins to diverge as
the film thickness further decreases. . . 177
in-plane distance from the chain center of mass, normalized by
Rg,bulk, for allNin bulk calculated using a 3D radial average (solid)
and a 2D slice radial average (dash-dotted). The 3D and 2D slice
averaging are in good agreement with each other, especially for
large N. While the slice method overpredictsρself for smallerN,
comparisons to other calculations of ρself using the slice method
are still valid. . . 178
Figure C.1 Contact angle of water on samples (a) after cleaning the
sur-face with a UV-ozone cleaner and (b) after phenyl-capping with
phenyltrimethoxysilane. The increased contact angle in (b)
indi-cates that the phenyl-capping procedure was successful. . . 183
Figure D.1 AFM images of the surfaces of the AAO membranes (a) when
empty, (b) with excess PS on the surface, and (c) after rinsing away
the excess PS. Each AFM image is 800 nm across. The height scale
is reduced to±5 nm for (b) to emphasize the surface flatness. . . . 184
Figure D.2 (a) An AFM image with lines representing 1D profiles taken
through the centers of the pores to analyze the difference in
height between local maxima and minima in the AFM images. (b)
The depth profile along a 1D slice for empty (green) and filled
and rinsed (blue) AAO membranes. There is a smaller height
the empty membranes. . . 185
Figure D.3 Histogram showing the distribution of measured pore depths for
empty (green) AAO membranes and filled and rinsed (blue) AAO
membranes. The measured pore depth in the filled and rinsed
AAO membranes is much less than in the empty membranes. . . 186
Figure E.1 ERD data and diffusion profiles for 100 kg mol−1dPS into bulk PS
and 40-nm AAO pores at several annealing times and temperatures.188
Figure F.1 A cross-sectional SEM image of the fabricated channel templates.
Courtesy of IBM Research – Almaden, June 2016. . . 191
Figure G.1 The square root of the total scattering intensity,
√
Itot, as a function
of D2O volume fraction,xD2O.
√
Itot 0 forxD2O 0.729,
indicat-ing a scatterindicat-ing length density of 4.507×10⁻⁴nm−2for the AAO
Chapter 1
Introduction
1.1
Importance of Understanding Confined Polymer Behavior
Understanding polymer behavior in confinement is critical to variety of
indus-tries and applications, ranging from semiconductor manufacturing1–8to polymer
nanocomposites.9–14As these industries continue to advance, the ability to predict
polymer properties in these confining environments becomes increasingly important
and enables shortened development cycles.
In semiconductor manufacturing, increased demand for micro and
nanofab-ricated devices as well as emerging technologies, such as flexible electronics, require
new fabrication methods. Nanoimprint lithography techniques, including
roll-to-roll nanoimprint lithography, are in a position to serve these needs well due to
their high throughput and ability to pattern small feature sizes.1–8In nanoimprint
lithography, an imprint mold of the pattern to be etched is fabricated and pressed
and the mold is removed, leaving behind the pattern to be etched.1,7 This process
requires polymer to fill features in the mold that can be on the order of 10 nm,
comparable to the size of a polymer chain.4,6,8 To better understand and improve
the nanoimprinting process, it is necessary understand how polymers polymer
properties change in these confining environments.
In polymer nanocomposites, confined regions are created between adjacent
nanoparticles. These confining regions can significantly affect polymer properties,
especially in highly loaded composites, significantly reducing polymer mobility and
altering the chain conformation.9–18Knowledge of how polymer behavior changes in
confinement is crucial for developing new nanocomposites for advanced applications.
Understanding confined polymer behavior has far reaching implications across a
variety of industries.
1.2
Types of Polymer Confinement
Polymers are generally considered to be in a confined state when the critical
dimension of their environment (i.e., the film thickness or interparticle spacing) is
on the order of the polymer size. Depending on the polymer sized and the property
being observed, it is possible to observe the effects of confinement on polymer
behavior for critical dimensions as large as 100 nm.19The strength of confinement,
δ, is typically defined as the ratio of the polymer size to the length of the critical
of gyration and h is the film thickness. Greater confinement can be achieved by
increasing the polymer size or decreasing the critical dimension.
The types of polymer confinement can be divided into several categories as
seen in Figure 1.1. The first distinction between confinement types is uniform versus
non-uniform confinement. Uniform confinement refers to a confining environment
where all polymer chains experience the same or similar level of confinement
(Fig-ures (1.1b–e)). This type of environment includes polymers confined to cylindrical
pores and thin films. On the other hand, non-uniform confinement describes
confining environments like those inside polymer nanocomposites, where the
curvature and dispersity of nanoparticles causes the degree of confinement can
vary considerably. Between two nanoparticles a polymer chain can be strongly
confined whereas polymer in a more matrix dense region of the composite
expe-riences weaker or no confinement effects (Figure 1.1a). Diamond-like networks
consisting of intersecting pores are another version of non-uniform confinement,
with the confining environment inside pores differing from the environment in
the junction.20In these environments the degree and orientation of confinement is
not well controlled making it difficult to measure changes in polymer properties
(especially anisotropic properties) as a function of confinement. Uniform confining
environments make these measurements easier and allow the development of
theories describing confined polymer behavior that can be applied to more complex
Figure 1.1. Schematic representations of several confinement types. (a) Non-uniform
confinement in a polymer nanocomposite. (b) Uniform cylindrical confinement. (c)
Uniform, asymmetric confinement in a supported thin film. (d) Uniform, symmetric
confinement in a freestanding thin film and (e) between two rigid parallel plates.
Uniform confinement can further be broken down by the number of confining
dimensions. Polymers can be confined in either one or two dimensions. Thin film,
or planar, confinement describes polymer confined in one dimension, with polymers
only allowed to move within the plane of the film (Figures (1.1c–e)). Cylindrical
Finally, polymer confinement can be classified by the type of confining
interface, rigid or free. With a rigid interface, polymers are confined by hard walls,
while with a free interface there is no hard wall and the interface is between polymer
and air (or vacuum). Rigid confinement is most often used in simulations. For thin
films, this interface classification can be broken down further based on the type of
confinement at each interface. If both interfaces are of the same type (either both
free, as in a freestanding film (Figure 1.1d), or both rigid, as when confined between
two parallel plates (Figure 1.1e)) the confinement can be considered symmetric. If
the interfaces differ from one another (as seen in supported thin films (Figure 1.1c),
with a rigid interface on the bottom and a free interface on top) the confinement can
be considered asymmetric.
Supported polymer films are used for the majority of experimental
measure-ments thin film properties due to their ease of fabrication and the ability to probe the
exposed polymer interface.21–28 However, due to the asymmetric confinement and
different polymer behavior at the distinct interfaces, it can be difficult to interpret
the data and isolate polymer behavior at each interface. Symmetrically confined
polymers reduce the analysis complexity but are typically either more difficult to
fabricate and handle (in the case of freestanding films) or more difficult to probe
due to the buried interfaces (in the case of rigid symmetric confinement).
An advantage to using rigid symmetric confinement is that the polymer
both interfaces are the same. In this thesis, we use uniform, symmetric, rigid
confinement to examine confined polymer properties in thin film and cylindrical
confinement.
1.3
Polymer Conformation
The theories and concepts necessary to understand and predict polymer
confor-mation in bulk polymer melts have been well established for decades. Based on
the theoretical work by Flory and Kuhn, polymers can be modeled as freely jointed
chains, consisting ofN Kuhn segments, and that the polymer conformation can be
described as a random walk of these segments.29,30Therefore, the polymer chain
size follows the equations
hR2eei b2N (1.1)
hR2gi b
2N
6 (1.2)
whereReeandRg are the polymer chain end-to-end distance and radius of gyration,
respectively, andb is the length of a Kuhn monomer.30Due to the isotropic nature
of bulk polymer melts, we know the components of Ree and Rg are, on average,
isotropic as well. These theories have been proven extensively, both experimentally,
and computationally.30
con-formation are not well-established. There are a few theoretical models describing
of how polymer conformation changes in confinement, primarily in thin film
ge-ometries, but these theories have only recently been examined experimentally or
computationally.30–33For example, Silberberg expanded Flory’s theory of polymer
chain conformation to polymers at interfaces, developing the theory of
conforma-tional transfer which treats the interface as a reflecting boundary for the chain
conformation.31 Under this theory, polymer conformations perpendicular to the
interface decrease relative to bulk while the conformation parallel to the interface
remains bulklike, making the average polymer conformations anisotropic. The
conformation parallel to the interface remains bulklike because the theory treats
polymer chains as an ideal random walk and omits polymer excluded volume.
Cavallo et al. later corrected the theories of Flory and Silberberg to account
for polymer excluded volume and demonstrated that the polymer conformation
parallel to the confining interface should increase in strongly confined systems.34
The principle of conformational transfer developed by Silberberg for polymers near
interfaces was later extended by Sussman et al. to model polymer conformation in
confined environments, including symmetrically-confined thin polymer films where
polymers interact with multiple confining interfaces and cylindrical confinement
where polymers interact with curved surfaces.33 For the extensions to Silberberg’s
theory by Sussman et al., polymer excluded volume was not considered and,
dimension, namely perpendicular to the interface. Simulations of flexible polymer
chains under thin film and cylindrical confinement have continually supported the
theories of Silberberg, Sussman et al., and Cavallo et al. regarding confined polymer
conformations.18,32–38
While computational studies have developed a consensus regarding confined
polymer conformations, experimental evidence for changes in polymer conformation
is conflicting. Several attempts have been made to experimentally measure polymer
conformations in thin films using neutron scattering techniques.39–43However, due
to geometric limitations, only the in-plane polymer conformation can be measured.
Simulations have shown that changes in the in-plane polymer conformation has
are weaker than the change in the out-of-plane dimension,33,34 which has likely
contributed to the conflicting results; some researchers report no change inRg40,43
while others observe an increase.39,41,42 Small angle neutron scattering (SANS) has
also been used to measure polymer conformation along the axes of cylindrical
nanopores, which shows no change inRg relative to bulk.44
The disagreement between computational and experimental measurements
of confined polymer conformation, and the lack of conclusive experimental evidence
itself, highlights the limitations of the current understanding of confined polymer
behavior. Polymer conformation and dynamics are intrinsically connected and the
absence of a solid understanding of confined polymer conformations impedes a
1.4
Polymer Entanglement Networks
The effect of confining environments on polymer entanglement networks is another
important aspect of confined polymer behavior that is necessary to understand
confined polymer dynamics. While many theoretical models exist to describe
polymer entanglement networks,30the Edwards tube model is generally the simplest
and most often used. In the Edwards tube model, neighboring chains apply
topological constraint to the polymer, restricting its motion to a tube-like region
around the primitive path of the polymer chain.30Monomers are confined to the
tube by a quadratic potential, the minimum of which defines the primitive path.30
The diameter of the confining tube,a, is roughly equal to the end-to-end distance of
an entanglement strand and is described by the equation
a ≈bNe1/2 (1.3)
whereNe is the number of monomers in an entanglement strand.
Experimentally, the tube diameter can be determined by using shear
rheome-try to measure the plateau modulus,Ge, of the polymer melt. The plateau modulus
provides the entanglement molecular weight,Me, from the equation:
Me
ρRT
Ge (1.4)
The tube diameter varies with polymer type and is typically on the order of several
nanometers (for polystyrene,a ≈8.5 nm).30Additionally, the number of
entangle-ments per chain,Z, can be calculated by dividing the polymer molecular weight
by the entanglement molecular weight (M/Me). The number of entanglements per
chain scales linearly with molecular weight.
In simulations, polymer conformations can be reduced to their primitive
paths to quantify their entanglement properties. The Z145 and CReTA46algorithms
are two popular methods for calculating primitive paths. The algorithms work
by fixing the polymer chain ends and shortening the chain contour length while
preventing chains from crossing through one another.45,46The result is a network of
entanglement nodes connected by straight segments (Figure 1.2). From the primitive
path network,Z can be determined using two different methods, S-kink or S-coil.
The S-kink method counts the number of kinks in a primitive path conformation
(each kink represents an entanglement), while the S-coil method calculates the
entanglement length,Ne, using the squared ratio betweenReeand the contour length
of the primitive path.47The S-kink and S-coil methods for calculatingZyield similar
results for well entangled polymers.45 In general, the Z1 and CReTA algorithms
provide quantitatively similar measurements of the entanglement network.33,48,49
However, more recent simulations of confined thin films have shown that the CReTA
algorithm gives more realistic results in very thin films.50
Figure 1.2. Schematic representation of (left) a polymer melt and (right) the resulting
primitive path network.
knowledge of entanglement networks in confinement is limited. Due to the difficult
nature of performing rheological measurements on thin polymer films, the majority
of this knowledge comes from simulations. Sussman et al. performed molecular
dynamics simulations of polymers under rigid cylindrical and planar confinement,
showing a decrease in the number of entanglements per chain as confinement
increases.33 Additional simulations by Sussman of freestanding polymer films
showed that entanglement density decreases near the interface while remaining bulk
like in the center of the film.51These findings are in agreement with entanglement
measurements of confined polymers in other simulations.52–54
Despite the difficulty, there are a few experimental studies that examine
the effects of confinement on polymer entanglement, either directly or indirectly.
One of the most direct experimental observations of entanglement behavior in
lengths in freestanding thin films using uniaxial tensile tests.55They examine the
thickness ratio between the shear deformation zone and the undeformed film and
use it to quantifyMeby relating it to the maximum extension ratio.55For polystyrene
molecular weights of 600–1100 kg mol−1confined to film thicknesses of 30–650 nm,
Si et al. found that Me nearly doubles in the thinnest films, compared to bulk,
corresponding to a significant decrease in entanglement density. In addition,Me
collapses to a single curve when plotted as a function of the ratio of Ree to film
thickness.
Many other experiments of polymer thin films have demonstrated decreased
polymer viscosity with increasing confinement.56–59Shin et al. also saw a decrease
in viscosity for cylindrically confined polystyrene.44 Viscosity is proportional to
the entanglement density,30 so a decrease in viscosity could be a result of chain
disentanglement, however, the glass transition temperature,Tg, has also been shown
to decrease with increasing confinement19,25,60,61 so it is possible the changes in
viscosity are related to changes in Tg. While the glass transition temperature in
confinement is significantly affected by the type of confining interface,60simulations
of polymers under freestanding and rigid confinement demonstrate similar changes
in entanglement density,33,50,51 potentially enabling one to decouple changes in
viscosity due to confinement andTg. Experimental observations of the effect of
confinement on entanglement networks is still a nascent field and one that could
1.5
Polymer Diffusion
1.5.1 Diffusion in Bulk Polymer Melts
Over the past few decades the polymer physics community has developed a strong
understanding of how polymers diffuse in a melt. In the late 1970’s de Gennes
developed the reptation model to describe the movement of entangled polymers
through a bulk polymer melt.62 In the reptation model, a polymer chain moves
through its confining tube by diffusing small loops along the primitive path, similar
to the motion of a snake.30The time it takes the chain to diffuse out of the original
confining tube is defined as the reptation time, τrep. By definition, the polymer
moves a distance on the order of its size during the reptation time, so we can define
the reptation diffusion coefficient,Drep, using the following equation:
Drep ≈
R2ee
τrep
≈ kT
ζ
Ne
N2 (1.5)
whereζis the monomeric friction coefficient andkT is the thermal energy.30 From
Equation 1.5 it is evident that the diffusion coefficient scales with the inverse square
of the molecular weight,D ∼N−2 ∼M−2
. The reptation model of polymer diffusion
was experimentally verified by the Kramer group at Cornell University using ion
beam analysis techniques.63–67
More recently, meta-analysis of the diffusion coefficients of entangled polymer
stronger molecular weight dependence than predicted with the reptation model.68
This analysis examined a wide variety of polymers (including polybutadiene (PB),
polystyrene (PS), polydimethylsiloxane (PDMS), and polyethyleneoxide (PEO))
with molecular weights ranging from approximately 3–500 times the entanglement
molecular weight.68The molecular weight dependence ofD is slightly greater in
real systems than predicted by the reptation model due to the effects of contour
length fluctuation (described by the Doi fluctuation model69) and constraint release
(also demonstrated experimentally by the Kramer group),67both of which consider
the transient nature of the topological constraints.30
In simulations, there are similarly conflicting results regarding the chain
length dependence of polymer diffusivity. Monte Carlo based simulations of polymer
diffusion using the Evans-Edwards model70 (which consists of polymer chains
diffusing along a regular lattice around impenetrable obstacles) have produced
diffusion coefficients that scale withN−2, in agreement with the simple reptation
model,70–72and withN−2.5, as predicted by the Doi fluctuation model.73–75Molecular
dynamics simulations of entangled polymer chains by Kremer and Grest, for chain
lengths ofN 5–400, observeD ∼ N−2.76,77More recent atomistic MD simulations
of polyethylene demonstrate a dependence ofN−2.4for entangled chains.78
1.5.2 Polymer Diffusion in Confinement
the debate as to howDscales in confinement is still ongoing. The majority of the
research into confined polymer dynamics, both in simulations and experiments,
is devoted to measuring segmental dynamics and understanding changes in the
glass transition temperature, most often in thin films.19,21–25,27,28,52,59–61,79–85In some
instances, measurements of segmental or Rouse motions are used to determine
diffusion coefficients using scaling laws developed for bulk polymer melts.86–94In
cylindrical pores, for example, nuclear magnetic resonance (NMR) diffusometry
and relaxometry measurements of polymer dynamics over time scales between
the Rouse relaxation and reptation times demonstrate slower relaxation of PEO in
methacrylate pores with increasing confinement, implying slower PEO diffusion.86,87
Inelastic neutron scattering measurements of the Rouse relaxations of polymers,
including PDMS and PEO, confined to AAO or silica pores also report evidence of
slowed88–90,93or unchanged91,92polymer dynamics.
The applicability of bulk polymer scaling laws (in which slowed Rouse
relaxations indicate slowed diffusion) to confined polymer diffusion is uncertain,
however, a few experimental studies measure polymer dynamics over larger time
and length scales, providing a better indication of polymer diffusivity in thin film
and cylindrical confinement. Fluorescence recovery after patterned photobleaching
(FRAPP) is a useful experimental method for measuring the in-plane diffusion of
polymer chains confined to a thin film. FRAPP measurements of silica supported
while measurements of silica supported poly(isobutyl methacrylate) (PiBMA) by
Geng et al. show no dependence ofD on film thickness.21,26Dynamic secondary
ion mass spectroscopy (SIMS) measurements of silica supported PS demonstrate
slowed diffusion of PS in thin film confinement in the out-of-plane dimension.23,24,95
In cylindrical confinement, Shin et al. measure capillary rise of PS into AAO pores
and observe decreased polymer viscosity, which they interpret to mean increased
polymer diffusivity, although this is complicated by the interfacial components.44
Proton pulsed-gradient stimulated-echo NMR measurements of PB in anodic
aluminum oxide (AAO) pores, measuring micrometer scale diffusion, demonstrate
that confined polymer diffusivity decreases in confinement, but only as a function
of pore size, not polymer molecular weight.94 Measurements of polymer diffusion
over hundreds of nanometers, performed by Tung et al. using elastic recoil detection
(ERD), show an increase in the polymer diffusion coefficient with increasing
confinement.18
While experiments measuring segmental dynamics in cylindrical confinement
suggest slowed86,87,95–97or unchanged91,92,94 polymer diffusion using scaling rules,
faster diffusion has been shown when measuring polymer dynamics over longer
time and length scales.18,44The disagreement between confined polymer diffusivity
calculated from polymer segmental relaxations and from chain scale motion suggest
bulk polymer scaling laws may not apply in confined systems.
dynamics is the interaction between the polymer and the confining wall. In general,
systems with attractive polymer-wall interactions demonstrate slower segmental
dynamics and slower polymer diffusion.88–90,93,98 PEO has a stronger attractive
interactions with AAO and silica than PS, and this may be an additional factor
as to why PEO diffusion in AAO pores is said to remain unchanged91,92while PS
diffusion has been shown to increase.44,99Developing experimental systems with
reduced polymer-wall interactions is critical to isolating the effects of confining
geometry on polymer diffusivity.
In simulations, it is trivial to ensure that there are no attractive interactions
between the polymer and the confining wall. Simulations of thin film confinement,
with no polymer-wall interaction, have shown polymer diffusivity to increase within
the plane of the film and decrease in the out-of-plane direction with increasing
confinement.36,80,100,101 Similar behavior is observed in simulations of entangled
polymers under cylindrical confinement; polymer diffusivity increases along the
pore axis.18 The contrast between the computational and experimental results
further implies that slowed diffusion in confinement could be due to attractive
polymer-wall interactions and highlights the need for further experiments with
1.6
Outline of Thesis Chapters
This thesis examines the effect of confinement on polymer diffusion and chain
conformation under cylindrical and planar confinement, with athermal
polymer-wall interactions, using computational and experimental techniques. These simple
confining geometries, and lack of polymer-wall attraction, allow us to develop
theories describing confined polymer behavior that can later be applied to more
complex confining systems.
Chapter 2 uses molecular dynamics (MD) simulations to examine polymer
conformation and diffusion under cylindrical confinement. Polymer chain lengths
of 25–500 beads are confined to cylindrical pores with radii ofr 2.5–20σ. Our
measurements of chain conformation show an increase inRg along the pore axis
and a decrease in the radial direction, in agreement with previous simulations.
We also observe a decrease in the entanglement density as the polymer chains
become more confined. Polymer diffusivity along the pore axis is shown to behave
nonmonotonically with decreasing pore size, increasing initially due to chain
disentanglement before decreasing due to entropically induced phase segregation.
In Chapter 3, we expand upon the simulations in Chapter 2 by using MD
simulations to examine polymers under planar confinement. These simulations use
polymers with chain lengths of 25–400 beads confined between parallel plates with
trends as in cylindrical confinement, though the magnitude of the changes is less.
Unlike in cylindrical confinement, polymer diffusivity increases continuously in
planar confinement, despite polymer chains tending toward segregation in the
strongest confinement.
In Chapter 4 we focus on experimental measurements of polymer diffusion
using elastic recoil detection (ERD). The diffusion of polystyrene into cylindrical
AAO pores is examined as a function of temperature and compared to the
cylin-drically confined polymer simulations in Chapter 2. In contrast to the cylindrical
confinement simulations, the ERD measurements indicate slower diffusion into the
AAO pores, relative to bulk polymer diffusion, with increased slowing occurring at
higher temperatures. This behavior is similar to polymer diffusion into polymer
nanocomposites.99 We use the D(T)measurements to calculate the entropic free
energy barrier for a polymer chain to diffuse in cylindrical confinement.
In Chapter 5 we use SANS and dynamical theory analysis (DTA) to measure
polymer conformation in thin film confinement. Polymer chains are confined to
approximately 350 nm deep and 40 nm wide channels in a silica-alumina template.
We find that the DTA model is able to accurately represent the scattering patterns
from the empty 1D periodic confining template, however, the polymer scattering
volume is determined to be too small and the intensity too weak to isolate the
confined polymer scattering pattern and measure Rg. We conclude that single
component templates with a uniform scattering length density are necessary for
Chapter 6 summarizes the conclusions of this thesis and discusses future
research directions. Appendices A and B provide supporting information for
Chapters 2 and 3, respectively. Appendix C describes the phenyl-capping procedure
performed on the confining templates. Appendix D demonstrates successful filling
and rinsing of excess polymer from the AAO membranes. Appendix E contains
additional diffusion profiles for dPS into bulk PS and 40-nm AAO pores. Appendix F
describes the channel template fabrication developed by IBM for the confining
templates used in Chapter 5. Finally, Appendix G presents the results of a contrast
matching experiment for determining the scattering length density of the AAO
1.7
References
(1) Chou, S. Y.; Krauss, P. R.; Renstrom, P. J. Nanoimprint Lithography.Journal
of Vacuum Science & Technology B: Microelectronics and Nanometer Structures
1996,14, 6.
(2) Chou, S. Y.; Krauss, P. R.; Zhang, W.; Guo, L.; Zhuang, L. Sub-10nm Imprint
Lithography and Applications. Journal of Vacuum Science & Technology B:
Microelectronics and Nanometer Structures1997,15, 9.
(3) Tan, H.; Gilbertson, A.; Chou, S. Y. Roller Nanoimprint Lithography.Journal
of Vacuum Science & Technology B: Microelectronics and Nanometer Structures
1998,16, 4.
(4) Li, M.; Wang, J.; Zhuang, L.; Chou, S. Y. Fabrication of Circular Optical
Struc-tures with a 20 Nm Minimum Feature Size Using Nanoimprint Lithography.
Applied Physics Letters2000,76, 673–675.
(5) Vratzov, B.; Fuchs, A.; Lemme, M.; Henschel, W.; Kurz, H. Large Scale
Ultraviolet-Based Nanoimprint Lithography. Journal of Vacuum Science &
Technology B: Microelectronics and Nanometer Structures2003,21, 2760.
(6) Austin, M. D.; Ge, H.; Wu, W.; Li, M.; Yu, Z.; Wasserman, D.; Lyon, S. A.; Chou,
S. Y. Fabrication of 5nm Linewidth and 14nm Pitch Features by Nanoimprint
(7) Kooy, N.; Mohamed, K.; Pin, L.; Guan, O. A Review of Roll-to-Roll
Nanoim-print Lithography.Nanoscale Research Letters2014,9, 320.
(8) Traub, M. C.; Longsine, W.; Truskett, V. N. Advances in Nanoimprint
Lithog-raphy.Annual Review of Chemical and Biomolecular Engineering2016,7, 583–
604.
(9) Mu, M.; Clarke, N.; Composto, R. J.; Winey, K. I. Polymer Diffusion Exhibits
a Minimum with Increasing Single-Walled Carbon Nanotube Concentration.
Macromolecules2009,42, 7091–7097.
(10) Mu, M.; Composto, R. J.; Clarke, N.; Winey, K. I. Minimum in Diffusion
Coef-ficient with Increasing MWCNT Concentration Requires Tracer Molecules
To Be Larger than Nanotubes.Macromolecules2009,42, 8365–8369.
(11) Gam, S.; Meth, J. S.; Zane, S. G.; Chi, C.; Wood, B. A.; Winey, K. I.; Clarke, N.;
Composto, R. J. Polymer Diffusion in a Polymer Nanocomposite: Effect of
Nanoparticle Size and Polydispersity.Soft Matter2012,8, 6512–6520.
(12) Choi, J.; Hore, M. J. A.; Meth, J. S.; Clarke, N.; Winey, K. I.; Composto, R. J.
Universal Scaling of Polymer Diffusion in Nanocomposites.ACS Macro Letters
2013,2, 485–490.
(13) Lin, C.-C.; Gam, S.; Meth, J. S.; Clarke, N.; Winey, K. I.; Composto, R. J. Do
Attractive Polymer–Nanoparticle Interactions Retard Polymer Diffusion in
(14) Choi, J.; Clarke, N.; Winey, K. I.; Composto, R. J. Fast Polymer Diffusion
through Nanocomposites with Anisotropic Particles.ACS Macro Letters2014,
3, 886–891.
(15) Tung, W.-S.; Bird, V.; Composto, R. J.; Clarke, N.; Winey, K. I. Polymer Chain
Conformations in CNT/PS Nanocomposites from Small Angle Neutron
Scattering.Macromolecules2013,46, 5345–5354.
(16) Tung, W.-S.; Clarke, N.; Composto, R. J.; Winey, K. I. Temperature Dependence
of Polymer Diffusion in MWCNT/PS Nanocomposites.Macromolecules2013,
46, 2317–2322.
(17) Tung, W.-S.; Composto, R. J.; Clarke, N.; Winey, K. I. Anisotropic Polymer
Conformations in Aligned SWCNT/PS Nanocomposites.ACS Macro Letters
2015,4, 916–920.
(18) Tung, W.-S.; Composto, R. J.; Riggleman, R. A.; Winey, K. I. Local Polymer
Dynamics and Diffusion in Cylindrical Nanoconfinement.Macromolecules
2015,48, 2324–2332.
(19) Roth, C. B.; Dutcher, J. R. Glass Transition and Chain Mobility in Thin Polymer
Films.Journal of Electroanalytical Chemistry2005,584, 13–22.
(20) Zhang, T.; Winey, K. I.; Riggleman, R. A. Polymer Conformations and
Dynamics under Confinement with Two Length Scales.Macromolecules2019,
(21) Frank, B.; Gast, A. P.; Russell, T. P.; Brown, H. R.; Hawker, C. Polymer Mobility
in Thin Films.Macromolecules1996,29, 6531–6534.
(22) Hall, D. B.; Torkelson, J. M. Small Molecule Probe Diffusion in Thin and
Ultrathin Supported Polymer Films.Macromolecules1998,31, 8817–8825.
(23) Zheng, X.; Rafailovich, M. H.; Sokolov, J.; Strzhemechny, Y.; Schwarz, S. A.;
Sauer, B. B.; Rubinstein, M. Long-Range Effects on Polymer Diffusion Induced
by a Bounding Interface.Physical Review Letters1997,79, 241–244.
(24) Pu, Y.; Rafailovich, M. H.; Sokolov, J.; Gersappe, D.; Peterson, T.; Wu, W.-L.;
Schwarz, S. A. Mobility of Polymer Chains Confined at a Free Surface.Physical
Review Letters2001,87, 206101.
(25) Tsui, O. K. C.; Zhang, H. F. Effects of Chain Ends and Chain Entanglement
on the Glass Transition Temperature of Polymer Thin Films.Macromolecules
2001,34, 9139–9142.
(26) Geng, K.; Katsumata, R.; Yu, X.; Ha, H.; Dulaney, A. R.; Ellison, C. J.; Tsui,
O. K. C. Conflicting Confinement Effects on the Tg, Diffusivity, and Effective
Viscosity of Polymer Films: A Case Study with Poly(Isobutyl Methacrylate)
on Silica and Possible Resolution.Macromolecules2017,50, 609–617.
(27) Hesami, M.; Steffen, W.; Butt, H.-J.; Floudas, G.; Koynov, K. Molecular
Probe Diffusion in Thin Polymer Films: Evidence for a Layer with Enhanced