Effect of different forms of farm dairy effluent, with and without
animal urine, on nitrification, denitrification and N2O emissions
A thesis
submitted in partial fulfilment
of the requirements for the Degree of
Master of Agricultural Science
at
Lincoln University
by
Siyu Chen
Lincoln University
Abstract of a thesis submitted in partial fulfilment of the
requirements for the Degree of Master of Agricultural Science.
Abstract
Effect of different forms of farm dairy effluent, with and without animal urine,
on nitrification, denitrification and N
2O emissions
by
Siyu Chen
Nitrous oxide (N2O) is one of the most important greenhouse gases. Agricultural soils are the largest
source of N2O emissions. In New Zealand, the application of farm dairy effluent (FDE) on pasture soils
is the third largest source of N2O emissions from grazed grassland. Recently, new FDE treatment
technologies have been developed to separate out solids from liquids to produce treated clear water
and treated effluent, aimed at recycling water, increasing the storage pond capacity and minimising
contamination of waterways. However, it is not known how the treated clear water and treated
effluent would affect the N2O emission factors compared with the standard untreated effluent, and
whether the treated effluent would interact with animal urine to result in different N2O emission
factors for the animal urine-N.
Thus, the objectives of this research were: a) to determine N2O emissions from treated effluents
(including treated effluent and treated clear water) compared with standard FDE applied to soil; b) to
determine N2O emissions from treated FDE and standard FDE co-applied with animal urine; c) to
determine ammonia oxidising bacteria (AOB), ammonia oxidising archaea (AOA), denitrying microbial
functional genes, and mineral N dynamics following the application of treated FDE and, standard FDE
with or without urine; and d) to determine the relationships between N2O emissions and the FDE
properties.
Two incubation experiments were conducted to measure N2O emissions, mineral Ndynamics, soil pH
and the abundance of AOB, AOA, and denitrifying functional genes (nirS, nirK and nosZ). A Templeton
silt loam soil was collected from Lincoln University Research Dairy Farm and packed into gas sampling
jars and soil sampling pottles. FDE and cow urine were collected from Lincoln University Demonstration
Dairy Farm and FDE was treated to produce treated clear water and treated effluent by the latest
urine, were applied to the soils, and were incubated at 12°C for 244 days for gas sampling jars and 210
days for soil sampling pottles.
Results showed that there were no significant differences among the treated clear water, treated
effluent or standard FDE in N2O emissions, mineral Ndynamics, soil pH and the abundance of AOB,
AOA, and denitrifying functional genes (nirS, nirK and nosZ). Similarly, when animal urine was
co-applied with the three different effluents, there were also no significant differences among the effluent
plus urine treatments in these parameters. Therefore, it is concluded that applying the treated effluent
or treated clear water produced from the new treatment technology will not increase N2O emissions
nor change the mineral Ndynamics, soil pH and the abundance of AOB, AOA, and the denitrifying
functional genes (nirS, nirK and nosZ), even on the urine patches of grazed pasture soils, compared
with applying the standard FDE. Future research could assess potential long-term effects on these
parameters and potential effects on other microbial communities in the soil.
Keywords: Nitrous oxide, farm dairy effluent, effluent treatment technology, treated clear water,
treated effluent, urine, ammonium, nitrate, soil pH, ammonia oxidising bacteria, ammonia oxidising
Acknowledgements
I wish to express my deepest gratitude to my supervisors Professor Hong Di and Professor Keith
Cameron, who have given me the opportunity to study at Lincoln University. I thank you for your
encouragement and guidance throughout the course of my study. You really gave me the inspiration
to do the study. I also would like to thank you for your patience and all your help during my study.
A big thank you to Dr. Barbara Brown for correcting my grammar and all your other assistance. To Carol
Barlow, Steve Moore, Jie Lei, Andriy Podolyan, Barry Anderson, Debora Poi, Emily Huang, Roger
Atkinson, Qian Liang and Trevor Hendry, I really appreciated your excellent technical support. I would
like to give a big thank you to Dave Saville for the wonderful statistical support.
To Amal Torky, thank you for your help with the administration during my study.
A big thank you to Anna Carlton, William Talbot and Andrea Leptin for the best time at Lincoln and for
all the help during my study. I hope to have the opportunity to work with you again in the future.
Thanks also go to Vicky Zhang, Qian Liang and Xueying Che for the greatest lunch times together.
Thanks a lot to my family. Thanks Mum and Dad for all the encouragement and support. You have
always provided strong backing to me. Thanks Grandma and Grandad for your understanding and
support. I can feel that you have always been there for me whenever I needed encouragement.
Finally, I would like to thank all the people who ever helped or encouraged me. Although for some of
Table of contents
Acknowledgements ... iv
Table of contents ... v
List of tables ... viii
List of figures ... ix
Chapter 1 Introduction ... 1
1.1 Introduction ...1
1.2 Aims and objectives ...2
1.3 Hypotheses ...3
1.4 Structure of the thesis ...3
Chapter 2 Literature review ... 4
2.1 Introduction ...4
2.2 Nitrogen cycle ...4
2.2.1 Gains ...5
2.2.2 Transformation ...5
2.2.3 Losses ...6
2.3 Nitrification and denitrification ...6
2.4 Factors affecting nitrification, denitrification and N2O emissions ...7
2.4.1 Soil moisture content ...7
2.4.2 Temperature ...9
2.4.3 Soil texture ... 10
2.4.4 Soil pH ... 11
2.4.5 Organic carbon ... 12
2.4.6 Synthetic N fertiliser applications ... 14
2.5 N2O emissions from farm dairy effluent (FDE) ... 16
2.6 Methods to reduce N2O emissions ... 20
2.7 Conclusions ... 21
Chapter 3 Materials and methods ... 22
3.1 Introduction ... 22
3.2 Experiment preparation and setup ... 22
3.2.1 Soil ... 22
3.2.2 Farm dairy effluent ... 22
3.2.4 Gas sampling jars ... 26
3.2.5 Soil sampling pottles ... 27
3.3 N2O gas sampling and analysis ... 27
3.4 Soil sampling and analysis ... 30
3.4.1 Soil moisture content ... 31
3.4.2 Soil mineral nitrogen ... 31
3.4.3 Soil pH ... 31
3.4.4 Functional gene abundance quantification ... 32
DNA extraction ...32
Real-time qPCR analysis ...33
Chapter 4 The effect of different forms of effluent, with and without animal urine, on nitrification, denitrification and N2O emissions ... 35
4.1 Introduction ... 35
4.2 Materials and methods ... 36
4.2.1 Experiment methods ... 36
4.2.2 Experiment design ... 36
4.2.3 Statistical analysis ... 36
4.3 Results ... 36
4.3.1 Soil moisture content ... 36
4.3.2 N2O emissions ... 37
Daily emissions ...37
Total emissions ...38
4.3.3 Soil ammonium ... 38
4.3.4 Soil nitrate ... 38
4.3.5 Soil pH ... 43
4.3.6 Functional gene abundance ... 43
AOB ...43
AOA ...43
nirS ...46
nirK ...46
nosZ I ...46
nosZ II ...46
4.4 Discussion... 52
4.4.1 N2O emissions ... 52
4.4.3 Soil pH ... 53
4.4.4 Functional gene abundance ... 53
4.5 Conclusions ... 54
Chapter 5 General conclusions and directions for future research ... 56
5.1 General conclusions ... 56
5.1.1 N2O emissions ... 56
5.1.2 Mineral nitrogen ... 57
5.1.3 Functional gene abundance ... 57
5.2 Future research ... 58
List of tables
Table 2.1 N2O emission factors resulting from land application of FDE. ... 17
Table 3.1 The properties of the soil used in this study. ... 25
Table 3.2 Original properties of the three different types of effluent used in this study. ... 25
Table 3.3 Description of the treatments. ... 25
Table 3.4 The volumes of effluents and/or cow urine applied to the incubation jars. ... 27
Table 3.5 The volumes of effluents and/or cow urine applied to the soil sampling pottles. ... 27
List of figures
Fig. 1.1 Regional distribution of dairy cows in 2015/16 (Dairy NZ, 2016). ... 1
Fig. 2.1 The soil/plant nitrogen cycle (Cameron et al., 2013). ... 5
Fig. 2.2 Nitrification and denitrification processes with associated enzymes and functional genes
(adapted from Di et al. (2014)). ... 7
Fig. 2.3 The processes of nitrification (Cameron et al., 2013). ... 7
Fig. 2.4 A generalized schematic indicating the relationship between water-filled pore space (WFPS)
of soils and relative fluxes of N2O and N2. N2O can be produced by both nitrification and
denitrification and N2 is produced by denitrification (Ussiri and Lal, 2013). ... 8
Fig. 2.5 Pattern of N2O production and percentage contribution of nitrification and denitrification
to total N2O emission after 5 days of incubation at different temperatures. Stacked bars
indicate percentage contribution of nitrification and denitrification to total N2O emission
(white, nitrification; grey, denitrification), and squares indicate rates of total N2O emission.
Mean ± SE; note that x-axis is not to scale (Avrahami et al., 2003). ... 10
Fig. 2.6 Effect of temperature and moisture on the net nitrification rate in three soil microhabitats.
Different capital letters indicate significant differences in net nitrification rate of the same
temperature among different soil moistures; different small letters denote significant
differences among different temperatures in the same soil moisture (P< 0.05). Error bars
represent the standard errors of the mean values for three replicates (Hu et al., 2014b). ... 11
Fig. 2.7 Relative nitrification rate (RNR) expressed as a fraction of the maximum rate, as a function
of pH in the short-term nitrification assay (Darrah et al., 1986). ... 13
Fig. 2.8 In situ cumulative losses of N (separately as N2O and N2) (A) relative N2O production
expressed as the N2O/(N2O+ N2) molar ratio (B) over the 74 h after the addition of
15N-labeled KNO3 to acidic, natural pH, and alkaline soils. Mean values and standard deviations
are shown (n=12). The different letters next to the bars indicate significant differences
between the specific pH treatments (P<0.05)(Čuhel et al., 2010). ... 14
Fig. 2.9 Relationship between denitrification loss and total organic carbon in 17 soils (left) and
relationship between denitrification loss and water soluble organic carbon in 17 soils
(Burford and Bremner, 1975). ... 14
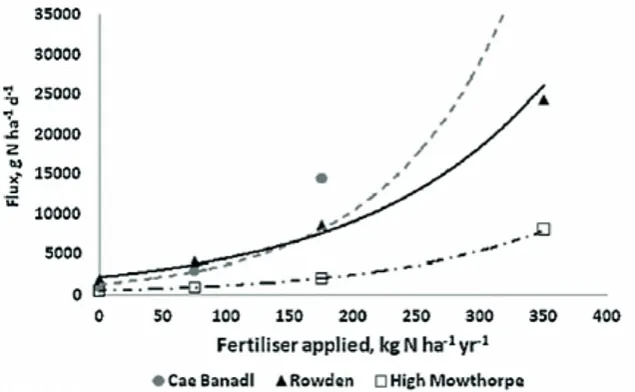
Fig. 2.10 N2O flux related to fertiliser-N applied in three study sites (Cardenas et al., 2010). ... 15
Fig. 2.11 Predicted annual N2O emissions with increasing N fertiliser application rates with two
different fertilisers; urea (closed diamond) and nitrate (open triangle) (Eckard et al., 2006).
... 16
Fig. 2.12 Relationship between nitrous oxide emission factors and effluent total N% (adapted from
Fig. 2.13 Relationship between nitrous oxide emission factors from effluent application (% of
applied N lost as N2O) and effluent C concentration (adapted from Li et al. (2015b)). ... 18
Fig. 2.14 Relationship between nitrous oxide emission factors from effluent application (% of applied N lost as N2O-N) and effluent dry matter content (adapted from Li et al. (2015b)). ... 19
Fig. 3.1 The collection of the Templeton silt loam soil from the Lincoln University Research Dairy Farm. ... 23
Fig. 3.2 Different types of effluent. From left to right is standard FDE, treated effluent and treated clear water, respectively. ... 24
Fig. 3.3 The collection of cow urine from the Lincoln University Demonstration Dairy Farm. ... 24
Fig. 3.4 Incubation jars inside the incubator for N2O sampling. ... 26
Fig. 3.5 The soil sampling pottles inside the incubator. ... 28
Fig. 3.6 An example of N2O gas sampling. Top left: the gas sampling lids used. Bottom left: A syringe was used to mix the gas and then inject 10 mL into an evacuated vial. Middle: the preparation just before gas sampling. Right: gas sampling lids in place. ... 28
Fig. 3.7 Taking soil subsamples. ... 30
Fig. 3.8 KCl extraction. Left. soil subsamples shaken with 25 mL KCl; right. filtering. ... 32
Fig. 3.9 Soil pH measurement. ... 32
Fig. 4.1 Soil moisture content over the experiment period. The error bars represent the standard error of the mean (n=4). ... 37
Fig. 4.2 Daily N2O-N emissions. (a): Effluent treatments; (b): Effluents plus urine treatments. The error bars represent the standard error of the mean (n=4). ... 39
Fig. 4.3 Total N2O-N emissions over the experiment period. (a): Effluent treatments; (b): Effluents plus urine treatments. The error bars represent the standard error of the mean (n=4). The treatments with different lower-case letters are significantly different at P<0.05. Note the difference in the y-axis scale between the Figure a and b. ... 40
Fig. 4.4 Soil ammonium-N concentration. (a): Effluent treatments; (b): Effluents plus urine treatments. The error bars represent the standard error of the mean (n=4). Note the difference in the y-axis scale between a and b. ... 41
Fig. 4.5 The nitrate-N concentration. (a): Effluent treatments; (b): Effluents plus urine treatments. The error bars represent the standard error of the mean (n=4). ... 42
Fig. 4.6 The soil pH. (a): Effluent treatments; (b): Effluents plus urine treatments. The error bars represent the standard error of the mean (n=4). ... 44
Fig. 4.7 AOB amoA gene abundance in the soil. (a): Effluent treatments; (b): Effluents plus urine treatments. The error bars represent the standard error of the mean (n=4). ... 45
Fig. 4.9 nirS gene abundance in the soil. (a): Effluent treatments; (b): Effluents plus urine
treatments. The error bars represent the standard error of the mean (n=4). ... 48
Fig. 4.10 nirK gene abundance in the soil. (a): Effluent treatments; (b): Effluents plus urine
treatments. The error bars represent the standard error of the mean (n=4). ... 49
Fig. 4.11 nosZ I gene abundance in the soil. (a): Effluent treatments; (b): Effluents plus urine
treatments. The error bars represent the standard error of the mean (n=4). ... 50
Fig. 4.12 nosZ II gene abundance in the soil. (a): Effluent treatments; (b): Effluents plus urine
Chapter 1
Introduction
1.1
Introduction
In New Zealand, dairy farming has been expanding rapidly. In 1982, the population of dairy cattle was
roughly 3 million and the numbers have increased to nearly 5 million in 2015/16 (Dairy NZ, 2016).
About 60% of dairy cows are located in the North Island and 40% in the South Island (Fig. 1.1).
Fig. 1.1 Regional distribution of dairy cows in 2015/16 (Dairy NZ, 2016).
Globally, it has been identified that the livestock sector is one of the major contributors to the
contamination of water and global warming (Di and Cameron, 2016). Greenhouse gases (GHG’s)
provide radiative forcing in the atmosphere, which can cause the climate to warm (IPCC, 2007). Nitrous
oxide (N2O) is one of the most important anthropogenic greenhouse gases, which has a global warming
potential 298 times that of carbon dioxide (CO2) and N2O is the largest contributor to stratospheric
denitrification. Agriculture is the largest source of N2O emissions, comprising 66% of total N2O
emissions (Davidson and Kanter, 2014; van der Weerden et al., 2016a). One of the significant factors
is the increasing application rate of synthetic N fertilisers, which has increased the N2O concentration
in the atmosphere in recent decades (Davidson, 2009; van der Weerden et al., 2016b). Globally,
fertiliser use is expected to double between 2006 and 2050 (Sutton and Bleeker, 2013; van der
Weerden et al., 2016a). In New Zealand, pasture grazing generally occurs all year round owing to the
mild winter climate (Luo et al., 2013). The intensification in livestock farming has led to a growing
volume of manure and animal excreta (including urine and farm dairy effluent) being produced, which
also contribute to the rising atmospheric N2O concentration.
In New Zealand, the N2O produced from agriculture is high and represented 94.8% of total N2O
emissions in 2015 (Ministry for the Environment, 2017). N2O emissions from urine and dung excreted
by the grazing animal accounted for 63% of the agricultural N2O and synthetic N fertiliser accounted
for 16.1% of the agricultural N2O emissions in New Zealand in 2015 (Ministry for the Environment,
2017). Dairy cattle excreta is deposited in and around the milking shed and washed and collected into
a pond or sump (Chung et al., 2013). This is known as farm dairy effluent (FDE), which is the most
common form of manure collected and applied to pastoral soils in New Zealand (van der Weerden et
al., 2016a). In New Zealand, the application of FDE on pasture is the third largest source of N2O
emissions.
Recently, some new FDE treatment technologies have been developed to separate solids out from the
liquids and produce treated clear water for re-use and treated effluent (the more concentrated
effluent with higher amounts of solids) (Cameron and Di Pers. Comm.). However, it is not known how
the new treated effluent and treated clear water produced from this treatment technology would
affect N2O emissions compared with the original standard non-treated FDE, and whether the treated
FDE would interact with animal urine to result in different N2O emission factors. This research is aimed
at bridging these knowledge gaps.
1.2
Aims and objectives
The aim of this study is to improve knowledge and fundamental understanding of the effect of different
forms of FDE (including standard FDE, treated clear water and treated effluent), with and without
animal urine, on N2O emissions, mineral nitrogen dynamics, soil pH and the abundance of ammonia
oxidising bacteria (AOB), ammonia oxidising archaea (AOA), and denitrifying functional genes (nirS,
The objectives of this project were:
a) To determine N2O emissions from treated effluents (including treated effluent and treated clear
water) compared with standard FDE applied to soil;
b) To determine N2O emissions from treated FDE and standard FDE co-applied with animal urine;
c) To determine ammonia oxidising bacteria (AOB), ammonia oxidising archaea (AOA), denitrying
microbial functional genes, and mineral nitrification rate dynamics following the application of
treated FDE and standard FDE, with or without urine;
d) To determine the relationships between N2O emissions and the FDE properties.
These objectives will be achieved by conducting laboratory incubation studies.
1.3
Hypotheses
This research programme tested the following hypotheses:
a) That the treated effluent and treated clear water would have different N2O emission factors
compared with the untreated standard FDE when applied to soil;
b) That there would be different interactive effects between the treated effluents (treated clear
water and treated effluent) and standard FDE and animal urine when they are co-applied to soil.
1.4
Structure of the thesis
Chapter Two of this thesis is the review of previously published literature relevant to the factors
affecting N2O emissions from nitrification and denitrification. Chapter Three describes the
experimental design and methods of sampling and analysis in this research. The research results and
discussion are presented in Chapter Four. Chapter Five summarizes the conclusions of this research
Chapter 2
Literature review
2.1
Introduction
Nitrous oxide (N2O) is an important greenhouse gas (GHG), which is almost 300 times greater than
carbon dioxide (CO2) in terms of long-term global warming potential (IPCC, 2007).It is also the largest
contributor to the depletion of stratospheric ozone (Ravishankara et al., 2009). Mostly, the N2O is
produced from biological processes, nitrification and denitrification, as a part of the nitrogen (N) cycle
in soil (Thomson et al., 2012).
The dominant land use in New Zealand is pastoral agriculture (Di and Cameron, 2017). In grazed
grassland soils, the N associated with animal excreta (both urine and dung) is an important part of the
Ncycle (Saggar et al., 2013). On average, 290 g N cow-1 day-1 can be returned as excreta by dairy cattle
in the New Zealand grazing system (Saggar et al., 2004b). In New Zealand, N2O emissions from urine
and dung excreted by the grazing animal accounted for 63% of the agricultural N2O and synthetic N
fertiliser accounted for 16.1% of the agricultural N2O emissions in 2015 (Ministry for the Environment,
2017). Farm dairy effluent (FDE) is the most common form of manure that is collected and applied to
the pastoral soils, and is the third largest source of N2O emissions in New Zealand (van der Weerden
et al., 2016a).
In New Zealand, a series of mitigation options are being considered to decrease N2O emissions from
grazed farming systems including restricted grazing, using winter feed pads and low N animal feed (Di
and Cameron, 2002a, 2002b; Kramer et al., 2006; Monaghan et al., 2007; Di and Cameron, 2012). In
addition, the nitrification inhibitor, dicyandiamide (DCD), has been shown to decrease both NO3
-leaching and N2O emissions in grazed pasture soils (Di and Cameron, 2007, 2012). However, the use of
DCD has been suspended in New Zealand awaiting the establishment of a food standard by the FAO’s
Codex Committee.
Nitrous oxide emissions are part of the N cycle in the soil, and are affected by a number of soil,
environmental and management factors. This review will first provide a brief summary of the N cycle
in the soil, followed by a review of the factors that affect N2O emissions, and microbial communities
responsible for the production of N2O.
2.2
The nitrogen cycle
There are 18×1015 tonnes of N in the earth’s crust and 3.8×10¹⁵ tonnes as nitrogen gas (N
2) in the
matter, humus, plant material and animal material; (b) N in soil organisms; (c) ammonium ions, which
are held by organic matter and clay minerals and, (d) mineral-N forms in soil solution, such as nitrate
(NO3-), ammonium (NH4+), and nitrite (NO2-) in low concentration. The N cycle in the plant/soil system
includes three processes: gains, transformations and losses (Fig. 2.1). These processes affect N
availability for plants and N transformations in the wider environment.
Fig. 2.1 The soil/plant nitrogen cycle (Cameron et al., 2013).
2.2.1
Gains
There are four main pathways for soil to gain N: (a) atmospheric returns from atmosphere N and
juvenile addition; (b) N fertilisers; (c) biological N fixation which is carried out by specific bacteria, such
as Rhizobia and free-living N2 fixing soil bacteria and (d) animal manure (Fig. 2.1).
2.2.2
Transformation
In the soil, N can be transformed into different forms through many chemical and biochemical
reactions. Soil organic matter, including animal manure, microorganisms and dead plants and animals,
is transformed into ammonium ions (NH4+) by mineralisation. Through nitrification, NH4+ is
transformed into nitrite (NO2-) and nitrate (NO3-) by specific nitrifying bacteria. Ammonium and nitrate
can also be transformed into organic forms through the process of immobilisation by soil
2.2.3
Losses
Nitrogen can be lost from soil through leaching or through gaseous emissions in the forms of N2, N2O
and NO by denitrification, or in the form of ammonia by volatilization. Nitrogen is also lost from the N
cycle through removal in plant and animal products (Fig. 2.1).
2.3
Nitrification and denitrification
In the soil/plant N cycle system, nitrification and denitrification are two important processes that
produce N2O. Through nitrification, NH4+ is converted to NO2- and then to NO3- by nitrifying microbes
under aerobic conditions (Fig. 2.2) (Di et al., 2014). N2O is a by-product that can be produced during
nitrification. In the process of NH4+ oxidation, there are two stages, the conversion of NH4+ to NH2OH
(Equation 2.1) by amoA ammonia monooxygenase and from NH2OH to NO2- by hydroxylamine
oxidoreductase (Equation 2.2) (Bothe et al., 2000).
NH3 + O2 + 2H+ + 2e-→NH2OH + H2O (2.1)
NH2OH + H2O→NO2- + 5H++ 4e- (2.2)
The transformed NO2- is rapidly oxidised to NO3-. N2O is produced chemically because of the
decomposition of NH2OH during the oxidation of NH4+ (Braker and Conrad, 2011).
For over a century, ammonia oxidising bacteria (AOB) was thought to mostly perform in the first and
rate-limiting step of nitrification, the oxidation of NH3 to NH2OH (Kowalchuk and Stephen, 2001; Di and
Cameron, 2017). However, it was found recently that the populations of ammonia oxidising archaea
(AOA) in a range of soils were more abundant than AOB (He et al., 2007; Prosser and Nicol, 2008; Di
and Cameron, 2017). This suggested that AOA could potentially have a greater role than AOB in
ammonia oxidation. However, further research has found that the activity and population abundance
of AOB and AOA in ammonia oxidation can vary depending on soil and environmental conditions (Di
and Cameron, 2017). This will be discussed in Section 2.4.
Denitrification is the reduction of NO3- or NO2- to NO, N2O and N2 gases under anaerobic conditions
(Fig. 2.2). Under anaerobic conditions, heterotrophic denitrifiers use NO3- or NO2- to replace O2 as the
electron acceptor for the oxidation (van Spanning et al., 2007) and release N2O and N2 and gain energy.
Nitrate can be reduced to NO2- by nitrate reductase (encoded by the narG gene). The nitrite reductase
(encoded by nirS and nirK genes) reduces NO2- to NO. N2O and N2 are produced because of the
reduction of NO by nitric oxide reductase and nitrous oxide reductase (nosZ), respectively. N2O is
Fig. 2.2 Nitrification and denitrification processes with associated enzymes and functional genes
(adapted from Di et al. (2014)).
2.4
Factors affecting nitrification, denitrification and N
2O emissions
2.4.1
Soil moisture content
Soil moisture content plays a significant role in nitrification, denitrification and N2O emissions since it
affects the soil aeration status (Cameron et al., 2013). For example, Osborne et al. (2016) reported that
nitrification increased with increasing moisture content but only whilst the soil remained aerobic.
Under aerobic conditions, nitrification occurs and N2O can be produced under certain soil conditions
(Fig. 2.3) (Di et al., 2014). Maag and Vinther (1996) reported that when soil moisture content increased,
the N2O-N produced from nitrification increased. Less than 60% of water filled pore space (WFPS) is
found as the optimal soil moisture content for nitrification, since the O2 or substrates are not restricted
(Bateman and Baggs, 2005). WFPS between 35% and 60% leads to N2O emissions which is produced
predominantly by autotrophic nitrification (Bateman and Baggs, 2005). A similar result was reported
by Ussiri and Lal (2013) (Fig. 2.4).
Fig. 2.4 A generalized schematic indicating the relationship between water-filled pore space (WFPS)
of soils and relative fluxes of N2O and N2. N2O can be produced by both nitrification and
denitrification and N2 is produced by denitrification (Ussiri and Lal, 2013).
Under anaerobic conditions, denitrification occurs producing N2O and N2 gases(Di et al., 2014). The
rate of denitrification increases significant when soil moisture content is greater than field capacity
(FC) (Mosier et al., 1986; de Klein and van Logtestijn, 1996; Saggar et al., 2009; Cameron et al., 2013).
Thus, the losses of N due to denitrification are greatest in late-autumn, winter and early-spring and
under the conditions of heavy rainfall or irrigation (Phillips et al., 2007; Cameron et al., 2013).
Since nitrification and denitrification can be affected by soil moisture content, the emissions of N2O
are also impacted. The relationship between WFPS and N2O/N2 flux is shown in Fig. 2.4. The emissions
of N2O produced by nitrification or denitrification change depending on the WFPS. Di et al. (2014)
found that the N2O emissions from urine-treated soil were dominantly driven by soil moisture content.
The total N2O emissions at 100% and 130% soil FC were 9 and 400 times that at 60% FC, respectively
(Di et al., 2014). The soil becomes increasingly anaerobic when soil moisture content increases, which
leads to higher denitrification rates and N2O emissions. It was also reported by Banerjee et al. (2016)
that the N2O emissions in wetter soils were higher than those in drier soils. Higher N2O emissions can
occur when WFPS is around 60% because of the combination of autotrophic nitrification and denitrifier
nitrification since the limitation of O2 may occur in a short term (Bateman and Baggs, 2005). However,
a decrease of N2O emission was shown when WFPS was higher than 90% because the conversion of
N2O to N2 occurs under complete anaerobic conditions (Smith et al., 1998). In addition, the emission
N
2O by nitrification
N
2O by denitrification
N
2R
e
la
ti
ve
N
2O
fl
u
x
ra
te
of N2O is high when soil moisture alternates between wetting and drying since both nitrification and
denitrification occur and the N2O produced cannot be reduced to N2 because there is insufficient time
(Sherlock et al., 1992).
The growth of ammonia oxidisers (AOB and AOA) and denitrifiers can also be affected by soil moisture
content. It was reported by Di et al. (2014) that the abundance of the AOB amoA gene in the urine
treatment increased with the increase of soil moisture content. The AOA amoA gene also increased
with soil moisture content but it was higher in the control than in the urine treatment. At low soil
moisture content (60% FC), the growth of both AOB and AOA was restricted (Di and Cameron, 2017).
According to Di et al. (2014) the abundance of measured denitrifier genes all increased with the
increase of soil moisture content, except narG. Although most denitrifiers are facultative aerobes, they
can use various forms of nitrogen oxides as electron acceptors in place of O2 when under anaerobic
conditions (Wrage et al., 2001). In addition, the growth of microbial communities was limited when
the soil was too dry (< 60% FC) (Di et al., 2014).
2.4.2
Temperature
Under higher temperatures, nitrification and denitrification rates are both higher, compared with rates
under low temperatures. Avrahami et al. (2003) found that the N2O release rate increased steadily
between 4 and 37°C (Fig. 2.5) after a short-term temperature adaptation when ammonium was not a
limitation. About 35-50 % of N2O production was released through nitrification between 4 and 25°C,
and nitrification was most active at the intermediate temperatures, i.e. 15-25°C. However, it was
reported by Hu et al. (2014b) that the rates of nitrification at high temperatures, such as at 25°C, 35°C
and 40°C, were significantly greater than the rates under lower temperatures (Fig. 2.6). The process of
nitrification is inhibited at the lower temperature because of the reduction in microbial activity. In
addition, the rate of denitrification can also be enhanced with the increase in temperature (Dobbie
and Smith, 2001; Cameron et al., 2013). It was reported by de Klein and van Logtestijn (1996) that
when temperature increased from 10°C to 20°C, a 10-fold increase in denitrification rate was recorded.
Cooler temperatures result in lower microbial activity, higher N2O solubility and a slower gas diffusion,
which leads to lower N2O emissions (Sherlock et al., 1992). However, because of the incomplete
denitrification and the low proportion of N2O converted to N2, thus N2O emissions were reported to
be higher when soil temperature was below 15°C (Keeney et al., 1979). It was reported by Keeney et
al. (1979) that because of incomplete denitrification, even though the denitrification rate was low
under 15°C, the amount of N2O released was equivalent to that under 25°C. For N2O emitted from
This is because NO3- accumulates at low temperatures, which results in an increase of the nitrifiers’
contribution to N2O emissions.
Fig. 2.5 Pattern of N2O production and percentage contribution of nitrification and denitrification to
total N2O emission after 5 days of incubation at different temperatures. Stacked bars indicate
percentage contribution of nitrification and denitrification to total N2O emission (white, nitrification;
grey, denitrification), and squares indicate rates of total N2O emission. Mean ± SE; note that x-axis
is not to scale (Avrahami et al., 2003).
2.4.3
Soil texture
N2O emissions are reported to be lower in free-draining soils than in poorly drained soils (Luo et al.,
2010). It was reported by Jamali et al. (2016) that greater N2O emissions occurred in fine-textured soil
than in free-draining soils, in the order: clay loam>loam>sand. The authors explained that the hydraulic
conductivity, porosity, water-holding capacity and aeration status were different in the different soil
types, and these affected soil moisture content. Similar results were also reported by Lan et al. (2013)
and Wlodarczyk et al. (2011).
However, contradictory results have been reported by some other researchers. It was found by Rafique
et al. (2011) that higher N2O emissions were produced from free-draining podzols, compared with
poorly drained gley soils. This was because the porosity in the podzols was higher, which led to an
enhancement of nitrification rate. Moreover, soil is frequently waterlogged in gley soils, which causes
a very high WFPS and almost completely anaerobic conditions (Rafique et al., 2011). This reduces the
nitrification rate in the soil and the denitrification pathway may be more complete, leading to less
Fig. 2.6 Effect of temperature and moisture on the net nitrification rate in three soil microhabitats.
Different capital letters indicate significant differences in net nitrification rate of the same
temperature among different soil moistures; different small letters denote significant differences
among different temperatures in the same soil moisture (P< 0.05). Error bars represent the standard
errors of the mean values for three replicates (Hu et al., 2014b).
2.4.4
Soil pH
Both nitrification and denitrification rate can be affected by soil pH. The process of nitrification is
sensitive to soil pH (Curtin et al., 1998; Jiang et al., 2015). Darrah et al. (1986) reported that the relative
nitrification rate reached the highest point when soil pH was around 6.5 (Fig. 2.7). The optimal range
of soil pH for nitrifying bacteria is from 4.5 to 7.5 (McLaren and Cameron, 1996). In very acid soils, the
toxicity of Al and/or the deficiencies of Ca and Mg may inhibit nitrification (McLaren and Cameron,
1996). In addition, nitrification rate, especially NH3 oxidation, is significantly lower when soil pH is less
than 5.5 since NH3 is protonated to NH4+ at a low pH. When the pH decreases to 5.0 or lower, the
activity of nitrifiers becomes negligible (Foth, 1997). In alkaline soils, the toxicity of NH3 may become
Both AOA and AOB are players of ammonia oxidation (Che et al., 2015). The growth and activity of AOB
and AOA can be affected by soil pH (Luo et al., 2007; Di and Cameron, 2017). In acidic soil ecosystems,
archaea may play an important role in ammonia oxidation (He et al., 2007; Yao et al., 2011; Zhang et
al., 2012; Che et al., 2015; Jiang et al., 2015) since they can adapt to extreme environment conditions
(Di et al., 2010). If high N concentrations do not inhibit AOA growth then AOA may become significant
in NH3 oxidation under strongly acidic conditions (He et al., 2012; Zhang et al., 2012; Hu et al., 2014a;
Di and Cameron, 2017). Robinson et al. (2014) reported that when the urine substrate was applied to
soil, AOA growth was favoured in the acid soil treatment once the urine was hydrolysed (after day 28),
and AOB growth was favoured in the alkaline treatment.
The rate of denitrification is also affected by soil pH (McLaren and Cameron, 1996). The rate of
denitrification increases with the increase of soil pH (ŠImek and Cooper, 2002; Hansen et al., 2014).
Compared with neutral or alkaline soils, the denitrification rate is slower in acid soils (Nägele and
Conrad, 1990; ŠImek and Cooper, 2002; Fageria and Baligar, 2008), especially when the pH is less than
5 (McLaren and Cameron, 1996). However, denitrification can still occur when soil pH is as low as 3.5
(Parkin et al., 1985). The optimum soil pH for denitrifying organisms is between 7 and 8 (Sherlock et
al., 1992).
The product ratio of N2O:N2 from denitrification is impacted by the level of soil acidity (Saggar et al.,
2013). Čuhel et al. (2010) reported that with a decrease of pH, the N2O/ (N2O+ N2) ratio increased
because of the changes in the total denitrification activity (Fig. 2.9B). In acid soils, N2O appears as the
dominant product frequently (Christensen, 1985) and the N2O: N2 ratio increases at lower soil pH
(Nägele and Conrad, 1990; Liu et al., 2010; Saggar et al., 2013; Samad et al., 2016). Robinson et al.
(2014) reported that the total N2O emissions were significantly higher in acid-treated soils than in the
untreated native and alkaline-treated soils when urine (700 kg N ha-1) was applied. When soil was at a
high pH level, complete denitrification was favoured, which produced more N2 than N2O (Fig. 2.8a)
(Čuhel et al., 2010).
2.4.5
Organic carbon
Organic carbon (C) can affect the denitrification process (Giles et al., 2017). Denitrification can be
stimulated by increasing the amount of readily available organic C, such as from animal excreta
deposition and organic waste applications to soil (de Klein et al., 2001; Di and Cameron, 2003; Cameron
et al., 2013). Since most of the denitrifiers are heterotrophs, the addition of organic C not only
stimulates the respiration and growth of microbes in the soil but also provides the organic C needed
by the denitrifiers (Cameron et al., 2013). Therefore, heterotrophic denitrification is often limited by
labile C in agricultural soils (Saggar et al., 2013). In most soils, the rate of denitrification decreases with
surface (Rolston, 1981). In addition, any process that can impact the C mineralisation rate in soils, such
as incorporation of crop residue, root exudates, organic or inorganic fertiliser application,
temperature, liming and drying-wetting, can have a major effect on the rate of denitrification. The
application of farm effluents has been shown to increase N2O emissions by enhancing the soil C
availability (Bhandral et al., 2007).
Fig. 2.7 Relative nitrification rate (RNR) expressed as a fraction of the maximum rate, as a function
of pH in the short-term nitrification assay (Darrah et al., 1986).
N2O production was positively correlated with total C, and highly correlated with water soluble organic
C (Burford and Bremner, 1975) (Fig. 2.9). This is because water soluble C can be used by the denitrifying
bacteria, resulting in higher N2O emissions. Compared with ammonium-based fertilisers, the
application of urea fertiliser leads to increased denitrification rates because of the direct supply of
dissolved organic C from urea and an increase of soil C solubilisation from an increase in soil pH caused
by urea hydrolysis (Barton et al., 1999). However, N2O emissions have also been reported to be
reduced by applying urea fertiliser with a C source (green manure and wheat straw), compared with
applying urea fertiliser alone (Aulakh et al., 2001). This is probably because of the dissimilatory nitrate
reduction to ammonium (Matheson et al., 2002) or microbial immobilisation of some of the added N
(Tiedje, 1988). In addition, it is generally considered that the ratio of N2O: N2 decreases with the
the same time (Ministry for the Environment, 2017). The rate of nitrification and denitrification are
influenced by the increased availability of N (including NH4+ and NO3-) (Cameron et al., 2013). Cardenas
et al. (2010) reported that the emissions of N2O were increased with the increase in the application
rate of N fertilisers (Fig. 2.10).
The type of N fertiliser also affects N2O emission levels. In some field studies, the N2O from oxidised N
fertilisers (nitrate based) was higher than reduced N fertilisers (Smith et al., 2012; Hinton et al., 2015).
Eckard et al. (2006) found that nitrate fertiliser released more N2O than urea fertiliser and N2O
emissions were positively correlated to N fertiliser application rate (Fig. 2.11). However, some other
studies reported conflicting results, where reduced N forms had higher N2O emissions (Lebender et al.,
2014; Soares et al., 2016). Kroeze (1994) found that anhydrous NH3 fertiliser produced higher N2O
emissions, compared with NH4+ and urea, while NO3- fertiliser led to the lowest N2O emission levels.
Since many factors can affect nitrification and denitrification, the comparative advantages of oxidised
or reduced N fertilisers regarding N2O emission potential strongly depend on weather and site specific
conditions (Snyder et al., 2009; Tierling and Kuhlmann, 2018). In addition, it was found from several
field studies that more N2O can be emitted from urea than ammonium N forms (Tenuta and
Beauchamp, 2003). Tierling and Kuhlmann (2018) reported 2.7-3.8 fold higher cumulative N2O
emissions from urea than from ammonium sulphate, and N2O emission rates from urea were
accompanied by elevated soil nitrite levels while those of ammonium sulphate were not. This indicated
that the alkalizing hydrolysis of urea increased the risk of nitrite accumulation and thus higher N2O
emissions as well.
Fig. 2.11 Predicted annual N2O emissions with increasing N fertiliser application rates with two
different fertilisers; urea (closed diamond) and nitrate (open triangle) (Eckard et al., 2006).
2.5
N
2O emissions from farm dairy effluent (FDE)
In New Zealand, dairy cows deposit the majority of their excreta (dung and urine) onto pastures in a
typical outdoor grazing system. Commonly, only the excreta that is deposited in and around the milking
shed is managed actively (Chung et al., 2013). These excreta are washed from the milking parlour and
yard into a pond or sump. Farm dairy effluent (FDE) is a combination of dairy cow excreta and
wash-down water from the dairy cow milking shed and the associated yards. This FDE is the most common
form of manure collection applied to the pastoral soils in New Zealand (van der Weerden et al., 2016a).
The concentration of dry matter (DM) classifies the produced effluent into FDE, slurries or solids (Li et
al., 2015b). FDE contains less than 5% DM whilst the DM content of slurry is between 5 and 15%. Solid
manure contains more than 15% DM (Longhurst et al., 2012).
The application of FDE on New Zealand pastures is the third largest source of N2O emissions (van der
Weerden et al., 2016a). The ‘Emission factor’ (EF) is used to describe the proportion of excreta N that
is emitted as N2O-N (Cameron et al., 2013). For animal manures, the range of emission factors is from
0% to 5% (de Klein and van Logtestijn, 1996; Cameron et al., 2013). Currently, the New Zealand
emission factor for FDE is 0.25% (Ministry for the Environment, 2017). Some reported EF values of FDE
are given in Table 2.1. Many factors can affect the EF of FDE, such as season and prior excreta
deposition.
There are two reasons why N2O emissions are increased by applying FDE. One is because of the
addition of N and available C, and another is because of the enhancement of soil moisture and the
increase of anaerobic conditions in the soil (Bhandral et al., 2007). Higher N2O emissions can result
significant relationship between FDE total N concentration and N2O EF (Fig. 2.12). Li et al. (2015a)
reported that some other components such as C content in FDE can also affect the EF of FDE.
Since there is a range of C concentrations in FDE, the different amounts of organic C applied will affect
soil denitrifiers, and subsequently impact denitrification rate and N2O emissions (Cameron et al., 2013).
The growth and respiration of microorganisms will be stimulated by adding effluent C to soils. Pelster
et al. (2012) suggested that FDE contained greater C content than pig manure and that this was the
reason why a higher N2O EF was recorded for FDE. Compared with inorganic N fertiliser, FDE leads to
higher N2O EF because the denitrification activity is increased by the increased C availability and/or by
the decline of soil aeration and the increase of respiration (Barton and Schipper, 2001). A significant
exponential relationship between N2O EF and C concentration in effluent was found by Li et al. (2015b)
through analysing results reported in the literature (Fig. 2.13). They explained that the increase of N2O
EF may be not only because of the enhancement of C content but also because of some other factors.
The highest N2O emissions are not necessarily caused by applying fresh FDE, which contains the highest
C concentration (Laubach et al., 2015). It was suggested by Bhandral et al. (2007) that both availability
of C and N within FDE, and C:N ratio can influence the denitrification rate and the N2O:N2 emission
ratio.
Table 2.1 N2O emission factors resulting from land application of FDE.
Soil type Country N source N input N2O emission Emission Reference
(kg N ha-1) (kg N ha-1) factor (%)
FDE(Spring) 23.9 1.357 2.00
FDE(Summer) 25.2 1.922 4.90
Treated FDE (Autumn) 21.8 0.382 2.00
Treated FDE (Winter) 13 0.102 0.80
Untreated FDE (Autumn) 61 0.585 2.20
Untreated FDE (Winter) 49.3 0.153 0.30
Treated piggery FDE (Autumn) 27.5 0.585 2.20
Treated piggery FDE (Winter) 23.1 0.13 0.60
Silt loam New Zealand Fresh FDE 100 2.34 0.62 (Li et al., 2016)
Fresh FDE(Spring) 98 1.62 1.65
Fresh FDE(Summer) 101 0.01 0.01
Fresh FDE(Autumn) 101 0.57 0.56
Stored FDE(Spring) 60 0.48 0.80
Stored FDE(Summer) 53 0.13 0.25
Stored FDE(Autumn) 100 0.27 0.27
FDE 23.9 0.493 2.00
FDE 25.2 1.433 5.70
FDE 18 0.449 2.50
Silt loam New Zealand Piggery effluent 368 6.99 1.90 (Khan, 1999)
Sandy loam New Zealand FDE 400 1.2 0.30 (Khan, 1999)
FDE 50 0.015 0.03
FDE 50 0.004 0.01
Fresh FDE 100 0.14 0.14
Stored FDE 100 0.03 0.03
Sandy loam
(Bhandral et al., 2010)
(Bhandral et al., 2007)
(Li et al., 2015a)
(Luo et al., 2008) Silt loam Sandy loam Silt loam Silt loam New Zealand New Zealand New Zealand New Zealand
New Zealand (Saggar et al., 2004)
2.6
Methods to reduce N
2O emissions
A number of methods have been proposed to reduce N2O emissions from pasture applied FDE and
increase the N use efficiency (Saggar et al., 2013).
Reducing the numbers of animal livestock is the simplest approach to decreasing N2O emissions (Li et
al., 2015b). However, reducing the number of animals is unlikely to be acceptable from a financial
perspective. Increasing milk production efficiency from dairy cows and growing meat-producing
animals more quickly will potentially reduce N2O emissions since N excretion would be decreased
(Satter et al., 2002; de Klein and Eckard, 2008). Reduced N content in effluent can decrease the applied
effluent N so that the potential risk can be minimised. Keeping a better N balance in feeding rations by
avoiding excessive N in diet will reduce effluent N concentration (Li et al., 2015b). Decreasing the crude
protein (CP) content of animal diets can also reduce N excretion (Hristov et al., 2011).
Nitrification inhibitors can reduce N losses by reducing the nitrification rate in soil (Di and Cameron,
2002b; Cameron et al., 2013). It was reported by Li et al. (2014) that using dicyandiamide (DCD) at 10
kg ha-1 just before applying FDE resulted in a 51% - 90% decrease in N
2O emissions, compared with
applying untreated FDE. It was reported by Li et al. (2015a) that 10 kg ha-1 of DCD decreased the N
2O
emission factor by 40-80% and 24-84% from fresh FDE and stored FDE, and reduced the N2O emission
factor by 69-76% and 60-70% from fresh manure and stored manure, respectively. In addition, they
also reported that DCD was more effective during the spring and autumn to reduce N2O emissions than
in summer. However, the use of DCD in New Zealand has been suspended awaiting the establishment
of a standard for food by the FAO’s Codex Committee.
Choosing the optimal timing of FDE application can improve the N use efficiency of FDE by plants. Key
soil and climatic factors should be considered, such as soil drainage and rainfall, before applying FDE
(Li et al., 2015b). It was found by Luo et al. (2008) that up to 96% of N2O emissions were reduced when
effluent was strategically applied to pastures under the condition of dry soil-moisture status. Both N2O
emissions and N leaching could be potentially reduced by decreasing the use of FDE in wet winter and
spring (Houlbrooke et al., 2004). Saggar et al. (2013) suggested that the application of the right amount
of effluent close to the time that the nutrients are needed by the crop is the best strategy of N losses
reduction.
A high application rate of FDE increases the availability of N and C in soil so that denitrification is
promoted, generally leading to higher N2O emissions (Saggar et al., 2004a). The particular production
system depends the level of optimum N concentration in applied FDE (Li et al., 2015b). Computer
models such as, Overseer® are useful tools to build a nutrient budget to guide the application of FDE
In addition, a pre-treatment that decreases the pH level to less than 7 before FDE is applied to pasture
can reduce the emissions of NH3 (Petersen and Sommer, 2011). Addition of nitric or sulphuric acid to
the effluent can reduce NH3 losses by up to 75% (Ndegwa et al., 2011). In the following application,
N2O emissions can be potentially reduced by the acidification of FDE and the effluents with reduced C.
It was suggested that the emissions of NH3 and N2O were significantly lower after applying digested
and acidified FDE than untreated FDE (Li et al., 2015b).
Recently, advanced FDE treatment technologies have been developed to separate the solids in the FDE
from the liquid in order to recycle the water in FDE to wash the farm yards and reduce the size of
effluent pond required to store the FDE. These treatment technologies produce treated effluent (the
effluent with greater amounts of solids) and treated clear water (which can be re-used for washing the
yard) with properties which are different from the original un-treated FDE in terms of solid contents
and organic C content (Cameron and Di, pers. comm) (see more details in Materials and methods in
Chapter 3). These different properties may impact on the nitrifying and denitrifying microbes in the
soil, the nitrification rate dynamics and subsequently N2O emissions. However, there is a lack of
detailed knowledge and understanding about the effect of the application of treated effluent and
treated clear water to the soil on microbial processes and N2O emissions. There is therefore a need to
conduct scientific studies to determine the impacts of these treated effluents on soil microbial
activities and N2O emissions compared with the standard FDE in order to understand potential impacts
and develop appropriate management strategies to reduce N2O emissions.
2.7
Conclusions
N2O is produced during the processes of nitrification and denitrification. Nitrification, denitrification
and the N2O emission rate can be affected by many factors, such as soil moisture, temperature, soil
texture, soil pH, soil organic C and N fertiliser application. FDE is an important source of N2O emissions
in New Zealand. FDE with different properties may produce different N2O emission factors. The
relationships between the treated FDE (treated clear water and treated effluent, using the latest FDE
treatment technology) and N2O emissions and soil microbes are unclear. In addition, it is not clear if
the treated FDE would have a different interactive effect when co-applied with animal urine compared
with the standard FDE. Therefore, there is a need to determine the effect of the treated FDE compared
with the standard FDE on N2O emissions, nitrifying and denitrifying microbes, and possible interactive
Chapter 3
Materials and methods
3.1
Introduction
Two parallel laboratory incubation studies were conducted to determine the impact of applying three
different types of effluents on soil nitrification rate dynamics and nitrous oxide (N2O) emissions. One
experiment was conducted to determine the effect of the effluents, with or without animal urine, on
N2O emissions. At the same time, a companion experiment was conducted to determine the effect of
the different effluents, with or without animal urine, on mineral nitrification rate dynamics and the
abundance of ammonia oxidising bacteria (AOB) and archaea (AOA), and denitrifying functional genes
(nirS, nirK, nosZ (I)and nosZ (II)).
3.2
Experiment preparation and setup
3.2.1
Soil
A Templeton silt loam, classified as Immature Pallic soil (Hewitt, 1993); Udic Haplustepsts (Soil Survey
Staff, 2014), was used in this study. The top 10 cm of soil was collected from the Lincoln University
Research Dairy Farm, about 20 km south of Christchurch (43°38′S, 172°27′E), thoroughly mixed, with
the roots and stones removed, and sieved through a 5 mm sieve (Fig. 3.1). The properties of the soil
are shown in Table 3.1. The annual rainfall in the region is about 650 mm, and the annual average
temperature is about 12.1°C. The soil moisture content was measured, by drying 6 replicate samples
for 24 hours at 105°C in the oven, and was 16.97 % on average. The soil was acclimatised in the
incubator at 12°C for one week before treatments were applied.
3.2.2
Farm dairy effluent
Farm dairy effluent was collected from the Lincoln University Demonstration Dairy Farm. A farm
effluent treatment technology has been developed at Lincoln University to separate the solids out from
the effluent in order to purify and recycle the water to wash the yard. The treatment technology
involves adding a ferric iron (Fe3+) compound to coagulate the colloidal solids in the FDE in a treatment
tank (Cameron and Di, pers. comm). Once the solids are settled at the bottom of the treatment tank,
which takes about 30-60 minutes after treatment application, the treated clear water (about the top
two thirds of the tank) has a turbidity less than 50 NTU and can be used to recycle the water for
cleaning the farm yard (Fig. 3.2). The treated effluent (the more concentrated effluent that has settled
at the lower part of tank) is emptied out of the tank and put in the storage pond before being irrigated
at the equivalent of 100 kg N ha-1 and the urine was applied at the equivalent of 700 kg N ha-1
(equivalent to 91 mg N kg-1 dry soil and 636 mg N kg-1, respectively).
Fig. 3.2 Different types of effluent. From left to right is standard FDE, treated effluent and treated
clear water, respectively.
Table 3.1 The properties of the soil used in this study.
Table 3.2 Original properties of the three different types of effluent used in this study.
Table 3.3 Description of the treatments.
Property Value
Organic matter (g kg-1) 5.0
Total Nitrogen (g kg-1) 2.7
Total Carbon (g kg-1) 29.0
pH (H2O) 6.1
Olsen P (mg kg-1) 45.7
CEC (cmolc kg-1) 13.3
Exchangeable Calcium (cmolc kg-1) 7.5
Exchangeable Magnesium (cmolc kg-1) 1.2
Exchangeable Potassium (cmolc kg-1) 1.0
Exchangeable Sodium (cmolc kg-1) 0.3
Base saturation (%) 74.0
Sulphate Sulphur (mg kg-1) 6.7
Chemical property Standard FDE Treated clear water Treated effluent
Turbidity (NTU) 2277.0 10.7 4882.7
Total solid (g m-3) 4233.3 1706.7 11266.7
pH 7.2 5.9 5.9
Total nitrogen (g m-3) 495.0 311.0 570.0
Ammonium (g m-3) 115.3 119.0 121.0
Nitrate + nitrite (g m-3) 0.1 4.0 2.8
Total phosphorus (g m-3) 42.0 0.8 77.7
Dissolved reactive phosphorus (g m-3) 23.3 0.0 0.0
Total carbon (g m-3) 1270.0 655.0 2933.3
Soluble carbon (g m-3) 713.3 596.7 670.0
cBOD (g m-3) 936.7 520.0 1390.0
Fe (g m-3) 9.3 10.7 794.0
FDE type Urine Replicates
(100 kg N ha-1) (700 kg N ha-1)
1 Water (0) 0 4
2 Standard FDE 0 4
3 Treated clear water 0 4
4 Treated effluent 0 4
5 Water (0) 700 4
6 Standard FDE 700 4
7 Treated clear water 700 4
8 Treated effluent 700 4
The pottles for soil sampling and the jars for N2O gas sampling were placed inside the incubator
following a randomized block design. The incubator was set to a temperature of 12°C (simulating the
autumn/winter soil temperature in New Zealand).
The experimental design for the trials was a randomized block design with four replicates of each
treatment (Table 3.3). Treatments were randomly numbered and allocated to pottles and jars and
were randomly placed within each block inside the incubator. The soil moisture content was adjusted
to and maintained at field capacity during the incubation (30% gravimetric water content), which
equalled 56.4% water filled pore space (WFPS).
3.2.4
Gas sampling jars
There were 32 glass jars (1 litre) used in the N2O emissions sampling trial (Fig. 3.4). Each jar was packed
with 600 g soil (dry equivalent) to a bulk density of 1 g cm-3. The effluent and cow urine treatments
were applied evenly over the soil surface (Table 3.4). The total weight of each jar (without lid) was
recorded. The maintenance of soil moisture content (30%) was done twice a week, after taking gas
samples and in between gas sampling, by the addition of de-ionized water until the jar reached the
recorded weight. There were two 1 cm diameter holes in the lid of the sampling jar to allow aeration.
3.2.5
Soil sampling pottles
A total of 32 pottles were established for soil sampling to determine nitrification rate dynamics,
ammonia oxidisers and denitrifiers (Fig. 3.5). Each pottle contained 500 g of soil (dry equivalent). After
the effluent and urine treatments were applied, the soil was thoroughly mixed (Table 3.5). Subsamples
of soil were taken after 1, 7, 14, 28, 63, 91, 119, 154 and 210 days of incubation to determine the NH4+,
NO3-, pH, AOB, AOA, nirS, nirK, nosZ and soil moisture content. There were two 1 cm diameter holes in
the lid of soil sampling pottle to allow aeration. The weight of each pottle (without lid) was recorded
after each subsampling in order to maintain soil moisture content by adding de-ionized water. The
maintenance of soil moisture content was done twice a week as described for the gas sampling jars.
Table 3.4 The volumes of effluents and/or cow urine applied to the incubation jars.
Table 3.5 The volumes of effluents and/or cow urine applied to the soil sampling pottles.
3.3
N
2O gas sampling and analysis
The method used to measure N2O gas emissions in this study was similar to that of Hutchinson and
Mosier (1981). During N2O sampling, the gas jars were taken out of the incubator and the lids were
removed and replaced with gas sampling lids, which contained a rubber septum, tap and needle (Fig.
3.6). During each sampling event, a 10 mL gas sample was taken, 30 minutes apart (one at time 0, and
one 30 minutes later), and was injected into a pre-evacuated 6 mL glass vial using a hypodermic needle
Treatment Water Standard FDE Treated clear water Treated effluent Urine Replicates
(mL) (mL) (mL) (mL) (mL)
1 91 0 0 0 0 4
2 55 36 0 0 0 4
3 55 0 36 0 0 4
4 55 0 0 36 0 4
5 36 0 0 0 55 4
6 0 36 0 0 55 4
7 0 0 36 0 55 4
8 0 0 0 36 55 4
Treatment Water Standard FDE Treated clear water Treated effluent Urine Replicates
(mL) (mL) (mL) (mL) (mL)
1 75 0 0 0 0 4
2 45 30 0 0 0 4
3 45 0 30 0 0 4
4 45 0 0 30 0 4
5 45 0 0 0 45 4
6 0 30 0 0 45 4
7 0 0 30 0 45 4
and 60 mL syringe. Before taking the gas sample, the air in the jar was mixed 3 times by recirculating
10 mL of air three times using the syringe.
After gas sampling, the soil moisture content was maintained by weighing each jar and adding
de-ionized water to achieve the initial weight. The incubation lids were then replaced before returning
the jars to the incubator. N2O gas samples were taken twice a week for the first 70 days and then taken
weekly for the remainder of the study. The glass vial rubber septum was replaced after each sampling.
Fig. 3.5 The soil sampling pottles inside the incubator.
Fig. 3.6 An example of N2O gas sampling. Top left: the gas sampling lids used. Bottom left: A syringe
was used to mix the gas and then inject 10 mL into an evacuated vial. Middle: the preparation just
The concentration of N2O was measured using a gas chromatograph (SRO8610 linked to a Filson 222XL
autosampler) using an Electron Capture Detector (ECD) (SRI Instruments, USA). N2O gas emissions were
calculated by comparing the N2O concentration in the two samples (A and B) extracted from the
headspace of the incubation jars. A preliminary study showed a linear increase of N2O during the 30
min sampling interval.
The hourly N2O emissions for each sampling day were calculated using the following equation:
𝑁2𝑂 𝑓𝑙𝑢𝑥 =
(𝑐1− 𝑐0) × 𝐻𝑉 × 𝑃 × 𝐶𝐿× 𝑀𝑁2𝑂× 𝐶𝑚𝑔
(𝑡1− 𝑡0) × 𝑆𝐴 × 𝑅 × 𝑇𝐾
Where:
N2O flux = Hourly N2O emissions (mg N2O-N m-2 hr-1)
c0 = N2O concentration at t0 (μL L-1)
c1 = N2O concentration at t1 (μL L-1)
HV = Headspace volume of the chamber (L)*
P = Atmospheric pressure (1 atm)
CL = Conversion factor μL to L (0.000001 L μL-1)
MN2O = Molecular weight of N in N2O (28.01 g mol-1)
Cmg = Conversion factor μg to mg (1000 mg μg-1)
t0 = Time 1st sample taken (0 hours)
t1 = Time 2nd sample taken (0.5 hours)
SA = Surface area of gas jar (0.0064 m2)
R = Universal gas constant (0.0821 L atm mol-1 K-1)
TK = Temperature (K) **
* Chamber headspace volume (HV) = SA (0.0064 m2) × headspace height (m) × 1000(L m-3).
The hourly N2O emissions were used to calculate daily emissions by assuming it represented the
average hourly flux of the day (de Klein et al., 2003). The cumulative N2O emissions were calculated by
integrating the calculated daily N2O fluxes and linearly interpolating between measurements for each
jar.
The emission factor (EF) of N2O was calculated for each treatment in each block using the following
equation:
𝐸𝐹(%) = 𝑁2𝑂-𝑁 𝑡𝑜𝑡𝑎𝑙 (𝑡𝑟𝑒𝑎𝑡𝑚𝑒𝑛𝑡) − 𝑁2𝑂-𝑁 𝑡𝑜𝑡𝑎𝑙 (𝑐𝑜𝑛𝑡𝑟𝑜𝑙)
𝑇𝑜𝑡𝑎𝑙 𝑁 (𝑎𝑝𝑝𝑙𝑖𝑒𝑑) × 100
Where:
EF (%) = Emission factor (N2O-N emitted as % effluent and/or urine applied)
N2O-N total (treatment) = Total N2O emissions (kg N ha-1) from effluent or urine treatments
N2O-N total (control) = Total N2O emissions (kg N ha-1) from the control
Total N (applied) = Total N application rate (kg N ha-1)
3.4
Soil sampling and analysis
In total, 9 batches of soil subsamples were taken after 1, 7, 14, 28, 63, 91, 119, 154 and 210 days of
incubation to determine the concentration of mineral N (including NH4+ and NO3-), soil moisture
content, soil pH and the abundance of AOB, AOA, and denitrifying functional genes (including nirS, nirK
and nosZ) (Fig. 3.7). For each sampling date, the 32 pottles were removed from the incubator. Soil
moisture content was maintained before taking the subsamples, by weighing each pottle and adding
de-ionized water to the recorded weight.