R E S E A R C H
Open Access
Rumen-protected conjugated linoleic acid
supplementation to dairy cows in late pregnancy
and early lactation: effects on milk composition,
milk yield, blood metabolites and gene
expression in liver
Tanja Sigl
1*, Gregor Schlamberger
1, Hermine Kienberger
2, Steffi Wiedemann
1, Heinrich HD Meyer
1, Martin Kaske
3Abstract
Background:Conjugated linoleic acid (CLA) is a collective term for isomers of octadecadienoic acid with
conjugated double-bond system. Thus, it was the objective to investigate whether milk composition and metabolic key parameters are affected by adding CLA to the diet of dairy cows in the first four weeks of lactation.
Methods:A study was carried out with five primiparous cows fed a CLA supplemented diet compared to five primiparous cows without CLA supplementation. CLA supplemented cows received 7.5 g CLA/day (i.e. 50%cis(c)9, trans(t)11- and 50%t10,c12-CLA) starting two weeks before expected calving and 20 g CLA/day (i.e. 50%c9,t 11-and 50%t10,c12-CLA) throughout day 1 to 28 of lactation.
Results:The CLA supplement was insufficiently accepted by the animals: only 61.5% of the intended amount was ingested. Fed CLA were detectable in milk fat, whereas contents ofc9,t11-CLA and t10,c12-CLA in milk fat were higher for CLA supplemented cows compared to the control group. On average over the entire treatment period, there was a decrease of saturated fatty acids (FA) in milk fat of CLA supplemented cows, combined with a higher content of monounsaturated andtransFA.
Our study revealed no significant effects ofc9,t11- andt10,c12-CLA supplementation either on milk yield and com-position or on metabolic key parameters in blood. Furthermore the experiment did not indicate significant effects ofc9,t11- andt10,c12-CLA-supplementation on gene expression of peroxisome proliferator-activated receptor-alpha (PPARa), PPARg, sterol regulatory element-binding protein-1 and tumor necrosis factor-alpha in liver tissue.
Conclusions:Feedingc9,t11- and t10,c12-CLA during the first weeks after calving did not affect metabolic key parameters of blood serum or milk composition of fresh cows. Milk fatty acid composition was changed by feedingc9,t11- and t10,c12-CLA resulting in higher contents of these isomers in milk fat. High contents of long chain FA in milk fat indicate that CLA supplementation during the first four weeks of lactation did not affect massive peripheral lipomobilization.
* Correspondence: sigl@wzw.tum.de
1Physiology Weihenstephan, Technische Universitaet Muenchen,
Weihenstephaner Berg 3, Freising-Weihenstephan, Germany
Background
Within the European Union, a system with fixed milk quotas per farm is applied, aiming to control total milk production and avoid surplus of milk. The quota is expressed as kg milk with a defined milk fat content, which allows the farmer to market a higher milk volume if milk fat content is low. Therefore, the possibilities to decrease milk fat content have gained interest from farm-ers. Furthermore, the dairy industry tries to enhance con-sumers trust in dairy fat by increasing the conjugated linoleic acid (CLA) content. Finally, the interest in CLA in research today is to a large extent driven by a general interest in the mechanisms of milk fat synthesis.
Extensive basic research, established predominantly by the group of Bauman and colleagues in Cornell, has shown that trans(t)10,cis(c)12-CLA reduces milk fat synthesis in the alveolar epithelial cells of the mammary gland [1] and, consequently, milk fat percentage.
Moreover, a reduction of milk fat production was con-sidered as an option to reduce the metabolic imbalance of transition cows. The transition period, i.e. 21 days before calving until day 21 after calving [2], is a critical time frame in which the animals have to cope an enor-mous metabolic challenge due to the rapid onset of high milk production and a reduced dry matter intake. Mana-ging and feeding the transition cow affects health and productivity during lactation and is the basis for eco-nomical and sustainable milk production. To meet energy requirements at the beginning of lactation, an increase of energy density of the diet by adding rumen-protected fat may be assumed. Furthermore, the energy deficit also could be reduced if the fat content of milk is lowered by a feed supplement.
It is hypothesized that a reduction of milk fat percen-tage may improve the metabolic resilience of high yield-ing dairy cows in early lactation. Thus, it was the objective to investigate whether milk composition and metabolic key parameters are affected by adding rumen-protected CLA to the diet of dairy cows in the first four weeks of lactation.
Materials and methods
Animals, treatments, and sampling
The study was performed according to strict federal and international guidelines on animal experimentation. The experiment was set up according to the requirements of the Bavarian State animal welfare committee. Ten primi-parous Brown Swiss cows were allocated to one of two groups before calving. Cows of control group (n = 5) were fed a lactational diet with concentrates according to milk yield at the onset of lactation, cows of treatment group (n = 5) were fed the same lactational diet and concentrates. However additional CLA supplement was
fed during the first four weeks of lactation to cows of the CLA-group. Group arrangement was based on how well cows accepted the fat supplement. Cows that con-sumed the fat concentrate during five successive test days before milk stasis (56 days before expected calving date) immediately after submission were arranged to CLA-treatment group. Due to the well known feed intake depression at the beginning of lactation, espe-cially related to the mealy and powdery supplement, a good acceptance of the supplement by each cow of treatment group was required. The study was performed with primiparous cows exclusively to avoid lactation number as a confounding factor and due to the fact that the overall effects of CLA on milk synthesis do not depend on the lactation number [3]. All cows were housed in free stall barns fitted with rubber mats and fed the same basal diet (corn silage 43%, grass silage 25%, hay 32%; NEL 1.36 Mcal/kg, Table 1) during the prepartum period, and then switched to a lactational diet (corn silage 60%, grass silage 23%, concentrates 12%, hay 4%, and minerals 1% of wet weight; NEL 1.55 Mcal/kg, Table 1) immediately after parturition. The basal diet, formulated on the basis of a milk yield of 22 kg/day, was delivered once daily (0700 h) and intended to provide ad libitumintake (> 5% residual feed). If daily milk yield exceeded 22 kg additional concentrates were fed (0.5 kg concentrates per kg milk). Dry matter intake could not be assessed. Water was available at all
Table 1 Ingredients and chemical composition of lactational and basal diet1.
Variable Lactational diet Basal diet
Ingredient, %
Corn silage 60 43
Grass silage 23 25
Hay 4 32
Concentrates2 12
-Mineral mix3 1
-Chemical analysis, %
DM 45.2 52.0
CP 12.2 12.9
CF 18.6 19.2
NFC 26.4 9.92
Ether extract 3.16 3.16
NEL, Mcal/kg 1.55 1.36
1
Lactational diet was fed to all cows postpartum and basal diet was fed to all cows prepartum.
2
Composition: corn gluten 18.4%, turnips molasses chips 13.8%, wheat 10.0%, triticale 10.0%, rape cake 10.0%, maize 8.8%, malt germ 6.0%, grain distillation residual (ProtiGrain) 5%, rape extraction grist 5%, rumen protected rape extraction grist 5%, palm corn cake 3.3%, soy extraction grist 2.8%, sodium bicarbonate 1.0%, calcium bicarbonate 0.99%, plant oil (palm coconut) 0.40%.
3
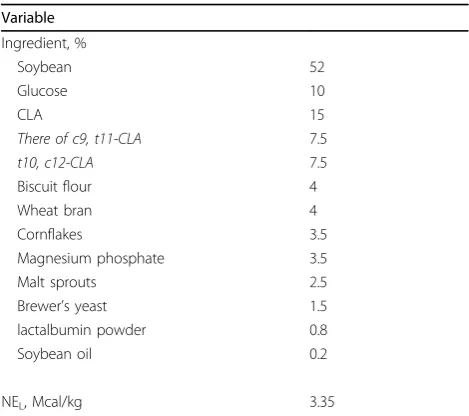
times. Five cows were additionally fed a special supple-ment including rumen-protected CLA (encapsulation technology: spray freezed; BEWITAL GmbH & Co. KG, Südlohn-Oeding, Germany) (Table 2). They received 7.5 g CLA/day (50% c9,t11- and 50%t10,c12-CLA) starting two weeks before expected calving and followed by 20 g CLA/d (50% c9,t11- and 50% t10,c12-CLA) during the first 28 days of lactation. CLA supplement was offered at the bunk once daily immediately after milking (0600 h) while cows were fixed in the feed fence. Refusals of CLA were weighed and recorded.
After parturition, cows were milked twice daily (0415 and 1545 h) and milk yields were recorded at each milk-ing until day 56. Milk samples were taken at the evenmilk-ing milking. Samples were separated during milking into sample vessels (capacity about 1 liter) controlled by milk flow rate and total amount of milk (Metatron P21, GEA WestfaliaSurge, Boenen, Germany). One aliquot was stored at 4°C for a maximum of 10 days with a preser-vative (acidiol) until analyses of milk composition. A second aliquot was stored at -20°C until analyzed for fatty acid composition. Milk composition was analyzed daily during the first week of lactation and thereafter twice a week for 7 weeks (from week 2 to week 8 post-partum). Fatty acid (FA) composition was examined twice a week during the first 4 weeks postpartum and weekly during the following 4 weeks (from week 5 to week 8 postpartum).
Jugular blood samples were collected in the morning (0700 h) at calving and at weeks 1, 2, 4, 6, and 8 of lac-tation. Blood serum was harvested following centrifuga-tion (2000 × g, 15 min at 4°C) and stored in three
aliquots at -20°C until analyzed for total bilirubin (TB), glucose, non-esterified fatty acids (NEFA) and betahy-droxybutyrate (BHB). Liver biopsies were obtained (Bard® MAGNUM™, Covington, USA) in the morning (0800 h) at weeks 1, 2, 4 and 8 of lactation. Liver tissue (approx. 100 mg) was frozen immediately in liquid nitrogen, and stored at -80°C until analyzing for gene expression.
Milk composition analysis
Milk protein, fat, lactose, urea and pH were analyzed by infrared-spectrophotometric technique (MilkoScan™ FT6000) and somatic cell count was determined by fluorescence-optical counting system (Fossomatic™FC) in the laboratories of Milchprüfring Bayern e.V., Germany.
Milk fatty acid analysis
The FA composition of milk samples was determined using FA methyl esters (FAME) prepared by transesteri-fication with TSMH (trimethylsulfonium hydroxide) at room temperature. FAMEs were analyzed using gas chromatography (GC 6890, AgilentTechnologies, Wald-bronn, Germany) to determine isomer distribution pat-terns. FA were quantified by use of Chromeleon® 6.8 Chromatography Software (Dionex, USA).
Blood serum analysis
Glucose, NEFA, BHB, and TB were analyzed with an automated clinical chemistry analyzer (ABX Pentra 400, Horiba, Montpellier, France). The hexokinase method was applied for glucose analysis and NEFA concentra-tions were determined with the enzymatic reacconcentra-tions (both Hoffmann La-Roche, Basel, Switzerland). BHB measurement was performed by using an enzymatic analysis (Sigma-Aldrich Diagnostics, Munich, Germany). TB was analyzed via Jendrassik/Grof reaction [4]. The clinical chemistry analyzer was calibrated and controls assayed daily according to the manufacturer’s instruc-tions to ensure acceptable assay performance.
Gene expression
Total RNA was isolated from liver tissue samples according to the manufacturer’s instructions of peq-GOLD TriFast™. RNA was quantified by spectrophoto-metry (BioPhotometer, Eppendorf, Hamburg) and diluted in RNase-free water. Degradation of the RNA was measured with the Agilent 2100 Bioanalyzer (Agi-lent Technologies, Waldbronn, Germany) in connection with the RNA 6000 Nano Assay. Gene expression was measured by reverse transcription quantitative polymer-ase chain reaction (RT-qPCR) (SuperScript™ III Plati-num® SYBR® Green One PCR Kit, Invitrogen, Karlsruhe, Germany) using the RotorGene3000 (Corbett Research, Table 2 Ingredients of CLA supplement1.
Variable
Ingredient, %
Soybean 52
Glucose 10
CLA 15
There of c9, t11-CLA 7.5
t10, c12-CLA 7.5
Biscuit flour 4
Wheat bran 4
Cornflakes 3.5
Magnesium phosphate 3.5
Malt sprouts 2.5
Brewer’s yeast 1.5
lactalbumin powder 0.8
Soybean oil 0.2
NEL, Mcal/kg 3.35
1
Cows received 7.5 g CLA/day (50%c9,t11- and 50%t10,c12-CLA) starting two weeks before expected calving and followed by 20 g CLA/day (50%c9,
Cambridge, United Kingdom). Primer for proliferator-activated receptor-alpha (PPARa), PPARg, sterol regula-tory element-binding protein-1 (SREBP1) and tumor necrosis factor-alpha (TNFa) were designed using Pri-mer3 online-software and synthesized by Metabion International AG (Martinsried, Germany, Table 3). The mean of the two housekeeping genes, histone and ubi-quitin, was calculated for the reference index and used for normalization.Δquantitative Cycle (Cq)-values were calculated as ΔCq = Cqtarget gene - meanCqrefence genes andΔΔCq-values were calculated according toΔΔCq = ΔCqtarget gene- meanΔCqrefence genes.
Statistical analysis
Endpoints measured repeatedly (milk yield, milk compo-sition and milk FA profile) were reduced to weekly means before statistical analysis. Differences among
treatments (group) and comparisons between times (week) were analyzed by repeated measures ANOVA using Bonferroni’s t-test (Sigma-Stat v.3.00 and the PASW Statistics 17, both SPSS Inc., Chicago, USA).
The effects of group and week were considered as fixed effects with week of experiment as a repeated mea-surement and with cow within dietary treatment (group) as the subject. Orthogonal polynomial contrast was used to describe linear, quadratic or cubic trends over time (week by group interaction) and group effects. All data are presented as mean ± standard deviation (SD). Means were considered to differ significantly in case P< 0.05.
Results
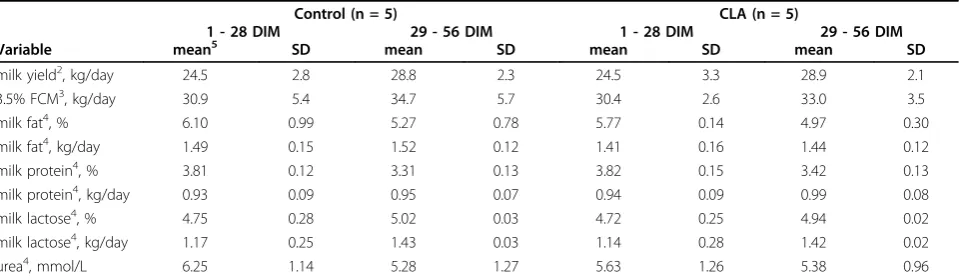
The CLA supplement was insufficiently accepted by the animals after parturition: on average, only 61.5% of the intended amount of 20 g CLA per day (10 gc9,t11- and 10 gt10,c12-CLA) was ingested. In the first week post-partum cows ingested 10.1 ± 7.8 g CLA per day, 11.5 ± 7.7 g CLA at week 2 postpartum, 15.2 ± 6.4 CLA at week 3 postpartum and 12.4 ± 6.5 g CLA at week 4 of lactation (50% c9,t11 and 50%t10,c12-CLA). On aver-age, cows ingested 12.3 ± 4.7 g CLA/day during the treatment period. Results were calculated for two time-frames: from day 1 postpartum until day 28 postpartum (CLA supplemented period) and from day 29 postpar-tum until day 56 postparpostpar-tum. Milk yield, milk protein, milk fat, and urea content did not differ between the two groups (Table 4).
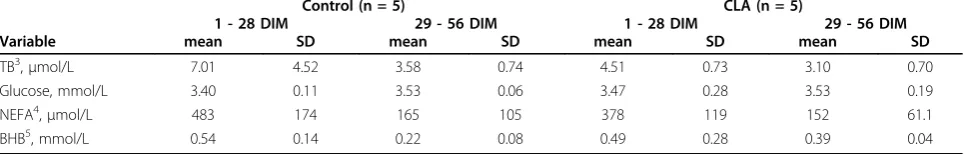
Metabolic key parameters did not differ between groups during treatment and from week 5 to week 8 (Table 5).
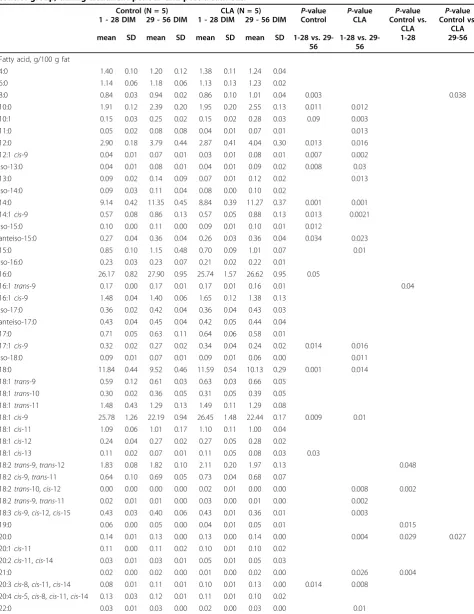
Absorbed CLA was detectable in milk fat during the supplementation timeframe, resulting in a shift in the Table 3 Sequences of PCR primers1.
Primer Sequence (5’!3’)
Histone forward ACT TGC TAC AAA AGC CGC TC
reverse ACT TGC CTC CTG CAA AGC AC Ubiquitin forward AGA TCC AGG ATA AGG AAG GCA T
reverse GCT CCA CCT CCA GGG TGA T PPARa forward GGA TGT CCC ATA ACG CGA TTC G
reverse TCG TGG ATG ACG AAA GGC GG PPARg forward CTC CAA GAG TAC CAA AGT GCA ATC
reverse CCG GAA GAA ACC CTT GCA TC
SREBP1 forward CCA GCT GAC AGC TCC ATT GA
reverse TGC GCG CCA CAA GGA
TNFa forward CCA CGT TGT AGC CGA CAT C
reverse CCC TGA AGA GGA CCT GTG AG
1
Primers were designed using Primer3 online software and synthesized by metabion international AG (Martinsried, Germany).
Table 4 Means ± SD for milk yield and milk composition during and after the treatment period1.
Control (n = 5) CLA (n = 5)
1 - 28 DIM 29 - 56 DIM 1 - 28 DIM 29 - 56 DIM
Variable mean5 SD mean SD mean SD mean SD
milk yield2, kg/day 24.5 2.8 28.8 2.3 24.5 3.3 28.9 2.1
3.5% FCM3, kg/day 30.9 5.4 34.7 5.7 30.4 2.6 33.0 3.5
milk fat4, % 6.10 0.99 5.27 0.78 5.77 0.14 4.97 0.30
milk fat4, kg/day 1.49 0.15 1.52 0.12 1.41 0.16 1.44 0.12
milk protein4, % 3.81 0.12 3.31 0.13 3.82 0.15 3.42 0.13
milk protein4, kg/day 0.93 0.09 0.95 0.07 0.94 0.09 0.99 0.08
milk lactose4, % 4.75 0.28 5.02 0.03 4.72 0.25 4.94 0.02
milk lactose4, kg/day 1.17 0.25 1.43 0.03 1.14 0.28 1.42 0.02
urea4, mmol/L 6.25 1.14 5.28 1.27 5.63 1.26 5.38 0.96
1
CLA supplemented timeframe: d 1 till d 28 of lactation; five primiparous cows received a special supplement including rumen-protected CLA (10 gc9,t11-CLA/ day andt10,c12-CLA/day).
2
Milk yield was recorded at each milking.
3
FCM was calculated like following: (fat [%] × 0.15 + 0.4) × milk yield [kg/day]
4
Milk composition was analyzed once daily in the first week after parturition and twice a week from week 2 until week 8 postpartum.
5
FA composition of milk fat (Table 6). On average over the entire treatment period, there was a reduction in the yield of saturated fatty acids in the milk fat of cows receiving CLA, together with a higher content of mono-unsaturated andtrans FA. Contents ofc9,t11-CLA were higher in milk fat of CLA supplemented cows compared to the control group (0.73 ± 0.04 g/100 g fatvs. 0.64 ± 0.01 g/100 g fat). In addition, contents oft10,c12-CLA in milk fat of CLA supplemented cows were significantly higher compared to the control group (0.02 ± 0.01 g/ 100 g fatvs. 0.00 ± 0.00 g/100 g fat,P= 0.002).
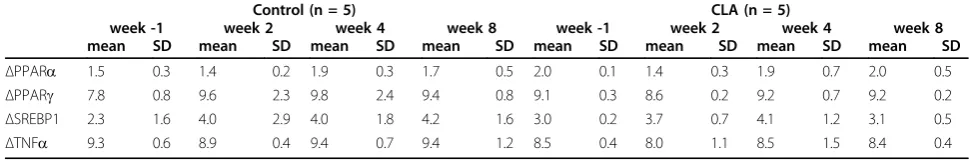
Total RNA quantity and RNA integrity number (RIN) values were similar for cows in the control group (RNA concentrations: 1276 ± 1016 ng/μl; RIN values: 6.5 ± 2.3) and for cows in CLA supplemented group (RNA concentrations = 1109 ± 986 ng/μl; RIN values: 6.6 ± 1.9). mRNA levels of histone and ubiquitin were tested for normal distribution. Constant mRNA levels of his-tone and ubiquitin was manifested by analysis of var-iance. ΔCq-values and ΔΔCq-values of the genes PPARa, PPARg, SREBP1 and TNFa did not differ between the two groups and over the weeks (Table 7).
Discussion
The transition period between late pregnancy and early lactation is characterized by a shift in nutrient partition-ing that requires extensive coordination of metabolism to ensure an adequate supply of nutrients to support milk synthesis [5]. Due to this metabolic adaptation, the CLA supplementation in this project was designed to start before parturition and to take place along the whole transition period.
In the present study, CLA supplementation did not affect milk fat content. This differs from other studies conducted with cows during established lactation, in which feeding rumen-protected CLA [6-9] or abomasal infusion of CLA [10-13] or intravenous infusions of CLA [14] resulted in a reduction of milk fat content. An
explanation for the lack of a CLA response in milk fat during the first few weeks postpartum is unknown [8]. Our analysis indicates that c9,t11- and t10,c12-CLA were consistently transferred to milk fat throughout the treatment period. Contents of c9,t11- andt10,c12-CLA in milk of CLA supplemented cows were significantly higher compared to the c9,t11- and t10,c12-CLA con-tent in milk of cows of the control group.
Peterson et al. [3] found that t10,c12-CLA was also transferred to milk fat and that the milk fat content of
t10,c12-CLA are curvilinearly related to reduced milk fat yield, according to de Veth et al. [15]. However in our study we could not demonstrate such a decrease of milk fat yield. It can be speculated that at the onset of lacta-tion the essential cellular signaling systems are attenu-ated such that t10,c12-CLA is unable to elicit the coordinated reduction in the expression of genes for key lipogenic enzymes.
Furthermore in milk of CLA supplemented cows, con-tents of short chain (< C 10) and middle chain FA (C 10 - C 16) were reduced and the amount of long chain FA (> C 16) was increased. These results go in line with previous results from studies conducted during early and mid lactation [8,9,16,17].
Results from the present study with transition cows are partially similar to those observed after administra-tion of CLA to cows in established lactaadministra-tion. In estab-lished lactation milk yield and milk protein content were relatively unaffected by abomasal administration of CLA or CLA feeding [3,11,13]. In our study CLA sup-plementation did not affect milk yield and milk protein content.
Bernal-Santos et al. [8] presented the first study in which rumen-protected CLA was fed during the prepar-tum period. Supplementation had no effect on measured performance variables and plasma metabolites. In our study, CLA supplementation had no effects on concen-trations of TB, glucose, NEFA and BHB in blood serum. Table 5 Means ± SD for blood serum metabolites1during and after the treatment period2.
Control (n = 5) CLA (n = 5)
1 - 28 DIM 29 - 56 DIM 1 - 28 DIM 29 - 56 DIM
Variable mean SD mean SD mean SD mean SD
TB3,
μmol/L 7.01 4.52 3.58 0.74 4.51 0.73 3.10 0.70
Glucose, mmol/L 3.40 0.11 3.53 0.06 3.47 0.28 3.53 0.19
NEFA4,μmol/L 483 174 165 105 378 119 152 61.1
BHB5, mmol/L 0.54 0.14 0.22 0.08 0.49 0.28 0.39 0.04
1
Jugular blood samples were collected at week 0, 1, 2, 4, 6, 8. Values from week 0, 1, 2, 4 were calculated for 1 - 28 DIM, values from week 6 and 8 were calculated for 29 - 56 DIM.
2
CLA supplemented timeframe: d 1 until d 28 of lactation; five primiparous cows received a special supplement including rumen-protected CLA (10 gc9,t11-CLA/ day andt10,c12-CLA/day).
3
total bilirubin.
4
non-esterified fatty acids.
5
Table 6 Means ± SD for fatty acid composition of milk fat from cows receivedc9,t11- andt10,c12-CLA and for the control group, during treatment period1and post-treatment.
Control (N = 5) CLA (N = 5) P-value P-value P-value P-value
1 - 28 DIM 29 - 56 DIM 1 - 28 DIM 29 - 56 DIM Control CLA Control vs.
CLA
Control vs. CLA
mean SD mean SD mean SD mean SD 1-28 vs.
29-56
1-28 vs. 29-56
1-28 29-56
Fatty acid, g/100 g fat
4:0 1.40 0.10 1.20 0.12 1.38 0.11 1.24 0.04
6:0 1.14 0.06 1.18 0.06 1.13 0.13 1.23 0.02
8:0 0.84 0.03 0.94 0.02 0.86 0.10 1.01 0.04 0.003 0.038
10:0 1.91 0.12 2.39 0.20 1.95 0.20 2.55 0.13 0.011 0.012
10:1 0.15 0.03 0.25 0.02 0.15 0.02 0.28 0.03 0.09 0.003
11:0 0.05 0.02 0.08 0.08 0.04 0.01 0.07 0.01 0.013
12:0 2.90 0.18 3.79 0.44 2.87 0.41 4.04 0.30 0.013 0.016
12:1cis-9 0.04 0.01 0.07 0.01 0.03 0.01 0.08 0.01 0.007 0.002
iso-13:0 0.04 0.01 0.08 0.01 0.04 0.01 0.09 0.02 0.008 0.03
13:0 0.09 0.02 0.14 0.09 0.07 0.01 0.12 0.02 0.013
iso-14:0 0.09 0.03 0.11 0.04 0.08 0.00 0.10 0.02
14:0 9.14 0.42 11.35 0.45 8.84 0.39 11.27 0.37 0.001 0.001
14:1cis-9 0.57 0.08 0.86 0.13 0.57 0.05 0.88 0.13 0.013 0.0021
iso-15:0 0.10 0.00 0.11 0.00 0.09 0.01 0.10 0.01 0.012
anteiso-15:0 0.27 0.04 0.36 0.04 0.26 0.03 0.36 0.04 0.034 0.023
15:0 0.85 0.10 1.15 0.48 0.70 0.09 1.01 0.07 0.01
iso-16:0 0.23 0.03 0.23 0.07 0.21 0.02 0.22 0.01
16:0 26.17 0.82 27.90 0.95 25.74 1.57 26.62 0.95 0.05
16:1trans-9 0.17 0.00 0.17 0.01 0.17 0.01 0.16 0.01 0.04
16:1cis-9 1.48 0.04 1.40 0.06 1.65 0.12 1.38 0.13
iso-17:0 0.36 0.02 0.42 0.04 0.36 0.04 0.43 0.03
anteiso-17:0 0.43 0.04 0.45 0.04 0.42 0.05 0.44 0.04
17:0 0.71 0.05 0.63 0.11 0.64 0.06 0.58 0.01
17:1cis-9 0.32 0.02 0.27 0.02 0.34 0.04 0.24 0.02 0.014 0.016
iso-18:0 0.09 0.01 0.07 0.01 0.09 0.01 0.06 0.00 0.011
18:0 11.84 0.44 9.52 0.46 11.59 0.54 10.13 0.29 0.001 0.014
18:1trans-9 0.59 0.12 0.61 0.03 0.63 0.03 0.66 0.05 18:1trans-10 0.30 0.02 0.36 0.05 0.31 0.05 0.39 0.05 18:1trans-11 1.48 0.43 1.29 0.13 1.49 0.11 1.29 0.08
18:1cis-9 25.78 1.26 22.19 0.94 26.45 1.48 22.44 0.17 0.009 0.01
18:1cis-11 1.09 0.06 1.01 0.17 1.10 0.11 1.00 0.04
18:1cis-12 0.24 0.04 0.27 0.02 0.27 0.05 0.28 0.02
18:1cis-13 0.11 0.02 0.07 0.01 0.11 0.05 0.08 0.03 0.03
18:2trans-9,trans-12 1.83 0.08 1.82 0.10 2.11 0.20 1.97 0.13 0.048 18:2cis-9,trans-11 0.64 0.10 0.69 0.05 0.73 0.04 0.68 0.07
18:2trans-10,cis-12 0.00 0.00 0.00 0.00 0.02 0.01 0.00 0.00 0.008 0.002 18:2trans-9,trans-11 0.02 0.01 0.01 0.00 0.03 0.00 0.01 0.00 0.002
18:3cis-9,cis-12,cis-15 0.43 0.03 0.40 0.06 0.43 0.01 0.36 0.01 0.003
19:0 0.06 0.00 0.05 0.00 0.04 0.01 0.05 0.01 0.015
20:0 0.14 0.01 0.13 0.00 0.13 0.00 0.14 0.00 0.004 0.029 0.027
20:1cis-11 0.11 0.00 0.11 0.02 0.10 0.01 0.10 0.02
20:2cis-11,cis-14 0.03 0.01 0.03 0.01 0.05 0.01 0.05 0.03
21:0 0.02 0.00 0.02 0.00 0.01 0.00 0.02 0.00 0.026 0.004
20:3cis-8,cis-11,cis-14 0.08 0.01 0.11 0.01 0.10 0.01 0.13 0.00 0.014 0.008 20:4cis-5,cis-8,cis-11,cis-14 0.13 0.03 0.12 0.01 0.11 0.01 0.10 0.02
Because of sustained lipomobilization the metabolic situation could not be improved by feeding CLA. Com-parable results were obtained by Perfield et al. [7]. In addition, CLA supplementation had no effects on hepa-tic mRNA levels of PPARa, PPARg, SREBP1 and TNFa. Comparable studies, in which effects of CLA supple-mentation on hepatic gene expression in dairy cows were measured, do not exist to our knowledge. Previous studies in rodents revealed effects of c9,t11- and t10,
c12-CLA on gene expression of fatty acid synthesis, fatty acid oxidation and drug detoxification-associated enzymes in liver tissue [18-20].
Our results go in line with previous results stating that
t10,c12-CLA affects primarily the de novo synthesis of FA in the alveolar epithelial cells of the mammary gland but does not inhibit peripheral lipomobilization. The
transition period is associated with an increased mobili-zation of body fat reserves, which results in an increased mammary uptake of circulating NEFA and their use to synthesize milk fat triglycerides [13]. This is one expla-nation of the considerably higher fat percentage of bovine milk in the first weeks of lactation when precur-sors for milk synthesis are not completely available from feed [1].
Obviously, during the first weeks of lactation, the milk fat depressing effects oft10,c12-CLA intake are less pro-nounced compared to mid or late lactation. This may be explained by a low contribution of long-chain FAs origi-nating from lipomobilization to milk fat in mid lactation while the proportion oft10,c12-CLA-dependendde novo
synthesized FAs is high compared to the first weeks of lactation. The study did not provide evidence that CLA Table 7ΔCq1-values (mean ± SD) of hepatic mRNA expression of the genes PPARa2, PPARg3, SREBP14, TNFa5in CLA supplemented cows vs. control group before (week -1), during (week 2 and 4) and after (week 8) treatment6.
Control (n = 5) CLA (n = 5)
week -1 week 2 week 4 week 8 week -1 week 2 week 4 week 8
mean SD mean SD mean SD mean SD mean SD mean SD mean SD mean SD
ΔPPARa 1.5 0.3 1.4 0.2 1.9 0.3 1.7 0.5 2.0 0.1 1.4 0.3 1.9 0.7 2.0 0.5
ΔPPARg 7.8 0.8 9.6 2.3 9.8 2.4 9.4 0.8 9.1 0.3 8.6 0.2 9.2 0.7 9.2 0.2
ΔSREBP1 2.3 1.6 4.0 2.9 4.0 1.8 4.2 1.6 3.0 0.2 3.7 0.7 4.1 1.2 3.1 0.5
ΔTNFa 9.3 0.6 8.9 0.4 9.4 0.7 9.4 1.2 8.5 0.4 8.0 1.1 8.5 1.5 8.4 0.4
1
ΔCq-values were calculated asΔCq = Cqtarget gene- meanCqrefence genes 2
peroxisome proliferator-activated receptor-alpha.
3
peroxisome proliferator-activated receptor-gamma.
4
sterol regulatory element-binding protein-1.
5
tumor necrosis factor-alpha.
6
CLA supplemented timeframe: day 1 till day 28 of lactation; five primiparous cows received a special supplement including rumen-protected CLA (10 gc9,t 11-CLA/day andt10,c12-CLA/day).
Table 6: Means ± SD for fatty acid composition of milk fat from cows receivedc9,t11- andt10,c12-CLA and for the control group, during treatment period1and post-treatment.(Continued)
20:5cis-5.cis-8,cis-11,cis-14,
cis-17
0.03 0.01 0.02 0.00 0.02 0.00 0.02 0.00 0.036
24:0 0.03 0.01 0.02 0.00 0.01 0.00 0.02 0.01 0.005
22:5cis-7,cis-10,cis-13,cis -16,cis-19
0.12 0.02 0.10 0.01 0.09 0.01 0.08 0.01
Other 5.36 5.43 5.35 5.44
Summation, g/100 g fat
SFA2 58.9 0.87 62.3 1.01 57.5 1.95 61.9 0.07 0.005 0.018
MUFA3 29.9 1.23 26.5 0.87 30.8 1.67 26.7 0.27 0.01 0.014
PUFA4 0.39 0.06 0.38 0.03 0.39 0.01 0.38 0.03
tFA5 4.37 0.58 4.25 0.17 4.71 0.34 4.46 0.21
CLA6 1.12 0.07 1.14 0.10 1.20 0.05 1.08 0.06 0.046
1
CLA supplemented timeframe: d 1 till d 28 of lactation; five primiparous cows received a special supplement including rumen-protected CLA (10 gc9,t11-CLA/ day andt10,c12-CLA/day). Post-treatment timeframe: 29 - 56 DIM.
2
saturated fatty acids
3
monounsaturated fatty acids
4
polyunsaturated fatty acids
5
transfatty acids
6
affected substrate partitioning in the body of the cows which may be explained by the comparatively small amounts fed compared to rodent studies.
The present study is the first describing supplemen-tion of primiparous cows with CLA during the first four weeks of lactation. However, due to the limited number of animals per treatment group, the small amount of supplemented CLA and the restricted supplementation period during early lactation, it is difficult to make any definitive conclusions about the metabolic benefits of CLA supplementation.
Conclusions
Supplementation of c9,t11- andt10,c12-CLA during the first four weeks of lactation resulted in an increase of these specific CLA isomers provided during treatment. Therefore all the CLA isomers were taken up by the mammary gland and incorporated into milk fat. During the first four weeks of lactation, however, CLA supple-mentation did not affect milk yield, milk composition, blood serum metabolites and gene expression in liver of primiparous cows.
Acknowledgements
The authors express their appreciation to Bewital (Suedlohn-Oeding, Germany) for donating the CLA supplement and to Trouw Nutrition (Burgheim, Germany) for donating the concentrate supplement. Furthermore, the fundings of Bayerisches Staatsministerium für Ernährung, Landwirtschaft und Forsten and Sachsenmilch AG (Leppersdorf, Germany) are gratefully acknowledged.
Author details
1
Physiology Weihenstephan, Technische Universitaet Muenchen, Weihenstephaner Berg 3, Freising-Weihenstephan, Germany.2Bioanalytik,
Technische Universitaet Muenchen, Versuchsstation Thalhausen, Freising-Weihenstephan, Germany.3Clinic for Cattle, University of Veterinary
Medicine, Bischofsholer Damm 15, Hannover, Germany.
Authors’contributions
TS was responsible for the CLA feeding as well as for all sample obtention, fatty acid composition analysis, mRNA extraction from liver tissue, RT-qPCR performance, and statistical analysis of the results. GS assisted in blood sampling. HK briefed TS in working with the HPLC. MK created the experimental design and supervised the study. SW performed liver biopsies. HHDM was the project leader and supervised the study. All authors read and approved the final manuscript.
Competing interests
The authors declare that they have no competing interests.
Received: 30 July 2009
Accepted: 18 February 2010 Published: 18 February 2010
References
1. Bauman DE, Griinari JM:Nutritional regulation of milk fat synthesis.
Annual Rev Nutr2003,23:203-227.
2. Drackley J:Biology of dairy cows during the transition period: the final frontier?.J Dairy Sci1999,82:2259-2273.
3. Peterson DG, Baumgard LH, Bauman DE:Short communication: Milk fat response to low doses of trans-10, cis-12 conjugated linoleic acid (CLA).
J Dairy Sci2002,85:1764-1766.
4. Jandrassik L, Grof P:Quantitative determination of total and direct bilirubin in serum and plasma.Biochem Z1938,297:81-89.
5. Drackley J, Donkin S, Reynolds C:Major advances in fundamental dairy cattle nutrition.J Dairy Sci2006,89:1324-1336.
6. Giesy J, McGuire M, Shafii B, Hanson T:Effect of dose of calcium salts of conjugated lineoleic acid (CLA) on percentage and fatty acid content of milk fat in midlactation holstein cows.J Dairy Sci2002,85:2023-2029. 7. Perfield JW, Bernal-Santos G, Overton TR, Bauman DE:Effects of dietary
supplementation of rumen-protected conjugated linoleic (CLA) in dairy cows during established lactation.J Dairy Sci2002,85:2609-2617. 8. Bernal-Santos G, Perfield JW, Barbano DM, Bauman DE, Overton TR:
Production responses of dairy cows to dietary supplementation with conjugated linoleic acid (CLA) during the transition period and early lactation.J Dairy Sci2003,86:3218-3228.
9. Odens L, Burgos R, Innocenti M, VanBaale M, Baumgard L:Effects of varying doses of supplemental conjugated linoleic acid on production and energetic variables during the transition period.J Dairy Sci2007, 90:293-305.
10. Chouinard P, Corneau L, Saebo A, Bauman DE:Milk yield and composition during abomasal infusion of conjugated lineoleic acid in dairy cows.J Dairy Sci1999,82:2737-2745.
11. Baumgard LH, Sangster JK, Bauman DE:Milk fat synthesis in dairy cows is progressively reduced by increasing supplemental amounts of trans-10, cis-12 conjugated linoleic acid (CLA).J Nutr2001,131:1764-1769. 12. Bell J, Kennelly J:Short communication: postruminal infusion of
conjugated linoleic acid negatively impacts milk synthesis in holstein cows.J Dairy Sci2003,86:1321-1324.
13. Peterson DG, Matitashvili E, Bauman DE:Diet-induced milk fat depression in dairy cows results increased trans-10, cis-12 CLA in milk fat and coordinate suppression of mRNA abundance for mammary enzymes involved in milk fat synthesis.J Nutr2003,133:3098-3102.
14. Viswanadha S, Giesy J, Hanson T, McGuire M:Dose response of milk fat to intravenous administration of the trans-10, cis-12 isomer of conjugated linoleic acid.J Dairy Sci2003,86:3229-3236.
15. De Veth MJ, Griinari JM, Pfeiffer AM, Bauman DE:Effect of CLA on milk fat synthesis in dairy cows: Comparison of inhibition by methyl esters and free fatty acids, and relationships among studies.Lipids2004,39:365-372. 16. Moore C, Hafliger H, Mendivil O, Sanders S, Bauman DE, Baumgard L:
Increasing amounts of conjugated linoleic acid (CLA) progressively reduces milk fat synthesis immediately postpartum.J Dairy Sci2004, 87:1886-1895.
17. Castaneda-Gutiérrez E, Overton T, Butler W, Bauman DE:Dietary supplements of two doses of calcium salts of conjugated linoleic acid during the transition period and early lactation.J Dairy Sci2005, 88:1078-1089.
18. Rasooly R, Kelley DS, Greg J, Mackey BE:Dietary trans 10, cis 12-conjugated linoleic acid reduces the expression of fatty acid oxidation and drug detoxification enzymes in mouse liver.J Nutr2007,97:58-66. 19. Javadi M, Beynen AC, Hovenier R, Lankhorst A, Lemmens AG, Terpstra AH,
Geelen MJ:Prolonged feeding of mice with conjugated linoleic acid increases hepatic fatty acid synthesis relative to oxidation.J Nutr Biochem2004,15:680-687.
20. Takahashi Y, Kushiro M, Shinohara K, Ide T:Activity and mRNA levels of enzymes involved in hepatic fatty acid synthesis and oxidation in mice fed conjugated linoleic acid.Biochim Biophys Acta2003,1631:265-273.
doi:10.1186/1751-0147-52-16