www.earth-surf-dynam.net/4/549/2016/ doi:10.5194/esurf-4-549-2016
© Author(s) 2016. CC Attribution 3.0 License.
A reduced-complexity model for sediment transport and
step-pool morphology
Matteo Saletti1, Peter Molnar1, Marwan A. Hassan2, and Paolo Burlando1 1Institute of Environmental Engineering, ETH Zurich, Zurich, Switzerland 2Department of Geography, The University of British Columbia, Vancouver, BC, Canada
Correspondence to:Matteo Saletti (saletti@ifu.baug.ethz.ch)
Received: 2 March 2016 – Published in Earth Surf. Dynam. Discuss.: 7 March 2016 Revised: 10 June 2016 – Accepted: 29 June 2016 – Published: 20 July 2016
Abstract. A new particle-based reduced-complexity model to simulate sediment transport and channel
mor-phology in steep streams in presented. The model CAST (Cellular Automaton Sediment Transport) contains phenomenological parameterizations, deterministic or stochastic, of sediment supply, bed load transport, and particle entrainment and deposition in a cellular-automaton space with uniform grain size. The model reproduces a realistic bed morphology and typical fluctuations in transport rates observed in steep channels. Particle hop dis-tances, from entrainment to deposition, are well fitted by exponential distributions, in agreement with field data. The effect of stochasticity in both the entrainment and the input rate is shown. A stochastic parameterization of the entrainment is essential to create and maintain a realistic channel morphology, while the intermittent trans-port of grains in CAST shreds the input signal and its stochastic variability. A jamming routine has been added to CAST to simulate the grain–grain and grain–bed interactions that lead to particle jamming and step formation in a step-pool stream. The results show that jamming is effective in generating steps in unsteady conditions. Steps are created during high-flow periods and they survive during low flows only in sediment-starved conditions, in agreement with the jammed-state hypothesis of Church and Zimmermann (2007). Reduced-complexity models like CAST give new insights into the dynamics of complex phenomena such as sediment transport and bedform stability and are a useful complement to fully physically based models to test research hypotheses.
1 Introduction
The morphodynamics of steep gravel-bed rivers is charac-terized by complex feedbacks between sediment supply and storage (e.g., Hassan et al., 2008; Hassan and Zimmermann, 2012; Recking, 2012; Recking et al., 2012), bed load trans-port and flow resistance (e.g., Yager et al., 2007; Reck-ing et al., 2008) and a rather stable bed morphology with a variety of bed surface structures (see reviews by Comiti and Mao, 2012; Rickenmann, 2012; Church and Fergu-son, 2015). The traditional sediment transport capacity ap-proach (Wainwright et al., 2015), which has been developed for low-land streams, performs poorly in steep fluvial sys-tems. Among other reasons, in steep channels the thresh-old of motion varies with slope, local bed structures, and antecedent flood events (e.g., Lamb et al., 2008; Turowski
et al., 2011; Scheingross et al., 2013; Prancevic and Lamb, 2015); a power-law relation between fluid shear stress and sediment transport yields orders of magnitude differences between measurements and predictions (e.g., Rickenmann, 2001); and the presence of macro-roughness elements (such as boulders and log jams), whose size is comparable with the water depth, makes calculations of flow resistance extremely complex (Yager et al., 2007; Schneider et al., 2015).
order to understand under which conditions they are formed, remain stable, and are eventually destabilized (e.g., Abra-hams et al., 1995; Curran, 2007; Zimmermann et al., 2010). This topic is still an open issue and, despite observations of a certain degree of regularity in step-pool geometry (e.g., Char-trand et al., 2011), it has been recognized both in the field (e.g., Zimmermann and Church, 2001; Molnar et al., 2010) and with lab experiments (e.g., Curran and Wilcock, 2005; Zimmermann et al., 2010) that there is no single mechanism behind step formation and collapse (Curran, 2007). In fact, we are of the opinion that step formation and stability should be treated as stochastic processes, which result in largely ran-dom locations of step-forming boulders usually referred to as keystones (Church and Zimmermann, 2007; Zimmermann et al., 2010).
A hypothesis on step stability was proposed by Church and Zimmermann (2007) and tested experimentally by Zimmer-mann et al. (2010). The authors suggested a similarity be-tween step formation and granular phenomena by postulat-ing that steps are inherently more stable than predicted by the Shields diagram because they are arranged in a jammed state, which occurs in granular flows (for a review on the jamming phenomenon see Liu and Nagel, 2010). They proposed a dia-gram where the likelihood of finding stable steps in a channel is dependent on three parameters: (1) the jamming ratio (the ratio between the channel width W and thed84 of the sur-face), (2) the transport stage (the ratio between the applied shear stress τ and the critical shear stressτcr), and (3) the sediment concentration (the ratio between sediment supply
QS and water discharge Q). So far this theory has been tested against lab experiments and field data (Zimmermann et al., 2010), but to our knowledge step formation and col-lapse have not yet been explicitly modeled. Understanding the conditions under which step-pool sequences are stable is of major practical importance because step collapses and consequent boulder mobilization can severely impact human infrastructures causing natural hazards (e.g., Badoux et al., 2014). Moreover, artificial step structures are often built in alpine rivers as energy dissipators and for erosion control; therefore, their stability needs to be carefully assessed.
Physically based modeling of flow and sediment trans-port in steep mountain streams in mobile bed conditions is impractical because (a) the flow field over the rough bed is very complex, (b) single-grain mobility is impossi-ble to solve, and (c) long-term simulations are required to develop a dynamically changing channel bed. An alterna-tive to fully physically based modeling is that of reduced-complexity models. Instead of solving differential equations of flow and sediment transport, reduced-complexity models formulate physically meaningful local flow–grain interaction rules with very few parameters in a cellular automaton space. The reduced-complexity framework has also been applied successfully in fluvial geomorphology (Nicholas, 2005) as a learning tool to gain new insight into the temporal and spatial dynamics of complex systems in general
(Golden-feld and Kadanoff, 1999; Paola and Leeder, 2011; Rozier and Narteau, 2014; Tucker et al., 2015). Since the classi-cal cellular model of Murray and Paola (1994), which effec-tively captured the main patterns of river braiding, reduced-complexity models have been used to describe geomorphic phenomena, such as riverbank failure (Fonstad and Marcus, 2003), bedrock cover (Hodge and Hoey, 2012), river avul-sion (Jerolmack and Paola, 2007), sand dunes (Narteau et al., 2009), river deltas (Seybold et al., 2009; Liang et al., 2015), patterns of erosion-sedimentation (Crave and Davy, 2001; Chiari and Scheidl, 2015), transport in gravel-bed rivers (MacVicar et al., 2006), and landscape evolution (Coulthard and Wiel, 2007; Van De Wiel and Coulthard, 2010).
In this paper we present a new reduced-complexity stochastic model for step-pool streams based on grain–grain and grain–bed interactions: CAST (Cellular Automaton Sed-iment Transport). CAST simulates a generic fluvial channel on a cellular-automaton domain, where the bed is formed by an arrangement of particles like in a sandpile model (e.g., Bak et al., 1988; Kadanoff et al., 1989). The basic processes of bed load transport, particle entrainment, and deposition are treated at the grain scale, taking advantage of analogies between bed load transport and granular phenomena (e.g., Frey and Church, 2009, 2011; Houssais et al., 2015). There are two main reasons for the stochastic framework of CAST. First, the goal of the model is not to predict deterministically the morphology of a specific river reach but rather to cap-ture feedbacks related to its dynamics and to test research hypotheses on step formation and stability. Second, both bed stability (Zimmermann et al., 2010) and bed load transport (Einstein, 1937, 1950) have been recognized to be stochastic processes, and recent approaches to sediment transport have successfully followed this framework (e.g., Turowski, 2010; Furbish et al., 2012; Heyman et al., 2013; Ancey and Hey-mann, 2014; Armanini et al., 2015).
2 Model rationale
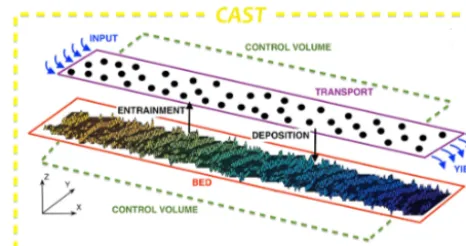
CAST operates in 2-D cellular-automaton space, which is a rectangular grid of constant length (X) and width (Y) corre-sponding to a generic river reach (see Fig. 1). The domain is discretized such that all the dimensional quantities are ex-pressed as multipliers of particle size d. The model devel-oped in this paper works with uniform-size particles, sod is also equal to the dimension of a cell. For example, a simu-lation domain havingX=300d andY =20d represents a river reach with an average length equal to 300 median di-ameters and an average width equal to 20 median didi-ameters. Particles in the model domain can be either on the bed or in motion, i.e., part of the bed matrix or of the transport matrix (Fig. 1). The bed matrix Z is composed of particles piled one above the other like in a sandpile model (e.g., Bak et al., 1988). The local bed elevation at a generic location (i, j), wherei[1:X]is the index for the longitudinal coordinate and
j[1:Y]for the transversal coordinate, is given as the total number of particlesZi,j. Particles can leave the bed matrix as a result of entrainment and can enter the bed matrix as a result of deposition. In the case of entrainment and deposition the local value of elevation,Zi,j is reduced or increased by one grain unitd, respectively:
Zi,j(t+1)=Zi,j(t)±d. (1)
Particles in motion are allocated to the transport matrixTR, which consists of two layers, and they move as bed load – i.e., they are in contact with the bed and interact with it. They also interact with each other by collisions. Particles move with a constant velocity, one cross section downstream for every time step. In this way particle velocityvp, particle sized, and time step1tare connected:
vp=
d
1t. (2)
Although1tis a unitless time in simulation, Eq. (2) together with the grain and domain size gives it a physical meaning connected to particle velocity.
Particles enter the system with a specified input rate IR, which is the number of particles entering the system at the upstream boundary for every time step, and they leave the system as output rate OR at the downstream boundary. In analyzing the spatial output of the model we consider only a reduced part of the domain, which we will hereafter call the control volume, excluding the first 10 cross sections up-stream and the last 10 downup-stream to avoid the influence of the upstream and downstream boundary conditions (see next sections).
2.1 Model components 2.1.1 Sediment input
The first parameter of CAST is the particle input rateIRor the specific input rate iR, defined as the total input rateIR
Figure 1.Diagram of the model. The space is discretized in a longi-tudinal dimensionXand a transversal dimensionY. Bed elevation is given by the coordinateZ. Particles can be either in the bed ma-trix or in the transport mama-trix. They can enter the transport mama-trix as sediment input from the upper boundary or by entrainment from the bed, while they can leave the transport matrix as sediment out-put or by deposition on the bed. Sediment is inout-put at the upstream boundary and simulated as sediment yield leaving the downstream boundary.
divided by the channel widthY;iRcan assume values in the interval[0:1]because no more than one particle can enter a single cell at the upstream boundary in1t. The supply of particles to the system can be treated as constant input by specifying a value ofiRfor the entire simulation or as vari-able random input by specifying a mean valueiRwith a tem-porally variable termiR0(t) uniformly distributed aroundiR. In CAST,iRrepresents a generic amount of sediment which is delivered to the channel from all the possible sources (al-luvial transport, colluvium activity, bank erosion, etc.) rather than a specific transport rate in a given cross section. The ac-tual input to the system can be considered to be the transport rate measured in the first cross section of the control volume.
2.1.2 Sediment transport
Particles are transported as bed load along the channel with a constant velocity (see Eq. 2). A particle can join the trans-port matrixTRwhen it enters the system as input or once it has been entrained from the bed. A particle can also leave the transport matrixTRwhen it moves beyond the last cross section, becoming part of the sediment outputOR, or when it deposits on the bed surface. The maximum number of par-ticles being transported from one cross section to the next is equal to 2Y, i.e., 2 times the channel width, because theTR
matrix has two layers.
is not sensitive to lateral dispersion, at least in the parameter space we have tested. Along its path, a particle can collide with another particle in transport or collide with one of the two boundaries (left and right banks). In both cases the colli-sion leads to the loss of momentum and cessation of motion and the particle deposits on the bed (see Sect. 2.1.4). When a particle deposits on the bed, it changes the local roughness but without directly displacing other particles – i.e., CAST does not account for collective entrainment as described by Ancey and Heymann (2014).
Sediment flux in the model, qS, is computed at the total number of particles inTRin the control volume divided by the domain size, i.e.,Y·(X−20). This specific rateqS(t) is computed for every time step.
2.1.3 Particle entrainment
The key process in CAST is the particle entrainment which is considered to be dependent on the local bed topography and on the flow conditions. The degree of exposure of particles on the bed has been shown to strongly influence sediment entrainment and transport especially in steep streams (e.g., Kirchner et al., 1990; Malmaeus and Hassan, 2002; Yager et al., 2012; Prancevic and Lamb, 2015). Moreover, many feedbacks exist between bed roughness, flow resistance, and particle mobility and transport (e.g., Recking et al., 2008; Wilcox et al., 2011), which makes it reasonable to consider particle entrainment a stochastic process.
The effect of local topography on entrainment is accounted for by calculating the local relative exposureRof a particle on the bed. For a generic cell (i, j) in the domain, the relative exposureRi,j is given by the difference between the eleva-tion of the cellZi,j and the average elevation of the neigh-boring cells along the flow direction (the 2 in the same cross section and the 3 downstream):
Ri,j=Zi,j−
Zi,j−1+Zi,j+1+Zi+1,j−1+Zi+1,j+Zi+1,j+1
5 . (3)
In the case of a cell located close to one of the banks (i.e., whenj=1 orj =Y),Ri,j is evaluated considering the cell in the same cross section and the two cells downstream.
Entrainment is based onRexceeding a thresholdR∗. The probability of entrainmentpEis then defined aspE=Pr[R≥
R∗]. CAST can model the entrainment process as determin-istic or stochastic (see Fig. 2). In the determindetermin-istic case, the threshold is a constantR∗=Eand the probability of entrain-ment is
pE=Pr[R≥E] =
0 R < E
1 R≥E. (4)
In the stochastic case, the threshold R∗ is modeled as a random variable with a logistic probability density function
R* E
f(R
*)
Threshold R*
Deterministic model Stochastic model (S=E/10) Stochastic model (S=E/4)
R
E pE
0 0.5 1
Entrainment probability p
E (b)
(a)
Figure 2.Deterministic and stochastic parameterization of entrain-ment in CAST.(a)The probability density function of the threshold
R∗.(b)Entrainment probability as a function of relative exposure
R.
f(R∗) and a cumulative distribution functionF(R∗):
f(R∗)= e
−R∗ −SE
Sh1+e−R∗ −SE i2
F(R∗)= 1
1+e−R∗ −SE .
(5)
The distribution has a meanµR∗=Eand a varianceσ2
R∗=
π2S2
3 . In this way the entrainment probability pE of a cell with relative exposure R depends on two parameters: the mean value of the threshold distributionEand the variability in the thresholdR∗proportional toS:
pE=Pr[R≥R∗] =F(R)= 1
1+e−R−SE
. (6)
Figure 2 shows the deterministic and stochastic parameter-izations of entrainment.
Conceptually, the value ofE is inversely related to the magnitude of the flow. Large E means low probability of entrainment, typical of low-flow conditions and low shear stress, while smallEmeans highpEfor the same relative ex-posure values and thus high-flow conditions and high shear stress.
2.1.4 Particle deposition
Particles in transport (i.e., belonging to theTRmatrix) can be deposited in three cases: (a) when they collide with an-other particle in motion – in this case both particles involved in the collision events are deposited, each one in its present location; (b) when they collide with one of the two channel banks; and (c) because of their interaction with the bed sur-face.
The relation between particle deposition and bed surface is modeled using the relative exposure matrixR: particles in motion deposit in areas of local depressions, i.e., cells with
with a threshold function having a fixed value ofD= −0.5 below which the probability of deposition pdep=1, on the one hand, to avoid redundant parameters poorly connected to physical processes and, on the other hand, to shift the variability in sediment transport to the entrainment process which has a more straightforward relation with hydraulics and local channel bed topography. Cases (a) and (b) are much less common than (c) since they both require lateral move-ment and the presence of an obstacle (i.e., another particle or the channel banks).
2.1.5 Boundary and initial conditions
CAST needs one boundary condition for the lateral banks and one for the downstream boundary at the channel outlet. The boundary condition for the banks is deposition when a moving particle in theTRlayer collides with one of the two lateral boundaries. The boundary condition for the last cross section at the downstream boundary is given by fixing its el-evation Z(X, j)=0. This is equivalent to a control section with a fixed elevation (e.g., a check dam or a weir) some-where downstream. To minimize the effect of this boundary condition on the model outcomes, all spatial variables are computed only over the control volume, which is a reduced portion of the entire channel (see Fig. 1).
In order to avoid long simulation times required to fill the channel with particles, we start every simulation from an ini-tial slope, slightly less than the equilibrium slope, with ran-dom noise. The model in not sensitive to this initial condi-tion – i.e., the final equilibrium slope is only a funccondi-tion of the chosen set of parameters (mainly the input rateiRand the entrainment parameterE). Different initial conditions deter-mine how long the system needs to reach this equilibrium state.
2.2 Rough bed and jamming in CAST
CAST operates in two modes, with and without dy-namic jamming. The rough-bed model without jamming (CASTRBM) simulates a generic rough-bed channel where processes of transport, entrainment and deposition are con-sidered regardless of any additional granular effect (except for particle collisions and deposition after collisions with the channel banks). The jamming model (CASTJM) simu-lates explicitly the process of jamming (blocking) when the density of particles transported in the same cross section ex-ceeds a threshold. In this case particle interactions lead to deposition of all grains in that cross section on the bed. This blocking process is considered permanent – i.e., the jammed particles are locked into channel-width-spanning structures which cannot be entrained anymore. In the same cross sec-tion, entrainment and deposition of other particles is still pos-sible, except for those grains that have been subjected to jam-ming. This parameterization aims to represent in a simpli-fied way the additional force chains that keep grains together
around keystones, as shown in the jammed-state hypothesis of Church and Zimmermann (2007). Intuitively and similarly to other phenomena where jamming is common (e.g., in hop-pers), we set up the jamming threshold equal to the channel widthY. In a one-grain-size model like CAST this implies that jamming is happening when the transport layer is full of particles (one entire cross section full of transported parti-cles).
For every time step, the computation sequence is as fol-lows. (1) Sediment input enters the system in the first cross section. (2) Particles in transport move one cell downstream (straight, left, or right) – if they collide with other particles or with one of the banks, then they deposit; otherwise, they remain in transport. In the case of CASTJMthe jamming con-dition is checked for every cross section. When the number of particles traveling in the same cross section exceeds the jamming threshold all grains are deposited on the bed and frozen. (3) For every particle in motion the condition for de-position is checked: if it is satisfied the particle leaves the transport matrix and is deposited on the bed. (4) For every particle in the bed matrix (except for those jammed in stage 2 and deposited in stage 3) the condition for entrainment is checked: if it is satisfied the particle leaves the bed matrix and joins the transport matrix. (5) The boundary condition at the channel outlet is applied.
3 Model setup: steady-state simulations
To set up the model, we have run a set of simulations us-ing CASTRBMwith (a) stochastic entrainment with constant
EandSparameters, and (b) constant specific input rateiR. The domain is Y =20d andX=300d. The domain size has been chosen not to represent or scale any specific river channel but rather to observe the features and test the hy-potheses we are interested in, at a reasonable computational cost. Simulations with a much larger scale (up to 2 orders of magnitude) have also been performed, and we observed no significant scale effect on the final outcome (see the Sup-plement). The simulations were run until a steady state was reached. This condition is achieved when for a given combi-nation ofiRandEthe channel slope does not change, i.e., the point at which the particle count (stored sediment volume) in the channel reaches a steady state and the sediment output is on average equal to the input. We explored the effect of different input ratesiRand the entrainment parametersEon the final bed structure. Moreover, since CAST is a stochastic model, we perform 20 realizations for every set of parame-ters to quantify stochastic variability. The set of parameparame-ters used in these steady-state simulations is shown in Table 1.
We analyzed the results in terms of the following:
Table 1.Values of the parameters used in the steady-state simula-tions.
Parameter Name Value(s)
Channel length X 300d
Channel width Y 20d
Simulation duration T 40 000
Deposition parameter D −0.5
Shape parameter S E5
Entrainment parameter E 1÷2
Specific input rate iR 0.2÷0.7
equilibrium (V constant in time on the average). It also indicates extreme sediment evacuation events.
– Specific sediment flux qS: the number of particles in motion per unit length and width in the control volume.
– Mean relative exposure hRi: the spatially averaged value of R of all the cells in the control volume do-main evaluated with Eq. (3) and standard deviation of the relative exposureσR.
– Particle hop distance HD: the step length of a single par-ticle from the point it is entrained (or enters the channel) to the point it is deposited or exits the channel.
3.1 Storage volume, sediment transport, bed morphology, and hop distances
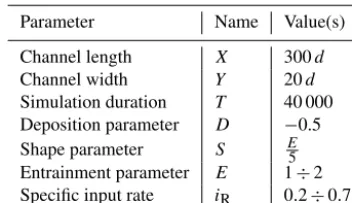
The main outputs of CASTRBM in a steady-state simulation (E=1.5;iR=0.5) at equilibrium are shown in Fig. 3. First, the storage volume (Fig. 3a) exhibits a dynamical equilib-rium: the volume oscillates, alternating phases of aggradation and degradation, because the stochastic parameterization of particle entrainment leads to a continuous exchange between the bed and the transport layer. Second, the times series of sediment transport (Fig. 3b) show that, even with a constant input rate, sediment transport fluctuates as observed in the field and in the lab (e.g., Recking et al., 2009; Saletti et al., 2015). Moreover, CASTRBM produces a realistic rough-bed morphology (Fig. 3c), with the mean R and standard devi-ation σR being a function of the input rate iR and the en-trainment parameter E. The input rate and the entrainment parameter also determine the final slope of the channel.
One of the advantages of reduced-complexity models like CAST is that it is possible to track the movement of every single particle in the system and thus to compute all particle step lengths (measured from entrainment to deposition). This is an important quantity which, since Einstein’s probabilistic theory on bed load transport (Einstein, 1937, 1950), needs to be reproduced by any reliable particle-based transport model. For the sake of clarity, following Furbish et al. (2012) we will use “particle hop distance” to refer to the distance traveled by a single particle from entrainment to deposition. For every
simulation we computed values of HD for all the particles and we find they follow an exponential distribution (Fig. 3d). In Fig. 4 we show for four different combinations ofiRand
Ethe probability density functions of HD and the exponen-tial fit. The good fit given by this distribution is in agreement with previous studies dealing with particle travel distances (e.g., Hill et al., 2010; Hassan et al., 2013; Schneider et al., 2014). Since no HD distribution is specified a priori in the model, the agreement shows that the phenomenological rules of particle entrainment, transport, and deposition of CAST are realistic. The values of HD obtained in our simulations are always much smaller than the channel lengthX(e.g., the maximum observed HD is less thanX/2); therefore, the sys-tem scale is not influencing our results. The relation between HD and the model parameters is explored in the next section.
3.2 Role of input rate and entrainment probability
With the steady-state simulations we explored the effect of changing input rate and entrainment parameter on the model outcomes. These two parameters are important because they can be linked to the jammed-state diagram parameters of Church and Zimmermann (2007). The input rateIRis related to the sediment concentrationQS
Q, which quantifies the effect of sediment supply on step stability. The entrainment param-eterEdetermines the entrainment probability and is directly related to the transport stage ττ
cr, which quantifies the effect
of the hydraulic forces on step stability.
Some of the simulations, characterized by low input rate and high entrainment probability (E=1, iR<0.4), yield what we call “washed-out” case – i.e., the bed matrix remains empty. This represents a limiting case where hydraulic forces are too high and sediment supply is too low to be able to sus-tain a fluvial channel. This constrained our parameter space to 27 simulations in which a channel was formed and main-tained around an equilibrium point.
The stochastic simulation of 20 realizations of each of the 27 parameter sets showed that the mean storage volumeV
and the mean relative exposurehRi converged to the same values. Also, the mean hop distanceshHDiand the standard deviations of the relative exposureσRdid not change signif-icantly.
Figure 3.CASTRBMsteady-state results of simulation withE=1.5 andiR=0.5.(a)Time series of storage volume: adjustment phases of
aggradation and degradation around the equilibrium condition. In the inset a closeup of the last 1000 time steps is shown.(b)Time series of sediment transport: even with a constant input rate (green line) the sediment flux fluctuates. Fluctuations are large if measured in a single cross section at the downstream end (blue line) but become smaller if averaged over the entire control volume of the channel (red line). (c)Bed elevation in the final configuration: the model produces a rough bed with particles having different exposuresR.(d)Probability density function of particle hop distances with an exponential distribution estimated over more than 2 million simulated particle paths.
HD
100 101 102
pdf(HD)
10-6 10-4 10-2 1
i
R=0.3 E=1.25
Exp fit Real pdf
HD
100 101 102
pdf(HD)
10-6 10-4 10-2 100
i R=0.7 E=1
Exp fit Real pdf
HD
100 101 102
pdf(HD)
10-6 10-4 10-2 100
iR=0.2 E=2
Exp fit Real pdf
HD
100 101 102
pdf(HD)
10-6 10-4 10-2 100
iR=0.7 E=2
Exp fit Real pdf
Figure 4.Probability density functions of simulated particles hop distances (red dots) fitted with an exponential distribution (blue line) for four different parameter sets.
Figure 5.Selected CASTRBMvariables as a function of input rate
and entrainment:(a)mean relative exposurehRi,(b)standard de-viation of relative exposureσR,(c)Hurst exponent of the specific
sediment fluxHqS, and(d)mean particle hop distancehHDi.
also obtained as a spatial average over the equilibrium phase for every time step.
fluctuations is captured by the Hurst exponent Hqs, whose
mean value for the steady-state simulations is shown in Fig. 5c. The values of HqS obtained in all the realizations
of all the simulations are consistent with those obtained from flume experiments by Saletti et al. (2015), being in the inter-val[0.5:1]. This identifies a long-memory regime which is stronger in the model (H→1) when the entrainment prob-ability is high (lowE) and the input rate is low.HqS shows
large variability in different realizations, although its mean value shows a clear trend with bothiRandE(Fig. 5c).
The mean particle hop distances (hHDi in Fig. 5d) dis-play two contrasting trends. For values ofE≤1.5 (high en-trainment probability) hHDi is decreasing consistently for increasing input ratesiRas a consequence of large particle activity (collisions between particles become very frequent). For larger values ofE(low entrainment probability) the max-imum ofhHDiis for average values ofiR(around 0.4). For
iR<0.4 there is a stronger interaction with the bed (which has largerhRiandσRfor larger E, as shown in Fig. 5a, b) and thus more likelihood of particle deposition, whereas, for largeiR, collisions again dominate hop distances because of large particle activity. In both cases this leads to a reduction ofhHDi.
3.3 CASTJM: particle jamming
The analysis above showed that CASTRBM is able to re-produce fluvial channels with a spatially variable rough bed and to capture basic and important phenomena, such as the variability in sediment flux and the exponential distribution of particle hop distances. However, to simulate the forma-tion and test the stability of steps, we need to take into ac-count the effect of particle jamming. This is a well-studied phenomenon in granular physics that has been advocated to be essential in the step stability process and considered through the jamming ratio (the ratio between the channel width and d84 of the surface) in the diagram proposed by Church and Zimmermann (2007). In our reduced-complexity model CASTJMwe account for the jamming effect by block-ing particles when local sediment concentration exceeds the jamming threshold and depositing them in permanent struc-tures on the bed.
Jamming simulations were run with the same parameter sets of the steady-state rough-bed model case. Three different situations occur:
1. When particle activity is too low (low sediment trans-port) the jamming threshold is rarely (often never) ex-ceeded.
2. When particle activity is too high (high sediment trans-port) jamming is occurring too often in time and space, and the storage volume of the system keeps increasing because of the large amount of particles depositing up-stream of the step structures. As a result an equilibrium channel is never reached.
3. When particle activity is in between the two previous situations, jamming is occurring at a rate which allows the formation of steps and maintains an approximately equilibrium channel.
The first situation represents the rough-bed case discussed previously. The second one represents a case which is very unlikely to happen in river systems where fluvial sediment transport is rarely going to exceed the jamming threshold and certainly not for very long periods of time (e.g., only during large flood events). For the purpose of this study we focus on the last situation where jamming is effectively creating steps. When particles are jammed and instantly deposited, they trigger a deposition process which is propagating up-stream, since the values of relative exposureR will be im-mediately reduced. This represents what happens in natural step-pool systems, where steps are created, among other fac-tors, by deposition and clustering of sediment around large boulders called keystones, and deposition between steps con-tinuously changes the channel (e.g., Molnar et al., 2010).
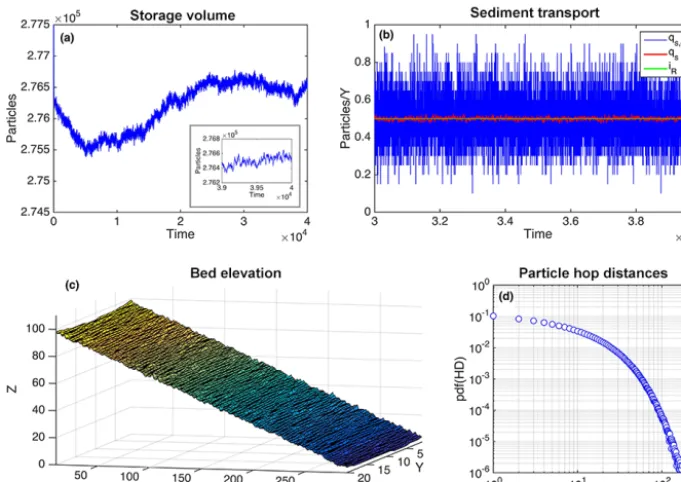
We show the effect of adding jamming to the model by comparing simulations having the same parameter sets and same initial conditions (iR=0.5 and E=1.25) in CASTRBM and CASTJM runs. The cumulative number of jammed cross sections shows that jamming is a rather inter-mittent phenomenon with many long periods of no jamming (Fig. 6a). At the end of this simulation 29 cross sections were jammed (around 10% of the total). The longitudinal profiles of bed elevation (Fig. 6b) show how CASTJMis able to create step structures and this increases the total slope of the chan-nel and its storage, even if the slope between steps is the same as in the case without jamming (CASTRBM). The box plots of the instantaneous (i.e., calculated for every time step) values of R, both the meanhRi (Fig. 6c) and the standard devia-tionσR(Fig. 6d), show that the model with jamming yields a rougher and more variable bed. Instantaneous values of spe-cific sediment fluxqs (Fig. 6e) show that jamming slightly increases the variability inqSand prevents the formation of an equilibrium slope (which would implyqS'iR=0.5) be-cause the system is still aggrading and increasing its storage. Finally, the values of the Hurst exponent of sediment flux
HqS (Fig. 6f) for the 20 realizations clearly plot separately
in the case with and without jamming, with the latter hav-ing much greater values. This longer-term memory is likely due to a combination of sediment pulses created by step col-lapses and the weak but present trend towards aggradation in the CASTJMsimulations.
4 The effect of stochasticity
Figure 6.Comparison between simulations without jamming (RBM) and with jamming (JM) foriR=0.5 andE=1.25.(a)Cumulative
number of jammed cross sections.(b)Longitudinal profiles at the end of the simulations.(c)Box plots of the instantaneous values of mean relative exposure.(d)Box plots of the instantaneous values of standard deviation of relative exposure.(e)Box plots of the instantaneous values of specific sediment flux.(f)Box plots of the values of Hurst exponent of specific sediment flux computed from the 20 realizations.
the effect of stochasticity in entrainment and sediment supply explicitly.
4.1 Stochasticity in the entrainment
The entrainment probability in CAST can be parameter-ized as a deterministic or stochastic process (Sect. 2.1.3). A stochastic parameterization allows a degree of variability in the entrainment threshold and can be controlled by two pa-rameters (EandS), while the deterministic parameterization has a unique entrainment thresholdE(Fig. 2).
The comparison for a simulation withiR=0.5,E=1, and
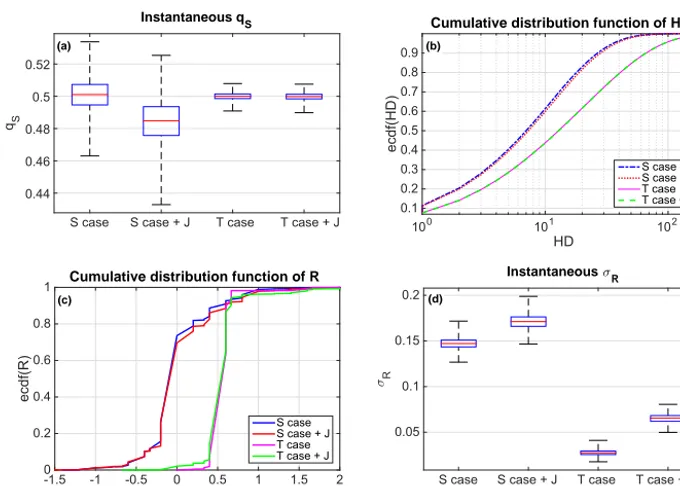
S=E/5 is shown in Fig. 7. When the entrainment process is treated as stochastic, the variability of sediment flux is much larger both in the case with and without jamming (Fig. 7a). This is due to the fact that when the channel has reached equilibrium in the deterministic case the interaction between the bed and the transport is very low. All particles below the threshold stay on the bed and those above the thresh-old are entrained. The reduced particle activity can also be inferred by looking at the distribution of particle hop dis-tances (Fig. 7b). In the deterministic case the distributions are shifted towards larger values because particles interact much less with the bed and travel further downstream. The effect of modeling the entrainment as a deterministic pro-cess on the bed morphology itself is that the final configu-ration of the channel in the threshold case is much steeper
(cumulative distribution functions ofR plot towards larger values in theT case) since no entrainment is possible be-low the threshold: the channel can bear steeper slopes and store more sediment (Fig. 7c). However, this does not trans-late into a rougher surface; σR shows that channels where the entrainment is modeled with a threshold function have very low variability aroundhRi: they tend to look more like steep and uniform ramps than like realistic fluvial channels (Fig. 7d).
This analysis support our choice of modeling the entrain-ment as a stochastic process. This is not only more physi-cally reasonable because the process of particle displacement is random per se, but it is not possible to obtain a realistic rough-bed morphology in a reduced-complexity model like CAST without a stochastic parameterization of particle en-trainment.
4.2 Stochasticity in the input rate
The effect of stochasticity in the input rate iR is shown on simulations withE=1.5 and constantiR=0.5, or ran-dom input rate uniformly distributed around the mean value
hiRi =0.5.
S case S case + J T case T case + J qS
0.44 0.46 0.48 0.5 0.52
Instantaneous qS
HD
100 101 102
ecdf(HD)
0.1 0.2 0.3 0.4 0.5 0.6 0.7 0.8 0.9
Cumulative distribution function of HD
Scase Scase + J Tcase Tcase + J
R
-1.5 -1 -0.5 0 0.5 1 1.5 2
ecdf(R)
0 0.2 0.4 0.6 0.8
1 Cumulative distribution function of R
S case S case + J T case T case + J
Scase Scase + J Tcase Tcase + J σR
0.05 0.1 0.15 0.2
Instantaneous σR
(a) (b)
(c) (d)
Figure 7.Comparison between stochastic entrainment (Scase without jamming andScase+Jwith jamming) and deterministic threshold entrainment (T case without jamming andT case+J with jamming).(a)Box plots of the instantaneous values of specific sediment flux
qS.(b)Empirical cumulative distribution function of particle hop distances HD.(c)Empirical cumulative distribution function of relative
exposureR computed on the entire control volume at the end of the simulation.(d)Box plots of the instantaneous values of the spatial standard deviation of relative exposureσR.
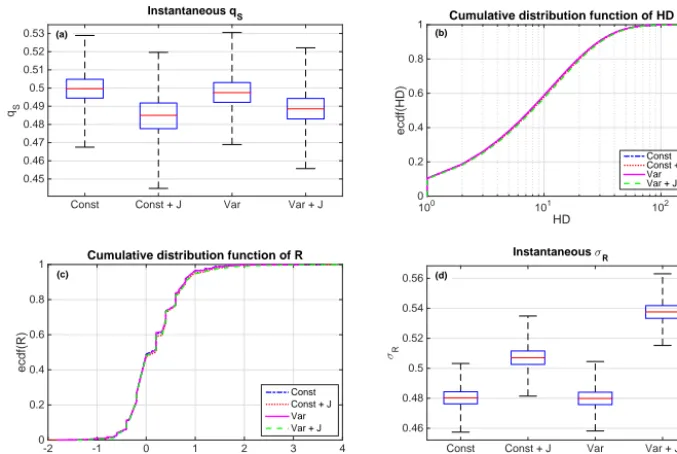
constant increase in sediment storage (and so the median transport rate is slightly below the equilibrium value of 0.5). An overlap of the four simulations is also observed when looking at the distributions of particle hop distances and final
R (Fig. 8b and c). The simulations with and without jam-ming plot separately only in the case of σR(Fig. 8d). The larger values of σRin the case of variable iRand jamming are due to the fact the variability in the input facilitates the jamming process and increases the relative exposure.
These results highlight that the variability and the fluctua-tions observed in the sediment output variables of the model do not depend on the variability of the sediment input but are instead a function of the internal dynamics of the system given by the local grain–grain and grain–bed interactions. In other words, CAST acts as a shredding filter of the input forc-ing (Jerolmack and Paola, 2010; Van De Wiel and Coulthard, 2010).
5 Unsteady simulations
Although jamming is effective in generating a step-like mor-phology under certain steady-state sediment input and en-trainment conditions, we recognize that step formation is an intermittent process in which flow variability in time is important. Typically step-pool sequences are partially or totally destroyed during large flood events and then re-worked and stabilized during the following low-flow periods
Const Const + J Var Var + J
qS
0.45 0.46 0.47 0.48 0.49 0.5 0.51 0.52 0.53
Instantaneous q S
HD
100 101 102
ecdf(HD)
0 0.2 0.4 0.6 0.8
1 Cumulative distribution function of HD
Const Const + J Var Var + J
R
-2 -1 0 1 2 3 4
ecdf(R)
0 0.2 0.4 0.6 0.8
1 Cumulative distribution function of R
Const Const + J Var Var + J
Const Const + J Var Var + J
σR
0.46 0.48 0.5 0.52 0.54 0.56
Instantaneous σR (a)
(c) (d)
(b)
Figure 8. Comparison between constant input rate (“Const” without jamming and “Const+J” with jamming) and variable input rate (“Var” without jamming and “Var+J” with jamming).(a)Box plots of the instantaneous values of specific sediment fluxqS.(b)Empirical cumulative distribution function of particle hop distances HD.(c)Empirical cumulative distribution function of relative exposureRcomputed on the entire control volume at the end of the simulation.(d)Box plots of the instantaneous values of the spatial standard deviation of relative exposureσR.
Time
Q(t)
Unsteady flow simulations
Time
E
1 1.5 2
Entrainment parameter
Time
iR
0 0.2 0.4 0.6 0.8
1 Case I - constant input rate
Time
iR
0.2 0.4 0.6 0.8
Case II - sedigraph
(a)
(b)
(c) (d)
Figure 9. Unsteady simulations with four consecutive floods. (a)Generic hydrograph the model is simulating. (b)Variation in the entrainment parameterEto simulate the changing flow condi-tions.(c)Case I: simulations with varyingEand constant input rate
iR.(d)Case II: simulations with varyingEand varying input rate iR.
5.1 Sediment storage and sediment transport
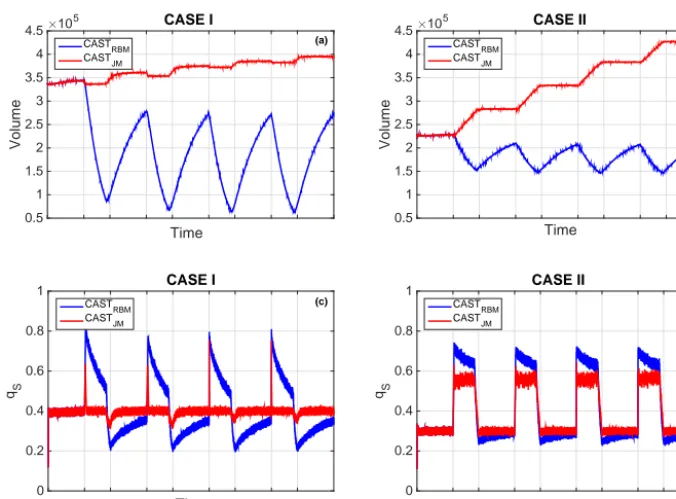
The temporal pattern of storage volume and sediment flux in the unsteady simulations is shown in Fig. 10. The vol-ume for the rough-bed case (in blue) clearly displays phases
Table 2.Values of the parameters used in the unsteady simulations.
Parameter Name Case I Case II
Channel length X 300d 300d
Channel width Y 20d 20d
Simulation duration T 550 000 550 000 Low-flow duration Tlow 70 000 70 000
High-flow duration Thigh 70 000 70 000
Rising-limb duration Tris 2000 2000
Falling-limb duration Tfal 8000 8000
Entrainment parameter (low flow) Elow 2 2
Entrainment parameter (high flow) Ehigh 1 1
Specific input rate (low flow) iR, low 0.4 0.3
Specific input rate (high flow) iR, high 0.4 0.6
Time
Volume
×105
0.5 1 1.5 2 2.5 3 3.5 4
4.5 CASE I
CASTRBM CASTJM
Time
Volume
×105
0.5 1 1.5 2 2.5 3 3.5 4
4.5 CASE II
CASTRBM CASTJM
Time
qS
0 0.2 0.4 0.6 0.8
1 CASE I
CASTRBM CASTJM
Time
qS
0 0.2 0.4 0.6 0.8
1 CASE II
CASTRBM CASTJM
(a) (b)
(c) (d)
Figure 10.Unsteady simulations with four consecutive floods.(a)Time series of storage volume for the constant input case.(b)Time series of storage volume for the variable input case.(c)Time series of specific sediment flux for the constant input case.(d)Time series of specific sediment flux for the variable input case.
The specific sediment flux when the input is constant (Fig. 10c) shows a large variability for the rough-bed case responding to changes inEduring low- and high-flow condi-tions. In the jamming case, the response to the change in flow conditions is also present but the jamming process modulates the sediment flux towards the equilibrium conditions rapidly. When the input varies with flow conditions (Fig. 10d), the rough-bed model yields the same pattern as the case with constant input with the difference that here the equilibrium condition is changing during low and high flow (0.3 and 0.6, respectively). In the jamming model instead, the sediment flux is almost instantly in equilibrium with the input rate during low flows, while during high flows the large input rate, together with the high entrainment probability, causes many jamming events that inhibit the system from reaching an equilibrium state and the channel keeps increasing its stor-age. We show the statistical distributions of specific sediment flux for the 4 cases in Fig. 11. It can be seen that the distribu-tions are centered around the equilibrium point of 0.4 (espe-cially the jamming case in red for Case I), with the rough-bed model having a more spread function due to the more intense phases of aggradation and degradation. The distributions of Case II (dashed lines) are clearly bimodal because of the two equilibrium sediment input rates (0.3 and 0.6).
5.2 Step formation and stability
The unsteady flow also has impacts on bed roughness in CAST. The time series of the standard deviationσR, which
represent the degree of roughness of the bed, is shown in Fig. 12 for the unsteady simulation with constant and vari-able input rate. In both cases jamming produces a rougher surface during high flow which is an indication that step structures, causing a larger departure from the meanR, are being formed. When the input is constant (Fig. 12a),σRgoes back to value of low flow for all the four floods, because steps that were formed are being buried by sediment. When in-stead the input rate is reduced during low flow to simulate sediment-starved conditions (Fig. 12b),σRdecreases but not to its pre-flood value because many of the steps created dur-ing high flow can survive and do not get buried in between floods.
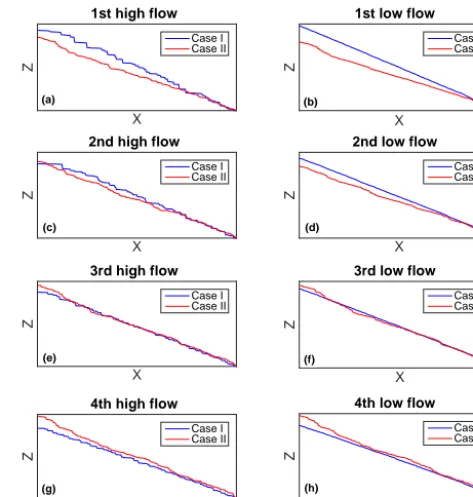
The same can be inferred from the longitudinal profiles of bed elevation of the simulations with jamming (Fig. 13). At the end of every high-flow period, the longitudinal profile shows a stepped morphology due to jamming. In the follow-ing low-flow periods the steps were buried in Case I (havfollow-ing input rateiR=0.4), while in Case II (having a lower input rate during low flow:iR=0.3) some of them survived be-cause of the sediment-starved conditions.
qS
0.2 0.3 0.4 0.5 0.6 0.7 0.8
ecdf(q
S
)
0 0.1 0.2 0.3 0.4 0.5 0.6 0.7 0.8 0.9
1 Cumulative distribution function of sediment flux
Case I - RBM Case I - JM Case II - RBM Case II - JM
Figure 11.Unsteady simulations with four consecutive floods. Em-pirical cumulative distribution functions of specific sediment flux. Blue lines identify the rough-bed model and red the jamming model. Solid lines identify the constant input case (Case I) and dashed lines the variable input case (Case II).
Time
σR
0.3 0.4 0.5 0.6 0.7 0.8
0.9 Standard deviation of relative exposure - Case I
CASTRBM CASTJM
Time
σR
0.3 0.4 0.5 0.6 0.7 0.8
0.9 Standard deviation of relative exposure - Case II
CASTRBM CASTJM
(a)
(b)
Figure 12. Unsteady simulations with four consecutive floods. Time series of the standard deviation of relative exposure σRfor (a)Case I and(b)Case II, both for the rough-bed case (in blue) and the jamming case (in red).
been proposed (e.g., Milzow et al., 2006; Zimmermann et al., 2008). Since our goal here is not to identify and count the number of steps or to test which step identification algo-rithm works best, we simply define a step in terms of local departure from the equilibrium channel slope, similarly to the method of Milzow et al. (2006). The steady-state simu-lations give us the value of the final slope at equilibrium for a given set of parameters (EandiR). We define that a cross section in CAST has a step if its local slope is greater than the equilibrium slope by a factor β. The time series of step density evaluated in this way is shown for different values of β in Fig. 14. The temporal pattern of step density
varia-X
Z
1st high flow
Case I Case II
X
Z
1st low flow
Case I Case II
X
Z
2nd high flow
Case I Case II
X
Z
2nd low flow
Case I Case II
X
Z
3rd high flow
Case I Case II
X
Z
3rd low flow
Case I Case II
X
Z
4th high flow
Case I Case II
X
Z
4th low flow
Case I Case II (e)
(g)
(f)
(h) (d) (c)
(a) (b)
Figure 13. Unsteady simulations with four consecutive floods. Longitudinal profiles of bed elevation computed at the end of every high-flow period (left column:a, c, e, g) and at the end of each of the following low-flow period (right column:b, d, f, h) for a typical simulation.
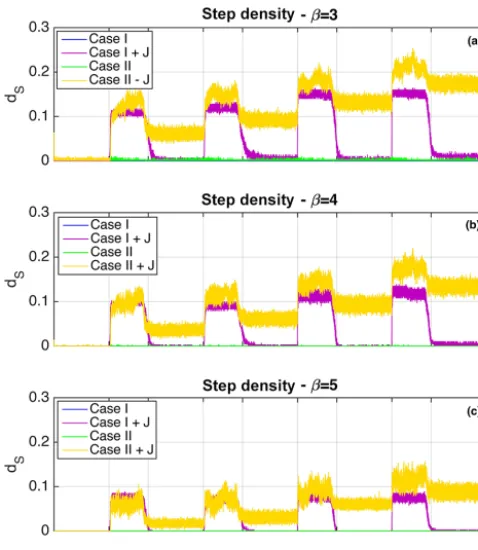
tions is largely independent ofβ. The time evolution of step density as a function of flow and sediment supply conditions allows us to draw two conclusions. First, there is a clear dif-ference between simulations with and without jamming in that jamming is responsible for step formation, and without it there are practically no steps formed in the channel (blue and green lines in Fig. 14). Second, after steps are generated ing high-flow periods due to jamming, they only survive dur-ing low flow if the sediment supply decreases (yellow lines in Fig. 14) in sediment-starved conditions. This matches the temporal dynamics of step counts as observed in the field (e.g., Molnar et al., 2010) and in flume experiments (e.g., Curran and Wilcock, 2005).
6 Discussion
6.1 Bed load: a stochastic, granular, and shredding phenomenon
Figure 14. Unsteady simulations with four consecutive floods. Time series of step density with(a)β=3,(b)β=4, and(c)β=5.
gravel particles on a river bed and showed how the erodi-bility of a grain is controlled by its protrusion and friction angle. Given the associated high variability, they also sug-gested that, instead of using one single value for the shear stress, a probabilistic approach should be applied. The role played by particle interlocking and partial burial in increas-ing measured friction angles in steep channels has also been shown recently by Prancevic and Lamb (2015). Many lab-oratory studies have increased our knowledge of bed load transport exactly by looking at the granular scale (e.g., La-jeneusse et al., 2010; Houssais et al., 2015), suggesting that we might be more successful in describing this phenomenon when borrowing concepts from the granular physics commu-nity (e.g., Church and Zimmermann, 2007; Frey and Church, 2011).
CAST assumes a stochastic description of sediment trans-port, following and corroborating recent research (Furbish et al., 2012; Roseberry et al., 2012; Heyman et al., 2014; Ancey and Heymann, 2014). Our model produces fluctua-tions in transport rates by the interaction with the bed through entrainment and deposition of individual particles and these fluctuations are observed in our simulations even with a con-stant input forcing. What in our model is defined as specific sediment fluxqSis equivalent to the particle activity as de-fined in Furbish et al. (2012). In a companion paper Rose-berry et al. (2012) found that changes in transport rates are dominated by changes in the number of particles in motion
rather than velocity: this justifies the choice of assuming con-stant particle velocity but varying entrainment threshold in our simulations.
The stochastic parameterization of CAST does not assume a priori any probability distribution for particle hop distances, and yet they turn out to be well fitted by an exponential dis-tribution, in agreement with previous theoretical and field studies (e.g., Hill et al., 2010; Hassan et al., 2013; Schneider et al., 2014). The fact that, despite its simplicity, the model can reproduce this important feature in a robust way proves at least partially that the local grain–grain and grain–bed in-teraction rules in CAST are appropriate and that the phe-nomenological descriptions of the simulated processes are going in the right direction.
Finally, CAST also reproduces the shredding effect some-times visible in sediment transport (Jerolmack and Paola, 2010). The measured variability of sediment flux and its fluc-tuations are dictated by the internal dynamics of the system and the degree of fluctuations in the input forcing does not always affect the sediment flux in a clear way (see Fig. 8). Our results then show the reduced-complexity model poten-tial to capture bed load transport as a stochastic phenomenon at the grain scale. Interactions between individual particles can give rise to, or at least strongly impact, the variability ob-served in natural fluvial systems. Reduced-complexity mod-els like CAST can serve to model these interactions and their effects and can be used to gain new insights into the com-plex dynamics of sediment transport and to test new research hypotheses.
6.2 Step formation and stability: a granular problem
We showed with CASTJMthat dynamic jamming of particles in motion is effective in forming steps (see Fig. 13). In fact, only by including the jamming process did we generate step-pool morphologies in our numerical experiments. Moreover, once steps are formed, they remain stable if the flow condi-tions change (i.e., the entrainment probability decreases) and the supply of sediment is low enough to avoid these steps be-ing buried by particles (as shown in Fig. 14). These results are consistent with the main ideas of the jammed state hy-pothesis of Church and Zimmermann (2007), who theorized and showed experimentally (Zimmermann et al., 2010) that step stability needs (a) jamming, expressed as a low width to diameter ratio so as to enhance granular forces; (b) low-flow stage, in order to avoid the mobilization of keystones; and (c) sediment-starved conditions, because a high sedi-ment concentration would bury the steps. Despite its simpli-fications, especially uniform sediment and no explicit flow parametrization, CASTJMcan reproduce these observations and support the jammed state hypothesis for step stability.
formed with a regular spacing. Moreover, as has been shown by more recent experimental (Curran, 2007; Zimmermann et al., 2010) and field studies (Zimmermann and Church, 2001; Molnar et al., 2010), step occurrence is mainly driven by the random location of boulders (i.e., keystones) around which sediment deposits and clusters.
6.3 Outlook
Our modeling approach has by definition some simplifica-tions and limitasimplifica-tions which we think can be improved in fu-ture research. First, the uniform size of the sediment prevents us from specifically modeling any grain-size effect that might indeed be very important in steep-channel dynamics. We par-tially incorporated these effects in the stochastic parameteri-zation of entrainment: the fact that, for the same value of rela-tive exposureRand entrainment parameterE, some particles are displaced and some are not also accounts for differences in their dimension and weight. Also the jamming process may be dependent on grain size, as well as on the particle velocity. Second, the parameterization of changing flow con-ditions is done indirectly, summarized entirely in the entrain-ment parameter E. This is done mainly because we are not aiming to model discharge, flow, shear stress on the bed but rather to transfer their effects onto the probability of entrain-ing grains. However, future improvements of CAST could include a more direct relation between hydraulic stresses on the bed and theEandSparameters in our model. Third, the granular interactions (i.e., collisions) among particles always lead to deposition, which might not always be realistic, at least in fluvial systems with particles having different sizes and shapes. The same can be said about interactions with the banks of the channel. However, in a uniform-size case this assumption does not seem to be too strong.
Furthermore, we did not account for the transfer of mo-mentum that could happen when a particle is deposited and thus enhances the probability of entrainment of the sur-rounding grains (i.e., “collective entrainment” as in Ancey and Heymann, 2014). With a model like CAST the relative importance of this phenomenon in the entrainment process could be evaluated. Finally, the choice of representing the jamming of grains on the bed as a permanent process is a limitation. In a model having only a single grain size, this choice has been made to account for the additional granu-lar forces that are making step structures more stable around a keystone. In future research, especially in a model which accounts for different grain fractions, the role of step forma-tion and stability may be transferred to the coarsest grains to which the jamming threshold will apply.
In conclusion, in our opinion the strongest limitation of the current model is the absence of sediment sorting and other grain-size effects. All these phenomena will be incorporated in the next version of the model, which will have different grain-size fractions.
7 Conclusions
We presented a new particle-based reduced-complexity model, CAST (Cellular Automaton Sediment Transport), that simulates bed load transport and changes in chan-nel morphology, including the processes of jamming and step formation. The model simulates grain–grain and grain– bed interactions with uniform-size particles and can have stochastic or deterministic parameterizations for sediment in-put rate and particle entrainment. With only a few parame-ters, it is possible to simulate channels with different sedi-ment supply and flow conditions. At steady state, CAST can reproduce a realistic bed morphology and typical fluctuations in transport rates whose memory features are consistent with previous experimental data. Moreover, particle hop distances are well fitted by exponential distributions, in agreement with field observations. One of the main results is the role played by stochasticity both in the entrainment and in the input rate. A stochastic input rate does not change the final outcome of the model compared to a constant input having the same mean. However, if the entrainment is modeled deterministi-cally, the resulting channel does not have the typical variable bed roughness encountered in real fluvial systems.
The dynamic effect of particle jamming was added to test under which conditions steps are formed and remain stable in steep channels. The effect of jamming has been tested in unsteady simulations where the entrainment probability and the input rate have been changed to simulate a sequence of high-flow and low-flow periods. CAST generates step struc-tures during high-flow periods that survive during low flows in simulations with sediment-starved conditions, in agree-ment with the jammed-state hypothesis. Our results support the jammed-state hypothesis as a framework to explain step formation and stability, and, more generally, they show the potential of reduced-complexity models at a grain scale with stochastic parameterizations. We are of the opinion that mod-els such as CAST can give new insights into the dynamics of complex phenomena like sediment transport and step forma-tion and can be useful to test research hypotheses in fluvial geomorphology.
Acknowledgements. Matteo Saletti acknowledges the support of the SNSF for funding his PhD (grant number 200021_140488) and for the Doc.Mobility grant that allowed him to spend a semester at the Geography Department of UBC in Vancouver (Canada). Fruitful conversations with Chris Paola and Shawn Chartrand are greatly acknowledged, as well as many inputs received during the workshop “Complexity in geomorphology” held at ETH in June 2015. Chris Paola and one anonymous referee provided helpful comments, which helped us to improve the manuscript. Finally, the authors wish to acknowledge the ETH cluster EULER, where the numerical simulations were performed with the help of Daniela Anghileri.
Edited by: S. Castelltort
Reviewed by: C. Paola and one anonymous referee
References
Abrahams, A. D., Li, G., and Atkinson, J. F.: Step-Pool Streams: Adjustment to Maximum Flow Resistance, Water Resour. Res., 31, 2593–2602, doi:10.1029/95WR01957, 1995.
Ancey, C. and Heymann, J.: A microstructural approach to bed load transport: mean behaviour and fluctuations of particle transport rates, J. Fluid Mech., 744, 129–168, doi:10.1017/jfm.2014.74, 2014.
Armanini, A., Cavedon, V., and Righetti, M.: A proba-bilistic/deterministic approach for the prediction of the sediment transport rate, Adv. Water Resour., 81, 10–18, doi:10.1016/j.advwatres.2014.09.008, 2015.
Badoux, A., Andres, N., and Turowski, J. M.: Damage costs due to bedload transport processes in Switzerland, Nat. Hazards Earth Syst. Sci., 14, 279–294, doi:10.5194/nhess-14-279-2014, 2014. Bak, P., Tang, C., and Wiesenfeld, K.: Self-organized
critical-ity, Phys. Rev. A, 38, 364–374, doi:10.1103/PhysRevA.38.364, 1988.
Chartrand, S. M., Jellinek, M., Whiting, P. J., and Stamm, J.: Geometric scaling of step-pools in mountain streams: Ob-servations and implications, Geomorphology, 129, 141–151, doi:10.1016/j.geomorph.2011.01.020, 2011.
Chiari, M. and Scheidl, C.: Application of a new cellular model for bedload transporting extreme events at steep slopes, Geomor-phology, 246, 413–419, doi:10.1016/j.geomorph.2015.06.035, 2015.
Chin, A. and Wohl, E.: Toward a theory for step pools
in stream channels, Prog. Phys. Geog., 29, 275–296,
doi:10.1191/0309133305pp449ra, 2005.
Church, M. and Ferguson, R. I.: Morphodynamics: Rivers beyond steady state, Water Resour. Res., 51, 1883–1897, doi:10.1002/2014WR016862, 2015.
Church, M. and Zimmermann, A.: Form and stability of step-pool channels: Research progress, Water Resour. Res., 43, W03415, doi:10.1029/2006WR005037, 2007.
Comiti, F. and Mao, L.: Recent Advances in the Dynamics of Steep Channels, in: Gravel-Bed Rivers: Processes, Tools, Envi-ronments, edited by: Church, M., Biron, P. M., and Roy, A. G., Wiley & Sons, Chichester, UK, 2012.
Coulthard, T. J. and Wiel, M. J. V. D.: Quantifying fluvial non lin-earity and finding self organized criticality? Insights from
sim-ulations of river basin evolution, Geomorphology, 91, 216–235, doi:10.1016/j.geomorph.2007.04.011, 2007.
Crave, A. and Davy, P.: A stochastic “precipitation” model for sim-ulating erosion/sedimentation dynamics, Comput. Geosci., 27, 815–827, doi:10.1016/S0098-3004(00)00167-9, 2001.
Curran, J. C.: Step-pool formation models and associated step spacing, Earth Surf. Proc. Land., 32, 1611–1627, doi:10.1002/esp.1589, 2007.
Curran, J. C. and Wilcock, P. R.: Characteristic dimensions of the step-pool bed configuration: An experimental study, Water Re-sour. Res., 41, W02030, doi:10.1029/2004WR003568, 2005. Einstein, H. A.: Bed load transport as a probability problem, PhD
thesis, ETH, Zurich, Switzerland, 1937.
Einstein, H. A.: The Bed-Load Function for Sediment Transporta-tion in Open Channel Flows, Technical Bulletin 1026, US De-partment of Agriculture, 1950.
Fonstad, M. A. and Marcus, W. A.: Self-organized criticality in riverbank systems, Ann. Assoc. Am. Geogr., 93, 281–296, doi:10.1111/1467-8306.9302002, 2003.
Frey, P. and Church, M.: How river beds move, Science, 325, 1509– 10, doi:10.1126/science.1178516, 2009.
Frey, P. and Church, M.: Bedload: a granular phenomenon, Earth Surf. Proc. Land., 36, 58–69, doi:10.1002/esp.2103, 2011. Furbish, D. J., Haff, P. K., Roseberry, J. C., and Schmeeckle,
M. W.: A probabilistic description of the bed load sedi-ment flux: 1. Theory, J. Geophys. Res.-Earth, 117, F03031, doi:10.1029/2012JF002352, 2012.
Goldenfeld, N. and Kadanoff, L. P.: Simple Lessons from Com-plexity, Science, 284, 87–89, doi:10.1126/science.284.5411.87, 1999.
Hassan, M. A. and Zimmermann, A.: Channel Response and Re-covery to Changes in Sediment Supply, in: Gravel-Bed Rivers: Processes, Tools, Environments, edited by: Church, M., Biron, P. M., and Roy, A. G., Wiley & Sons, Chichester, UK, 2012. Hassan, M. A., Smith, B. J., Hogan, D. L., Luzi, D. S.,
Zimmer-mann, A. E., and Eaton, B. C.: Sediment storage and trans-port in coarse bed streams: scale considerations, in: Gravel-Bed Rivers VI: From Understanding to River Restoration, edited by H. Habersack, H. Piègay, M. R., Elsevier, Vienna, Austria, 437– 496, 2008.
Hassan, M. A., Voepl, H., Schumer, R., Parker, G., and Fraccarollo, L.: Displacement characteristics of coarse flu-vial bed sediment, J. Geophys. Res.-Earth, 118, 155–165, doi:10.1029/2012JF002374, 2013.
Heyman, J., Mettra, F., Ma, H. B., and Ancey, C.: Statistics of bedload transport over steep slopes: Separation of time scales and collective motion, Geophys. Res. Lett., 40, 128–133, doi:10.1029/2012GL054280, 2013.
Heyman, J., Ma, H. B., Mettra, F., and Ancey, C.: Spa-tial correlations in bed load transport: Evidence, impor-tance and modeling, J. Geophys. Res.-Earth, 119, 1751–1767, doi:10.1002/2013JF003003, 2014.
Hill, K. M., DellAngelo, L., and Meerschaert, M. M.: Heavy-tailed travel distance in gravel bed transport: An exploratory enquiry, J. Geophys. Res., 115, 1–13, doi:10.1029/2009JF001276, 2010. Hodge, R. and Hoey, T.: Upscaling from grain-scale processes to
Houssais, M., Ortiz, C. P., Durian, D. J., and Jerolmack, D. J.: On-set of sediment transport is a continuous transition driven by fluid shear and granular creep, Nature Communications, 6, 6527, doi:10.1038/ncomms7527, 2015.
Jerolmack, D. J. and Paola, C.: Complexity in a cellu-lar model of river avulsion, Geomorphology, 91, 259–270, doi:10.1016/j.geomorph.2007.04.022, 2007.
Jerolmack, D. J. and Paola, C.: Shredding of environmental sig-nals by sediment transport, Geophys. Res. Lett., 37, L19401, doi:10.1029/2010GL044638, 2010.
Kadanoff, L. P., Nagel, S. R., Wu, L., and Zhou, S. M.: Scaling and universality in avalanches, Phys. Rev. A, 39, 6524–6537, doi:10.1103/PhysRevA.39.6524, 1989.
Kirchner, J. W., Dietrich, W. E., Iseya, F., and Ikeda, H.: The vari-ability of critical shear stress, friction angle, and grain protru-sion in water-worked sediments, Sedimentology, 37, 647–672, doi:10.1111/j.1365-3091.1990.tb00627.x, 1990.
Lajeneusse, E., Malverti, L., and Charru, F.: Bed load transport in turbulent flow at the grain scale: Experiments and modeling, J. Geophys. Res.-Earth, 115, F04001, doi:10.1029/2009JF001628, 2010.
Lamb, M. P., Dietrich, W. E., and Venditti, J. G.: Is the crit-ical shields stress for incipient sediment motion dependent on channel-bed slope?, J. Geophys. Res.-Earth, 113, 1–20, doi:10.1029/2007JF000831, 2008.
Lenzi, M. A.: Step-pool evolution in the Rio Cordon,
north-eastern Italy, Earth Surf. Proc. Land., 26, 991–1008,
doi:10.1002/esp.239, 2001.
Liang, M., Voller, V. R., and Paola, C.: A reduced-complexity model for river delta formation – Part 1: Modeling deltas with channel dynamics, Earth Surf. Dynam., 3, 67–86, doi:10.5194/esurf-3-67-2015, 2015.
Liu, A. J. and Nagel, S. R.: The Jamming Transition and the Marginally Jammed Solid, Annual Review of Condensed Matter Physics, 1, 347–369, doi:10.1146/annurev-conmatphys-070909-104045, 2010.
MacVicar, B. J., Parrott, L., and Roy, a. G.: A two-dimensional discrete particle model of gravel bed river systems, J. Geophys. Res., 111, 1–22, doi:10.1029/2005JF000316, 2006.
Malmaeus, J. M. and Hassan, M. A.: Simulation of individual parti-cle movement in a gravel streambed, Earth Surf. Proc. Land., 27, 81–97, doi:10.1002/esp.305, 2002.
Milzow, C., Molnar, P., McArdell, B. W., and Burlando, P.: Spa-tial organization in the step-pool structure of a steep moun-tain stream (Vogelbach, Switzerland), Water Resour. Res., 42, W04418, doi:10.1029/2004WR003870, 2006.
Molnar, P., Densmore, A. L., McArdell, B. W., Turowski, J. M., and Burlando, P.: Analysis of changes in the step-pool morphology and channel profile of a steep mountain stream following a large flood, Geomorphology, 124, 85–94, doi:10.1016/j.geomorph.2010.08.014, 2010.
Montgomery, D. R. and Buffington, J. M.:
Channel-reach morphology in mountain drainage basins, Geol.
Soc. Am. Bull., 109, 596–611,
doi:10.1130/0016-7606(1997)109<0596:CRMIMD>2.3.CO;2, 1997.
Murray, A. B. and Paola, C.: A cellular model of braided rivers, Nature, 371, 54–57, doi:10.1038/371054a0, 1994.
Narteau, C., Zhang, D., Rozier, O., and Claudin, P.: Setting the length and time scales of a cellular automaton dune model from
the analysis of superimposed bed forms, J. Geophys. Res.-SE, 114, 1–18, doi:10.1029/2008JF001127, 2009.
Nicholas, A. P.: Cellular modelling in fluvial geomorphology, Earth Surf. Proc. Land., 30, 645–649, doi:10.1002/esp.1231, 2005. Paola, C. and Leeder, M.: Environmental dynamics: Simplicity
ver-sus complexity, Nature, 469, 38–9, doi:10.1038/469038a, 2011. Prancevic, J. P. and Lamb, M. P.: Particle friction angles in
steep mountain channels, J. Geophys. Res.-Earth, 120, 242–259, doi:10.1002/2014JF003286, 2015.
Recking, A.: Influence of sediment supply on mountain streams
bedload transport, Geomorphology, 175–176, 139–150,
doi:10.1016/j.geomorph.2012.07.005, 2012.
Recking, A., Frey, P., Paquier, A., Belleudy, P., and Champagne, J. Y.: Feedback between bed load transport and flow resistance in gravel bed and cobble bed rivers, Water Resour. Res., 44, W05412, doi:10.1029/2007WR006219, 2008.
Recking, A., Frey, P., Paquier, A., and Belleudy, P.: An ex-perimental investigation of mechanisms involved in bel load sheet production and migration, J. Geophys. Res., 114, F03010, doi:10.1029/2008JF000990, 2009.
Recking, A., Leduc, P., Liébault, F., and Church, M.: A field in-vestigation on the influence of sediment supply on step-pool morphology and stability, Geomorphology, 139–140, 53–66, doi:10.1016/j.geomorph.2011.09.024, 2012.
Rickenmann, D.: Comparison of bedload transport in torrents and gravel bed streams, Water Resour. Res., 37, 3295–3305, doi:10.1029/2001WR000319, 2001.
Rickenmann, D.: Alluvial Steep Channels: Flow Resistance, Bed-load Transport Prediction, and Transition to Debris Flows, in: Gravel-Bed Rivers: Processes, Tools, Environments, edited by: Church, M., Biron, P. M., and Roy, A. G., Wiley & Sons, Chich-ester, UK, 2012.
Roseberry, J. C., Schmeeckle, M. W., and Furbish, D. J.: A prob-abilistic description of the bed load sediment flux: 2. Parti-cle activity and motions, J. Geophys. Res.-Earth, 117, F03032, doi:10.1029/2012JF002353, 2012.
Rozier, O. and Narteau, C.: A real-space cellular automaton labora-tory, Earth Surf. Proc. Land., 39, 98–109, doi:10.1002/esp.3479, 2014.
Saletti, M., Molnar, P., Zimmermann, A. E., Hassan, M. A., and Church, M.: Temporal variability and memory in sediment trans-port in an experimental step-pool channel, Water Resour. Res., 51, 9325–9337, doi:10.1002/2015WR016929, 2015.
Scheingross, J. S., Winchell, E. W., Lamb, M. P., and Dietrich, W. E.: Influence of bed patchiness, slope, grain hiding, and form drag on gravel mobilization in very steep streams, J. Geophys. Res.-Earth, 118, 982–1001, doi:10.1002/jgrf.20067, 2013. Schneider, J. M., Turowski, J. M., Rickenmann, D., Hegglin, R.,
Arrigo, S., Mao, L., and Kirchner, J. W.: Scaling relationships between bed load volumes, transport distances, and stream power in steep mountain channels, J. Geophys. Res.-Earth, 119, 533– 549, doi:10.1002/2013JF002874, 2014.
Schneider, J. M., Rickenmann, D., Turowski, J. M., Bunte, K., and Kirchner, J. W.: Applicability of bed load trans-port models for mixed-size sediments in steep streams con-sidering macro-roughness, Water Resour. Res., 51, 5260–5283, doi:10.1002/2014WR016417, 2015.