The Cryosphere, 8, 245–256, 2014 www.the-cryosphere.net/8/245/2014/ doi:10.5194/tc-8-245-2014
© Author(s) 2014. CC Attribution 3.0 License.
The Cryosphere
Open Access
Diffusive equilibration of N
2
, O
2
and CO
2
mixing ratios in a
1.5-million-years-old ice core
B. Bereiter, H. Fischer, J. Schwander, and T. F. Stocker
Climate and Environmental Physics, Physics Institute, University of Bern, Sidlerstrasse 5, 3012 Bern, Switzerland Oeschger Centre for Climate Change Research, University of Bern, 3012 Bern, Switzerland
Correspondence to: B. Bereiter ([email protected]), H. Fischer ([email protected]), J. Schwander ([email protected]), and T. F. Stocker ([email protected])
Received: 25 April 2013 – Published in The Cryosphere Discuss.: 17 May 2013
Revised: 11 December 2013 – Accepted: 1 January 2014 – Published: 17 February 2014
Abstract. In the framework of the International Partnerships
in Ice Core Sciences, one of the most important targets is to retrieve an Antarctic ice core that extends over the last 1.5 million years (i.e. an ice core that enters the climate era when glacial–interglacial cycles followed the obliquity cycles of the earth). In such an ice core the annual layers of the oldest ice would be thinned by a factor of about 100 and the cli-matic information of a 10 000 yr interval would be contained in less than 1 m of ice. The gas record in such an Antarctic ice core can potentially reveal the role of greenhouse gas forcing on these 40 000 yr cycles. However, besides the extreme thin-ning of the annual layers, also the long residence time of the trapped air in the ice and the relatively high ice temperatures near the bedrock favour diffusive exchanges. To investigate the changes in the O2/ N2ratio, as well as the trapped CO2 concentrations, we modelled the diffusive exchange of the trapped gases O2, N2and CO2along the vertical axis. How-ever, the boundary conditions of a potential drilling site are not yet well constrained and the uncertainties in the perme-ation coefficients of the air constituents in the ice are large. In our simulations, we have set the drill site ice thickness at 2700 m and the bedrock ice temperature at 5–10 K below the ice pressure melting point. Using these conditions and in-cluding all further uncertainties associated with the drill site and the permeation coefficients, the results suggest that in the oldest ice the precessional variations in the O2/ N2ratio will be damped by 50–100 %, whereas CO2 concentration changes associated with glacial–interglacial variations will likely be conserved (simulated damping 5 %). If the preces-sional O2/ N2signal will have disappeared completely in this
future ice core, orbital tuning of the ice-core age scale will be limited.
1 Introduction
In the framework of the International Partnerships in Ice Core Sciences (IPICS), one target is to retrieve an ice core reach-ing back in time as far as possible. The main objective of such a core would be to cover the Middle Pleistocene climate tran-sition, the transition interval from the “40 kyr world” prior to about 900 thousand years before present (kyr BP) (Elderfield et al., 2012), where full glacial–interglacial cycles occurred in parallel to obliquity cycles, to the well-known “100 kyr world” thereafter, where rather short interglacials were ob-served every about 100 kyr. Accordingly, such an ice core should ideally disclose the last 1.5 million years (Myr) of climate history. The conditions, where such an ice core can be found, are only satisfied in central East Antarctica where it is cold and dry enough (see Fischer et al., 2013). The most important boundary condition for finding such old ice is that no melting occurs at the bottom of the ice sheet. Only in this case, the ancient ice may be preserved in the deepest part of the ice sheet. In the case of the EPICA Dome C (EDC) ice core, about 0.6 mm ice per year is melting at the bedrock (Parrenin et al., 2007b), which limits the age of the deepest (undisturbed) ice to about 800 kyr.
246 B. Bereiter et al.: Diffusive equilibration of N2, O2and CO2mixing ratios
at such a drill site, the annual layers would also be thinned infinitely. Therefore, the question arises by how much the an-nual layers can be thinned until gas diffusive processes start to deteriorate and eventually remove the signal stored in the trapped atmospheric air. In order to investigate this question we modified the diffusion model of Bereiter et al. (2009) and combined it with a one-dimensional ice flow and ice temper-ature model. The diffusive exchange of O2, N2 and CO2is calculated and the behaviour of an initially sinusoidal con-centration sequences of these gases with different periods is simulated along the ice core axis, while the ice is compressed and moving down with the vertical ice flow (see results in Sect. 4).
To calculate the diffusive exchange of the air constituents in the ice, permeation coefficients (product of diffusion and solubility) are required for each constituent. These coeffi-cients for O2, N2and CO2are very small and a precise mea-surement is very challenging. Therefore, only a few estimates of these parameters, using different approaches, are found in the literature. For O2 and N2 we use the “set B” of Bere-iter et al. (2009) and call it here “fast set” (FS), but we do not use the “set A” as it provided unrealistic results in that work. In addition, we also use the permeation parameters of Salamatin et al. (2001) (referred to as “slow set” (SS)) and a recent estimate of total air permeability of Uchida et al. (2011). For CO2we use only the permeation parameter of Ahn et al. (2008) due to the lack of other reliable estimates (see Fig. 2 and Sect. 2.3 for more details).
The two parameter sets FS and SS for O2and N2 show differences of up to two orders of magnitudes. A possibility to further constrain these parameters based on ice core mea-surements of the O2/ N2 ratio is presented in Sect. 3. Sim-ilar to the gas diffusion modelling work shown in Lüthi et al. (2010), which focused on the equilibration between layers of different CO2concentrations below the bubble to clathrate transition zone (BCTZ), the observed equilibration between layers of different O2/ N2 ratios in the Vostok ice core is compared with a model using the two parameter sets. Such a layering is thought to be induced by a dynamic disequi-librium during clathrate formation (Lüthi et al., 2010). If the Vostok data indeed reflect the equilibration of layered O2/ N2 ratios on a scale of centimetre, as we think, the experiments allow us to better constrain the effective permeation coef-ficients for the temperature regime below the BCTZ. How-ever, since this temperature regime is very different from the regime in which a possible equilibration in the oldest ice core takes place, our simulations in Sect. 3 do not allow us to rule out any of the two permeation data sets used in our simula-tions.
2 Method
2.1 Model set-up
The gas diffusion part of the model is based on the model presented in Bereiter et al. (2009) with the difference that the diffusion is calculated vertically (along the ice core axis) and not in radial direction of the ice core. The diffusion equation is adjusted as follows:
∂Cn ∂t = ∂ ∂z Dn ∂Cn ∂z ,
whereCn represents the concentration in the ice of the air
constituentn (O2, N2 or CO2), Dn the corresponding
dif-fusion coefficient in ice, and z the vertical direction from
z=0 (bottom) toz=H (surface of the ice sheet). The gas exchange of the air enclosures with the surrounding ice is calculated according to Bereiter et al. (2009). The diffusion model is run for discrete intervals of the ice core.Dn and
the solubility are a function of the mean temperature of such an interval, which means that they are kept independent ofz
within each interval.
In order to calculate the annual layer thickness of the ice and the corresponding temperature at a certain depth, the fol-lowing one-dimensional ice flow model is used (Parrenin et al., 2007b):
w (z)= −(A−m) u (z)−m, (1)
u (z)=1−p+2
p+1
1− z
H
+ 1
p+1
1− z
H
p+2
, (2) wherew(z)denotes the vertical ice velocity at the height z
over the bedrock,Athe accumulation rate of ice at the sur-face,mthe melt rate at the bedrock,Hthe vertical thickness of the ice sheet andp a tuning factor. A,mandH are ex-pressed in ice equivalent of constant density (921 kg m−3). The velocity profile is based on the work of Lliboutry (1979) and is also used for the latest ice-core age scales (Parrenin et al., 2007a).
For the temperatureT (z), besidesH andA, also the sur-face temperatureTsand the geothermal heat fluxQgare rel-evant. Based on the heat diffusion and advection equation
∂T ∂t =K
∂2T ∂z2 −w
∂T
∂z, (3)
the following equation for the stationary temperature profile
T (z)can be derived:
T (z)=Ts−C0
Z
ef(z0)dz0− Z
ef(z0)dz0
, (4)
f z0=−1
K (A−m) z
0+
p1
1− z
0
H
2 −p2
1−z
0
H
p+3!
−1
Kmz
0
B. Bereiter et al.: Diffusive equilibration of N2, O2and CO2mixing ratios 247
Table 1. Drill site parameters for the different model experiments. The Vostok ice thickness (ice equivalent) is given by Salamatin et
al. (1998). The other Vostok parameters are derived from the calibration procedure. For the EDC parameters the accumulation rate (tem-poral mean), the melt rate and the ice thickness (ice equivalent, tem(tem-poral mean) of Parrenin et al. (2007a) are used. The EDC surface temperature (temporal mean) is from Jouzel et al. (2007). The EDC tuning parameter and the geothermal heat flux are derived from the calibration procedure. The oldest ice core parameters are artificial and set such that the age and temperature requirements (1.5 Myr 100 m above ground, bottom temperature below pressure melting point) are fulfilled.
Drill site parameters Vostok EDC Oldest ice core
A Accumulation rate [mm yr−1] 19 18.2 15
m Melt rate [mm yr−1] 0.8 0.7 0
H Ice thickness [m] 3690 3153 2700
p Tuning parameter 20 3.8 7.3
Ts Surface temperature [K] 214.5 212.2 213
Qg Geothermal heat flux [mW m−2] 45 53.3 55
C0=
−Qg
λ exp
1
K(A−m) (p1−p2)
, (6)
p1=
p+2
p+1
H
2,
p2= 1
p+1
H p+3,
λ=2.43 W
mK,
K=1.42·10−6m 2
s ,
whereλis the thermal conductivity, andK the thermal dif-fusivity of ice calculated for 243 K (Schwander et al., 1997). 243 K is about the mean ice temperature. Since we tune the ice temperature profile to measured borehole temperatures, our simulations are not sensitive to this value.Qgis the part of the geothermal heat flux, which is not used for melting of ice at the bottom and is diffusing upwards by heat conduc-tion. In case of no melting at the bottom (oldest ice) this is of course equal to the total geothermal heat flux.
Note that in realityλandKare functions of temperature. Above, we assumeλandKto be constant and calculate the steady state, that is, we use average boundary conditions (sur-face temperature, accumulation rate and ice thickness). This allows us to derive the semi-analytical solution forT (z)of Eq. (4). Therefore, the melt rates and geothermal heat fluxes derived in our model may differ quantitatively from the true values at Dome C. However, the temperature in the deeper part of the ice sheet is well represented as illustrated in Fig. 1. The temperature profile of a potential oldest ice core site is expected to be similar with the difference – as mentioned above – that the bedrock temperature must be lower to avoid ice melting.
In a first step, the depth–age distribution (age(z)) is cal-culated for the given input parametersA, H, mand p by
integrating the inverse of the vertical velocityw(z):
age (z)=
Z 1
w (z0)dz 0
.
Then, this scale is divided into intervals of equal temporal duration, meaning that an ice particle, which travels down in the ice sheet, would stay within each of these intervals for the same period of time. For each of these intervals an average annual layer thickness and an average ice temperature is cal-culated using the temperature profile described from solving Eqs. (4) to (6) (see Fig. 1).
The diffusion model is run for each of these intervals start-ing with the upper most one with a given trapped air compo-sition (see Figs. 4 and 6 for corresponding starting distribu-tions). The simulation time for each interval corresponds to the residence time in the intervals. After the gas composi-tion changes have been calculated for the first interval, the resulting composition is used in the next step for the run in the next lower interval where the length of the trapped gas section is scaled according to the new annual layer thick-ness, and the permeation coefficients are changed according to the new temperature. This process is repeated downwards through all intervals until the lowest interval is reached.
2.2 Input parameters for the ice core model
248 B. Bereiter et al.: Diffusive equilibration of N2, O2and CO2mixing ratios
Gas diffusion in oldest ice core
16 December 2013
Figures
Fig. 1
Fig. 2
Page 22
611
612
613
614
615
616
Fig. 1. Age of ice (A, C) and ice temperature (B, D) profiles of the Vostok (A, B) as well as of the EDC and oldest ice core (C, D). Red
lines: reference records for tuning the ice parameters (A EGT20 age scale (Petit et al., 1999); EDC3 age scale (Parrenin et al., 2007a); (B) Vostok bore hole temperature (Salamatin et al., 1994); (D) EDC bore hole temperature measured in December 2004). Blue lines: modelled ice age and ice temperature profiles using the Vostok (A, B) and EDC (C, D) ice parameters (Table 1). Green lines: modelled ice age and ice temperature profiles using the oldest ice core ice parameters. The grey shaded area marks the depth below the BCTZ for which the simulations of Sect. 3 have been performed. The depth level zero corresponds to the model ice sheet thickness at Vostok (A, B) and EDC (C,
D) drill site in m ice equivalent. The depth of the oldest ice core is shifted by 453 m such that the bedrock is reached at the same depth as for
the EDC core.
For most of the EDC ice parameters corresponding values can be found in the literature. The factorsA,m,H andTs are set such that they lie within their uncertainties or agree within 2 % with the values reported in Parrenin et al. (2007a) and Jouzel et al. (2007). The factor p is modified relative to the corresponding value given in Parrenin et al. (2007b) (1.97±0.93) in order to improve the agreement of the mod-elled age(z) with the ED3 age scale (Parrenin et al., 2007a). The factorQg is set such that T (0)fits the EDC bedrock temperature (see Fig. 1).
In the case of Vostok, corresponding values for all ice parameters are not found in the literature, and if so, they are mostly less precise compared to the EDC parameters and/or do not cover the full extent of the ice core. However, for the simulations performed under Vostok conditions (see Sect. 3), it is only necessary that the modelled age(z) and
T (z)roughly represent the corresponding reference records below the BCTZ, between 1250 and 2500 m depth (grey shaded area in Fig. 1), and not down to the bottom of the ice core (3379 m depth). We calibrate our models with the EGT20 age scale of Petit et al. (1999) and the borehole tem-perature of Salamatin et al. (1994). For the tuning of the Vos-tok ice parameters, the parameter H was kept fixed at the value presented in Salamatin et al. (1998) and the other pa-rameters were varied.
The artificial parameters of the oldest ice core are chosen such that the ice 100 m above the bedrock reaches an age of roughly 1.5 million years (aim of IPICS oldest ice) and
that the bottom ice temperature is 4–5 K below the pressure melting point of the ice. The reason for the 100 m criterion is that several ice cores show disturbed ice layering due to irregular flow below a certain depth (e.g. EPICA commu-nity members (2006), NEEM commucommu-nity members (2013)). In the EDC ice core this depth lies at about 100 m above the bedrock. The tuning parameterpis estimated using the the-oretical calculation of Parrenin et al. (2007b). However, in the case of the EDC and Dome Fuji ice cores this theoretical value was found to be too high. Parrenin et al. (2007b) sug-gest that the bedrock topography might cause this discrep-ancy. Another reason might be that Eq. (2) has been derived for ice sheets far away from ice divides and ice domes (Lli-boutry, 1979), which is not fulfilled for the two ice cores. Accordingly, also thepvalue for an oldest ice core might be closer to the EDC value, which results in less thinning of the deep ice and, hence, a weaker gas diffusion effect. The influ-ence of this different thinning profile is discussed in Sect. 4 and in the Supplement.
B. Bereiter et al.: Diffusive equilibration of N2, O2and CO2mixing ratios 249
2700 m which permits a cold bedrock under the geothermal conditions we have set.
2.3 Input parameters for the gas diffusion model
The main reason for a limited predictability of the gas ex-change effects in the oldest ice core is the uncertainty of the gas parameters (solubility and diffusion coefficients) of N2, O2and CO2. As mentioned in Sect. 1, these parameters are very difficult to assess since they are very small, making measurements under lab conditions very challenging. There-fore, the parameters have been estimated in an indirect way. The experimental approaches that were used do not permit to estimate solubility and diffusivity of the gases separately but only the product of both, the permeability. In fact, it is the permeability that determines the magnitude of the dif-fusive gas transport in the ice from one air inclusion to an-other. Thus, an increase of the diffusion coefficient can be compensated by a corresponding decrease of the solubility coefficient and vice versa.
For the CO2 permeability only one reliable estimate of Ahn et al. (2008) is found which is used in all simulations. This estimate is based on analysis of the CO2 concentra-tion around a layer of refrozen melt water in the Siple Dome ice core. Older estimates for the permeability exist, but have shown unrealistic results in a previous diffusion study (Bere-iter et al., 2009). Note, however, that also the estimate by Ahn et al. (2008) is missing an independent experimental proof. For the permeability of N2and O2we use two sets, which are based on different approaches and demonstrate the large spread of such estimates (see Fig. 2). The origin of the “slow set” (SS) is the work of Salamatin et al. (2001) in which the parameters are estimated by reconstructing the O2/ N2ratio fractionation between bubbles and clathrates in the BCTZ. The “fast set” (FS) is based on the work of Ikeda-Fukazawa et al. (2004) and Ikeda-Fukazawa et al. (2005), who have calculated the parameters based on a computer model sim-ulating the behaviour of the gas molecules in the ice lattice (molecular simulations). The second set corresponds also to the “set B” parameters used in Bereiter et al. (2009). Since the gas diffusion model requires a solubility and a diffu-sion coefficient for each gas species, but in most cases only the permeation coefficients are available, we used for all gas species and throughout our calculations diffusion coef-ficients derived by Ikeda-Fukazawa et al. (2004), which are also based on molecular simulations, and adjusted the solu-bility coefficients accordingly.
The FS parameters are entirely synthetic based only on molecular simulations (Ikeda-Fukazawa et al., 2004, 2005). The SS and the CO2 parameters are based on a model that simulates observed air fractionation and diffusive smoothing, respectively, in an ice core (Salamatin et al., 2001). The tem-perature regimes at which the observations have been per-formed are indicated by the crosses in Fig. 2. Since they cover only a small temperature range of a few degrees, the
Gas diffusion in oldest ice core 16 December 2013
Figures
Fig. 1
Fig. 2
Page 22 611
612
613
614
615
616Fig. 2. Comparison of the different estimates of gas permeation
co-efficients in ice. The black dashed line denoted with “total air” rep-resents the total air permeation value of Uchida et al. (2011). The black lines denoted with “fast” represent the “fast set” (FS) (Ikeda-Fukazawa et al., 2005) and the grey lines denoted with “slow” repre-sent the “slow set” (SS) (Salamatin et al., 2001) used for the simula-tion presented here. The CO2permeation coefficient is the same for
both sets (Ahn et al., 2008) (solid black line). Most permeation co-efficients shown here consist of a solubility and a diffusion parame-ter. In all these cases the diffusion parameters of Ikeda-Fukazawa et al. (2004) are used whereas the solubility is adjusted accord-ingly. The crosses indicate for which ice temperature regime the corresponding parameters have an experimental support and, hence, show which parts of the parameters are extrapolated. In the case of the total air parameter the temperature regime covers a larger range as indicated by the crosses.
temperature sensitivities of the parameters are rather uncer-tain and the extrapolation of these parameters to tempera-tures far away from the observed regime may be inaccurate. In contrast to that, the molecular simulations used for the FS parameters have been performed over a wide range of ice temperatures (230–270 K) allowing to derive a theoret-ical temperature dependence of the parameters for the full temperature range of our study. These temperature sensitiv-ities are much smaller than the ones of the SS parameters. However, since there is not enough independent proof for or against one of these parameter sets, both sets are used in our simulations.
250 B. Bereiter et al.: Diffusive equilibration of N2, O2and CO2mixing ratios
since the deep ice is exposed to such temperatures for sev-eral 100 kyr. However, we can not directly use this estimate for our simulations since separate parameters for the differ-ent air constitudiffer-ents are required in order to simulate the effect on the mixing ratios. Nevertheless, we estimate the effect of such a low air permeability on the O2/ N2ratio in the oldest ice core simulations by running the model with the FS and SS parameters scaled down with a constant factor to match the total air permeability of Uchida et al. (2011) at about 265 K (see Sect. 4).
3 A constraint for the gas permeability in ice
In this section an experimental constraint for the permeation coefficients is described which is based on a natural phe-nomenon in deep ice cores. Based on the O2/ N2ratio data from the Vostok ice core, the constraint is used to test the permeation coefficients of N2and O2 of the two parameter sets used in this work.
Lüthi et al. (2010) showed that in the BCTZ of differ-ent Antarctic ice cores the O2/ N2 ratio and the CO2 con-centration of the trapped air vary between horizontal layers of a few centimetres vertical extent. This non-climatic sig-nal is explained by a layer-wise transformation of bubbles to clathrates in the BCTZ and the preferential trapping of O2and CO2 in the clathrates relative to N2, leading to lo-cal fluctuations in the CO2 concentration and O2/ N2 ratio between these layers. The amplitude of the CO2fluctuations declines exponentially below the BCTZ presumably due to gas diffusion through ice. The model presented in Sect. 2 al-lows us to simulate the decline of these fluctuations, which are compared with the decline in the signal amplitude of such layers found in ice core records. However, the avail-able O2/ N2records do not all resolve the decline. In order to do so, the record must cover the ice core section of approxi-mately 1000 m just beneath the BCTZ with an adequate res-olution and the vertical extent of the individual ice samples used for the record must not be much larger than the original layering. In the case of the O2/ N2ratio records, there exists a record from the Vostok ice core (Bender, 2002) that fulfils these requirements. Note, however, that this record consists of discrete samples and no intervals of continuous O2/ N2 measurements exist for this core.
Figure 3 shows the Vostok O2/ N2record in the top part (grey dots) and in the bottom part the absolute value of the residuals of the data points relative to the spline through-out the data after correcting for the measurement uncertainty (0.5 ‰) (grey crosses). The residuals represent the data vari-ations on short time and length scales and, hence, contain also the variations on a centimetre scale due to the layering process in the BCTZ. The bottom of the BCTZ is found at 1250 m depth and an age of 83 kyr BP, respectively, where the residuals are approximately 5 ‰. From this point on the residuals decline with depth and time supposedly due to
dif-Gas diffusion in oldest ice core 16 December 2013
Fig. 3
Page 23 617
618Fig. 3. Top: O2/ N2ratio data from the Vostok ice core (Bender,
2002) (grey dots) and the data spline with a cut-off frequency of 11 kyr (Enting, 1987) (black line). Bottom: residuals of the O2/ N2
ratio values relative the the spline (grey crosses) and the exponential fit through the residuals older than 83 kyr (black line). The text in the middle of the figure shows the fit results.
fusive exchange in the ice. Therefore, the exponential fit through the residuals older than 83 kyr BP (black line) is a representation of the average diffusive decline of the layers with time.
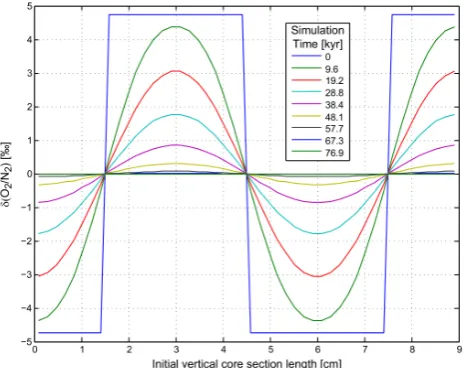
In order to simulate this measured decline, the model of Sect. 2 is run with an O2/ N2 ratio distribution at the start as shown in the example of Fig. 4 (blue line). This distribu-tion in Fig. 4 represents a layered O2/ N2ratio with a layer thickness of 3 cm and an amplitude of 4.8 ‰. The amplitude corresponds to the exponential fit value at the bottom of the BCTZ, where we set the diffusion time to zero in Fig. 5. The range of layer thickness comes from the work of Lüthi et al. (2010) on EPICA Dronning Maud Land (EDML) and EDC ice; however, the effective thickness is quite uncertain. Therefore, simulations with different layer thicknesses were performed (see below). In the model experiments shown in this section, the simulation starts in the upper most interval of the grey shaded area in Fig. 1.
B. Bereiter et al.: Diffusive equilibration of N2, O2and CO2mixing ratios 251 Gas diffusion in oldest ice core 16 December 2013
Fig. 4
Page 24 619
620
Fig. 4. Example of the model output of the O2/ N2layering decline experiments using the SS parameters. The blue line shows the start-ing O2/ N2distribution representing 3 layers (half a layer at each edge) with 3 cm thickness and an amplitude of 4.8 ‰. The different coloured lines represent simulated distributions after a certain du-ration in the ice as indicated by the legend (in 1000 yr [kyr]). From these results the corresponding decline in Fig. 5 is calculated (pur-ple line).
dashed magenta line). The results from the FS parameters (red line) show clearly that this parameter set equilibrates the layered gas composition too fast. The associated lifetime of the variations is more than two orders of magnitudes shorter than what has been observed in the data. The results with the SS parameters also show a shorter lifetime of the variations compared to the data, but the difference is not more than a factor of 4.
One large uncertainty in these experiments is the actual thickness of the layers in the Vostok ice core as no contin-uous intervals of O2/ N2 measurements exist for this core that could resolve it. In the EDML ice core, where contin-uous measurements are available, a layer thickness of 2.5 to 3 cm was found (Lüthi et al., 2010). However, the boundary conditions (accumulation rate, number and size of individ-ual precipitation events, mean surface temperature, etc.) of the EDML ice core are not the same as for the Vostok ice core. In this respect, the EDC ice core is much closer to the Vostok core. From the EDC core a short section of layer-resolving O2/ N2 measurements exist (Lüthi et al., 2010). Unfortunately, the vertical sample length used for this small data set is fairly close to the layer thickness itself and there-fore is not clearly resolving the layers. A maximum layer thickness of 5 cm can be found in this set. Therefore, we also performed a corresponding simulation.
The results presented in this section suggest that the SS pa-rameters are closer to the effective values compared to the FS parameters and the parameter of Uchida et al. (2011) (close to the FS parameters), at least for the temperature regime
be-Gas diffusion in oldest ice core 16 December 2013
Fig. 5
Page 25 621
Fig. 5. Comparison of the amplitude decline of the O2/ N2
fluctua-tions below the BCTZ derived from the Vostok data (black line, see also Fig. 3) and the modelled decline using different parameter sets (FS or SS) and layer thicknesses. The red line shows the modelled decline using the FS and 3 cm-layer thickness, the purple line shows decline using the SS and 3 cm thickness and the magenta lines show the decline using the SS and 2.5 cm (left) and 5 cm (right) thick-nesses. The results of the exponential fit through the Vostok data as shown in Fig. 3 as well as through two modelled declines are shown for comparison (arrows indicate the corresponding values).
low the BCTZ at Vostok (about 233 K). In principle, an in-dependent set of gas parameters could be derived from our approach, however, they would only be valid for the temper-ature regime below the BCTZ and not for the much warmer temperatures near the bedrock. Our approach does not pro-vide a strong constraint on the temperature sensitivities and earlier estimates also show large discrepancies in this regard (see Sect. 2.3). For these reasons, an extrapolation of a set of gas parameters derived from our approach to higher tem-peratures found near the bedrock would be unreliable. Ap-plying our approach to several O2/ N2records from different ice cores might enable us to derive reliable temperature sen-sitivities of the parameters.
252 B. Bereiter et al.: Diffusive equilibration of N2, O2and CO2mixing ratios
4 Gas diffusion in deep ice cores
In this section we present the results of the diffusive gas equilibration of trapped CO2and O2/ N2signals in deep ice cores during the movement of the gas enclosures near the surface to the bedrock, as obtained by the model described in Sect. 2.1. In all experiments, the simulation starts with a si-nusoidal CO2concentration and O2/ N2ratio variation with an amplitude of 50 ppmv and 5 ‰, respectively, as shown in Fig. 6. The period of the variations are changed between 100, 40, 20, 5 and 1 kyr by adjusting the temporal length of the simulated windows accordingly. In the example of Fig. 6, a window length of 10 kyr has been used which corresponds to a period of 20 kyr. One simulation has been run for most of the possible combinations of the two different ice flow and temperature profiles of the EDC and oldest ice core (see Fig. 1), the two gas permeation parameter sets (SS and FS, see Fig. 2) and the different signal periods (100, 40, 20, 5 and 1 kyr) resulting in 15 runs in total. The resulting amplitude dampening factors derived from these simulations are sum-marised in Figs. 7 and 8. Note that the dampening factors are not only controlled by the duration of the diffusion process, but also by the ice temperature and layer thickness, which both change during the advection of the ice from the surface to the bottom of the ice sheet. Accordingly, the basic rule for diffusive processes, that diffusion time (and thus dampening) scales with the square of the diffusion length (thus with the length of some oscillation in metres of ice) is not strictly ap-plicable here.
The five periods, which we have chosen for the simu-lations, roughly represent some typical oscillations of the CO2 concentration or the O2/ N2 ratio found in ice cores: (A) 100 kyr represents CO2 variations associated with the 100 kyr glacial–interglacial cycles (Lüthi et al., 2008), (B) 40 kyr represents CO2variations expected during the 40 kyr glacial–interglacial cycles, (C) 20 kyr represents precessional O2/ N2variations (Kawamura et al., 2007), (D) 5 kyr repre-sents CO2 variations associated with carbon dioxide max-ima/antarctic isotope maxima (CDM/AIM) events (Bereiter et al., 2012), and (E) 1 kyr represents about the minimum pe-riod that does get trapped in low accumulation ice cores with-out significant dampening by gas diffusion in the firn column (Spahni et al., 2003). The discussion below about the O2/ N2 ratio focuses on the orbital 20 kyr period since it is the only relevant feature found so far in this proxy. For the CO2 con-centration the 100 kyr, 40 kyr and 5 kyr periods are most im-portant. However, in the figures the results for all periods are plotted for completeness.
The results of the EDC simulations (Fig. 7) show that neither the relevant periods of CO2 (5 kyr and higher) nor of O2/ N2 (20 kyr) are strongly affected by the vertical gas exchange in this core, independent of the parameter sets used. For the 5 kyr period in CO2 the dampening factor af-ter 800 kyr (oldest part of the undisturbed EDC ice core) lies at 5 %, whereas larger periods are not affected at all. The
am-Gas diffusion in oldest ice core 16 December 2013
Fig. 6
Page 26 622
623
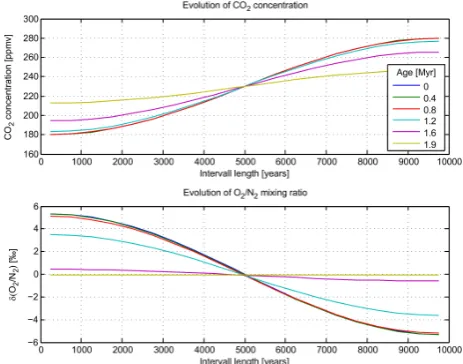
Fig. 6. Example of the model performance showing the simulated
changes of the CO2concentration (top) and the O2/ N2ratio
(bot-tom) for the oldest ice core ice flow and temperature profile (Fig. 1) using the SS parameters. The starting gas distribution (dark blue line) is half of a sinusoidal oscillation (period 20 kyr) with an am-plitude of 50 ppmv (CO2) and 5 ‰ (O2/ N2) over the complete
sim-ulated time window of 10 kyr. The different coloured lines represent simulated distributions after a certain duration in the ice as indicated by the legend (in million years [Myr]). This simulation is used to calculate the amplitude dampening of the 20 kyr signal (see Fig. 8).
plitude dampening factor for the 20 kyr period in the O2/ N2 signal after 800 kyr is 7 % at maximum. Such small dampen-ers are currently not identifiable since no independent records from another ice core exist for comparison. As the O2/ N2 model results using the FS parameters show the maximum possible effect that is still in line with the EDC gas records, in which no signal equilibration has been identified so far, the O2/ N2 results for the oldest ice core simulations using the FS parameters can be interpreted as an upper limit of the equilibration effect that has to be expected. Since no other ice core reaches as far back in time as the EDC ice core and the accumulation rate and, hence, the annual layer thickness is relatively small in this ice core, we may safely conclude that vertical diffusion of gases in the ice does not substantially affect any ice core analysed to date.
B. Bereiter et al.: Diffusive equilibration of N2, O2and CO2mixing ratios 253
Gas diffusion in oldest ice core 16 December 2013
Fig. 7
Page 27 624
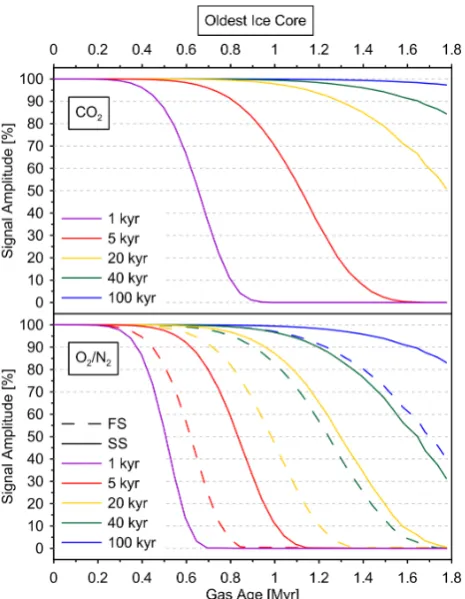
Fig. 7. Simulated amplitude dampening of CO2concentration (top)
and O2/ N2ratio (bottom) signals for the EDC ice flow and
temper-ature profile (Fig. 1). The different coloured lines show the results for different periods of the signal as indicated by the legend.
this result depends critically on the used value for the CO2 permeability in ice. Here we use the value derived by Ahn et al. (2008), which, however, has not been experimentally reproduced yet.
In the case of the trapped O2/ N2ratio, the two parame-ter sets provide clearly different results (Fig. 8). While the SS simulates almost no influence on the 20 kyr period after 0.9 Myr, the FS simulations show already a significant damp-ing of about 30 %. This is substantially more compared to what the model simulates for ice of similar age under EDC conditions using the same parameter set. The reason is the much stronger thinning of the ice older than about 600 kyr in the oldest ice core relative to the EDC ice (see Fig. 1), caus-ing stronger diffusive equilibration in that ice. After 1.5 Myr both parameter sets show a strong equilibration of the O2/ N2 signal even for the 40 kyr period. For the 20 kyr period the FS simulation shows a nearly complete equilibration already after 1.3 Myr. In the SS simulations this signal is preserved with a dampening of the original amplitude by 80 % after 1.5 Myr.
In addition to the uncertainties in the gas parameters, also the oldest ice core parameters (Table 1) are not well con-strained. We have tested the oldest ice core simulations for
differences in the tuning parameterp and the bedrock tem-perature (see Supplement). As mentioned in Sect. 2.2, the tuning factorpof the oldest ice core simulations might be too high and thinning in the deep part might be overestimated. The test with apvalue equal to the one of the EDC simu-lations shows a 15 % smaller dampening relative to the stan-dard simulation with a total dampening of the original am-plitude by 65 % after 1.5 Myr. The results with a 5 K lower bedrock temperature show a similar influence compared to the standard simulation. In regard to the large uncertainties of the gas parameters, the uncertainties in thep value and the bedrock temperatures are of secondary importance.
As mentioned in Sect. 3, an estimate of total air perme-ation in ice suggests lower permeability than the SS param-eters at temperatures near the bedrock (Uchida et al., 2011). The same estimate suggests also a higher permeability for temperatures below the BCTZ which is not supported by the results in Sect. 3. Nevertheless, we tested the influence of lower permeabilities by running two oldest ice core simula-tions (20 kyr period) where in one case downscaled FS pa-rameters, and in the other case downscaled SS parameters were used (see Supplement). The results suggest that also with such low air permeabilities the precessional O2/ N2 sig-nal is dampened by 50 % in the 1.5 Myr old ice.
254Gas diffusion in oldest ice core B. Bereiter et al.: Diffusive equilibration of N16 December 2013 2, O2and CO2mixing ratios
Fig. 8
Page 28 625
626
Fig. 8. Simulated amplitude dampening of CO2concentration (top)
and O2/ N2ratio (bottom) signals for the oldest ice core ice flow
and temperature profile (Fig. 1). The different coloured lines show the results for different periods of the signal as indicated by the legend.
as assumed here or are strongly inhomogeneous on a scale of centimetres to metres. This clearly illustrates the need for more research on the permeation of gases in glacier ice to derive robust permeability estimates.
Changes of the ice properties are not included in our model. The size of the ice grains increases with depth (Du-rand et al., 2009). Larger ice grains might influence the gas permeability of the ice. With increasing depth and tem-perature water veins may be present along ice grain junc-tions in the deep part of the ice (Pol et al., 2010), which might increase the gas transport. However, a marginal frac-tion of clathrates is located along grain boundaries in deep ice (Uchida et al., 2011) and, hence, this effect is expected to be small. Finally, clathrates grow with increasing depth (Uchida et al., 2011), but how this influences the gas exchange be-tween the clathrates is not clear.
Most gases trapped in ice have a lower permeability through the ice lattice than the water molecules of the ice itself since the gas molecules need to go through the step of dissolution in the ice before they can diffuse through the lattice. In addition, in deep ice warmer than 263 K, such as in the EDC core below 2900 m depth, diffusion along water
veins at ice grain junctions is suggested to increase the diffu-sivity of water molecules causing a doubling of the diffusion length for stable water isotopes to 40 cm near the bedrock (Pol et al., 2010). In our artificial oldest ice cores, a water isotope signal associated with a glacial–interglacial cycle of 40 kyr duration will cover a vertical extent of only a few me-ters in the 1.5 Myr old part. Considering the roughly three times larger residence time of the ice in conditions above 263 K (roughly 700 kyr, see example Fig. 1) compared to the EDC core, the diffusion length for water isotopes is expected to increase to 1 m and more. In such a case the 40 kyr isotope signal could be completely lost and trapped gases as well as particulate mineral dust aerosol might then be the only proxy that allows reconstructions of the past glacial–interglacial cy-cles back to 1.5 Myr. In order to avoid a complete disappear-ance of the 40 kyr isotope signal, the bedrock ice temperature must be below 263 K.
5 Conclusions
The simulation of vertical diffusion of trapped gases in an ice sheet and the associated influence on the air composition in ice cores confirms that CO2and O2/ N2records from exist-ing ice cores do not suffer from a significant signal loss by gas diffusion. With regard to the IPICS target of retrieving a 1.5-million-years-old ice core, however, this signal loss be-comes significant. The results presented here show that the vertical gas exchange will start to considerably influence the CO2variations associated with glacial–interglacial changes and precessional O2/ N2 changes in ice older than 1 Myr. For 1.5 Myr old ice the estimated amplitude damping of a 40 kyr glacial–interglacial CO2 variation is on the order of 5 % suggesting that CO2variations associated with glacial– interglacial changes are likely to be preserved in the 1.5 Myr old ice. The damping of precessional O2/ N2changes with a period of 20 kyr lies in the range of 50–80 % after 1.5 Myr. A worst case scenario is that after 1.3 Myr the signal has vir-tually equilibrated. This suggests that O2/ N2 variations as-sociated with orbital changes will be significantly dampened or may even have completely disappeared in the deep part of the oldest ice core. Depending on the effective impact of this process, ice core dating by tuning the O2/ N2ratio varia-tions to orbital parameters (Kawamura et al., 2007) could be problematic.
B. Bereiter et al.: Diffusive equilibration of N2, O2and CO2mixing ratios 255
constrained. Nevertheless, the method presented here can provide further constraints on the permeation of gas in ice and might also provide better temperature sensitivities in fu-ture investigations by applying it to records of different ice cores. The reason for the too high FS values is not clear, how-ever, it is likely that the air permeability of natural ice is also influenced by its crystallographic structure. The FS values have been derived by molecular simulations taking into ac-count a monocrystalline ice structure (Ikeda-Fukazawa et al., 2004), whereas polar ice has a polycrystalline structure pos-sibly leading to a reduction of the permeability. Once such an oldest ice core is drilled and the dampening profiles of the different gases are measured, an independent and quantita-tive estimate of the permeabilities can be deduced by invert-ing the model presented in this work.
Water isotopes are generally more mobile in the ice than the trapped gases. Therefore, the signal equilibration due to molecular diffusion is likely to be stronger for water iso-tope signals. Under conditions expected for the oldest ice core and used for the simulations here, it is expected that glacial–interglacial cycles recorded in the water isotopes will be damped substantially in 1.5 Myr old ice. It is possible that this signal will have completely vanished in such an ice core. In this case, trapped gases and mineral dust may be the only palaeo-climate indicators in this archive that will show glacial–interglacial cycles. Ice temperatures near the bedrock of below 263 K are required to preserve the isotope signal (Pol et al., 2010).
Supplementary material related to this article is
available online at http://www.the-cryosphere.net/8/245/ 2014/tc-8-245-2014-supplement.pdf.
Acknowledgements. This work is funded by the Swiss National
Science Foundation. We thank B. Stauffer for sharing his valuable experience and giving helpful inputs to this work.
Edited by: K. Kawamura
References
Ahn, J., Headly, M., Wahlen, M., Brook, E. J., Mayewski, P. A., and Taylor, K. C.: CO2diffusion in polar ice: observations from
naturally formed CO2spikes in the Siple Dome (Antarctica) ice core, J. Glaciol., 54, 685–695, 2008.
Bender, M. L.: Orbital tuning chronology for the Vostok climate record supported by trapped gas composition, Earth Planet. Sci. Lett., 204, 275–289, 2002.
Bereiter, B., Schwander, J., Lüthi, D., and Stocker, T. F.: Change in CO2 concentration and O2/ N2 ratio in ice cores due
to molecular diffusion, Geophys. Res. Lett., 36, L05703, doi:10.1029/2008GL036737, 2009.
Bereiter, B., Lüthi, D., Siegrist, M., Schüpbach, S., Stocker, T. F., and Fischer, H.: Mode change of millennial CO2variability
dur-ing the last glacial cycle associated with a bipolar marine carbon seesaw, P. Natl. Acad. Sci., 109, 9755–9760, 2012.
Durand, G., Svensson, A., Persson, A., Gagliardini, O., Gillet-Chaulet, F., Sjolte, J., Montagnat, M., and Dahl-Jensen, D.: Evo-lution of the texture along the EPICA Dome C ice core, Physics of ice core records II, 68, 91–105, 2009.
Elderfield, H., Ferretti, P., Greaves, M., Crowhurst, S., McCave, I. N., Hodell, D., and Piotrowski, A. M.: Evolution of Ocean Tem-perature and Ice Volume Through the Mid-Pleistocene Climate Transition, Science, 337, 704–709, 2012.
Enting, I. G.: On the use of smoothing splines to filter CO2data, J.
Geophys. Res., 92, 10977–10984, 1987.
EPICA community members: One-to-one coupling of glacial cli-mate variability in Greenland and Antarctica, Nature, 444, 195– 198, 2006.
Fischer, H., Severinghaus, J., Brook, E., Wolff, E., Albert, M., Ale-many, O., Arthern, R., Bentley, C., Blankenship, D., Chappellaz, J., Creyts, T., Dahl-Jensen, D., Dinn, M., Frezzotti, M., Fujita, S., Gallee, H., Hindmarsh, R., Hudspeth, D., Jugie, G., Kawamura, K., Lipenkov, V., Miller, H., Mulvaney, R., Parrenin, F., Pattyn, F., Ritz, C., Schwander, J., Steinhage, D., van Ommen, T., and Wilhelms, F.: Where to find 1.5 million yr old ice for the IPICS “Oldest-Ice” ice core, Clim. Past, 9, 2489–2505, doi:10.5194/cp-9-2489-2013, 2013.
Huber, C., Leuenberger, M., and Zumbrunnen, O.: Continuous Ex-traction of Trapped Air from Bubble Ice or Water for On-Line Determination of Isotope Ratios, Anal. Chem., 75, 2324–2332, 2003.
Ikeda-Fukazawa, T., Kawamura, K., and Hondoh, T.: Mechanism of Molecular Diffusion in Ice Crystals, Molecular Simulation, 30, 973–979, 2004.
Ikeda-Fukazawa, T., Fukumizu, K., Kawamura, K., Aoki, S., Nakazawa, T., and Hondoh, T.: Effects of molecular diffusion on trapped gas composition in polar ice cores, EPSL, 229, 183–192, 2005.
Jouzel, J., Masson-Delmotte, V., Cattani, O., Dreyfus, G., Falourd, S., Hoffmann, G., Minster, B., Nouet, J., Barnola, J., Chappel-laz, J., Fischer, H., Gallet, J. C., Johnsen, S., Leuenberger, M., Loulergue, L., Lüthi, D., Oerter, H., Parrenin, F., Raisbeck, G., Raynaud, D., Schilt, A., Schwander, J., Selmo, E., Souchez, R., Spahni, R., Stauffer, B., Steffensen, J. P., Stenni, B., Stocker, T. F., Tison, J., Werner, M., and Wolff, E. W.: Orbital and millennial Antarctic climate variability over the last 800,000 years, Science, 317, 793–796, 2007.
Kawamura, K., Parrenin, F., Lisiecki, L., Uemura, R., Vimeux, F., Severinghaus, J. P., Hutterli, M. A., Nakazawa, T., Aoki, S., Jouzel, J., Raymo, M. E., Matsumoto, K., Nakata, H., Motoyama, H., Fujita, S., Goto-Azuma, K., Fujii, Y., and Watanabe, O.: Northern Hemisphere forcing of climatic cycles in Antarctica over the past 360,000 years, Nature, 448, 912–917, 2007. Lliboutry, L.: A critical review of analytical approximate solutions
for steady state velocities and temperature in cold ice sheets, Z. Gletscherkd. Glacialgeol, 15, 135–148, 1979.
concentra-256 B. Bereiter et al.: Diffusive equilibration of N2, O2and CO2mixing ratios
tion record 650,000–800,000 years before present, Nature, 453, 379–382, 2008.
Lüthi, D., Bereiter, B., Stauffer, B., Winkler, R., Schwander, J., Kindler, P., Leuenberger, M., Kipfstuhl, S., Capron, E., Landais, A., Fischer, H., and Stocker, T. F.: CO2and O2/ N2variations
in and just below the bubble–clathrate transformation zone of Antarctic ice cores, Earth Planet. Sci. Lett., 297, 226–233, 2010. NEEM community members: Eemian interglacial reconstructed from a Greenland folded ice core, Nature, 493, 489–494, 2013. Parrenin, F., Barnola, J.-M., Beer, J., Blunier, T., Castellano, E.,
Chappellaz, J., Dreyfus, G., Fischer, H., Fujita, S., Jouzel, J., Kawamura, K., Lemieux-Dudon, B., Loulergue, L., Masson-Delmotte, V., Narcisi, B., Petit, J.-R., Raisbeck, G., Raynaud, D., Ruth, U., Schwander, J., Severi, M., Spahni, R., Steffensen, J. P., Svensson, A., Udisti, R., Waelbroeck, C., and Wolff, E.: The EDC3 chronology for the EPICA Dome C ice core, Clim. Past, 3, 485–497, doi:10.5194/cp-3-485-2007, 2007a.
Parrenin, F., Dreyfus, G., Durand, G., Fujita, S., Gagliardini, O., Gillet, F., Jouzel, J., Kawamura, K., Lhomme, N., Masson-Delmotte, V., Ritz, C., Schwander, J., Shoji, H., Uemura, R., Watanabe, O., and Yoshida, N.: 1-D-ice flow modelling at EPICA Dome C and Dome Fuji, East Antarctica, Clim. Past, 3, 243–259, doi:10.5194/cp-3-243-2007, 2007b.
Petit, J. R., Jouzel, J., Raynaud, D., Barkov, N. I., Barnola, J., Basile, I., Bender, M., Chappellaz, J., Davis, M., Delaygue, G., Del-motte, M., Kotlyakov, V. M., Legrand, M., Lipenkov, V. Y., Lo-rius, C., Pépin, L., Ritz, C., Saltzman, E., and Stievenard, M.: Climate and atmospheric history of the past 420,000 years from the Vostok ice core, Antarctica, Nature, 399, 429–436, 1999. Pol, K., Masson-Delmotte, V., Johnsen, S., Bigler, M., Cattani, O.,
Durand, G., Falourd, S., Jouzel, J., Minster, B., Parrenin, F., Ritz, C., Steen-Larsen, H. C., and Stenni, B.: New MIS 19 EPICA Dome C high resolution deuterium data: Hints for a problematic preservation of climate variability at sub-millennial scale in the “oldest ice”, Earth Planet. Sci. Lett., 298, 95–103, 2010.
Salamatin, A. N., Lipenkov, V. Y., and Blinov, K. V.: Vostok (Antarctica) climate record time-scale deduced from the analysis of a borehole-temperature profile, Ann. Glaciol., 20, 207–214, 1994.
Salamatin, A. N., Lipenkov, V. Y., Barkov, N., Jouzel, J., Petit, J. R., and Raynaud, D.: Ice core age dating and paleothermometer calibration based on isotope and temperature profiles from deep boreholes at Vostok Station (East Antarctica), J. Geophys. Res., 103, 8963–8977, 1998.
Salamatin, A. N., Lipenkov, V. Y., Ikeda-Fukazawa, T., and Hondoh, T.: Kinetics of air-hydrate nucleation in polar ice sheets, Journal of Crystal Growth, 223, 285–305, 2001.
Schwander, J., Sowers, T., Barnola, J., Blunier, T., Fuchs, A., and Malaizé, B.: Age scale of the air in the Summit ice: Implication for glacial-interglacial temperature change, J. Geophys. Res., 102, 19483–19493, 1997.
Spahni, R., Schwander, J., Flückiger, J., Stauffer, B., Chappellaz, J., and Raynaud, D.: The attenuation of fast atmospheric CH4
variations recorded in polar ice cores, Geophys. Res. Lett., 30, 1571, doi:10.1029/2003GL017093, 2003.