Atmos. Meas. Tech., 10, 1623–1637, 2017 www.atmos-meas-tech.net/10/1623/2017/ doi:10.5194/amt-10-1623-2017
© Author(s) 2017. CC Attribution 3.0 License.
The ion trap aerosol mass spectrometer: field intercomparison with
the ToF-AMS and the capability of differentiating organic
compound classes via MS-MS
Johannes R. W. Fachinger1, Stéphane J. Gallavardin1,2, Frank Helleis3, Friederike Fachinger1, Frank Drewnick1, and Stephan Borrmann1,2
1Particle Chemistry Department, Max Planck Institute for Chemistry, Mainz, 55128, Germany 2Institute for Atmospheric Physics, Johannes Gutenberg University Mainz, Mainz, 55128, Germany 3Max Planck Institute for Chemistry, Mainz, 55128, Germany
Correspondence to:Stephan Borrmann ([email protected]) Received: 8 November 2016 – Discussion started: 1 December 2016 Revised: 4 April 2017 – Accepted: 5 April 2017 – Published: 27 April 2017
Abstract. Further development and optimisation of a pre-viously described ion trap aerosol mass spectrometer (IT-AMS) are presented, which resulted in more reproducible and robust operation and allowed for the instrument’s first field deployment. Results from this 11-day-long measure-ment indicate that the instrumeasure-ment is capable of providing quantitative information on organics, nitrate, and sulfate mass concentrations with reasonable detection limits (0.5– 1.4 µg m−3for 1 h averages) and that results obtained with the IT-AMS can directly be related to those from Aero-dyne aerosol mass spectrometers. The capability of the IT-AMS to elucidate the structure of fragment ions is demon-strated via an MS4study on tryptophan. Detection limits are demonstrated to be sufficiently low to allow for MS2studies not only in laboratory but also in field measurements under favourable conditions or with the use of an aerosol concen-trator. In laboratory studies the capability of the IT-AMS to differentiate [C4Hy]+and [C3HyO]+fragments at the
nomi-nalm/z55 and 57 via their characteristic fragmentation pat-terns in MS2experiments is demonstrated. Furthermore, with the IT-AMS it is possible to distinguish between fragments of the same elemental composition ([C2H4O2]+ atm/z60 and [C3H5O2]+atm/z73) originating from different com-pound classes (carboxylic acids and sugars) due to their dif-ferent molecular structure. These findings constitute a proof of concept and could provide a new means of distinguish-ing between these two compound classes in ambient organic aerosol.
1 Introduction
Despite the fact that atmospheric aerosol particles have an important influence on air quality, public health, and the cli-mate system, the knowledge on the influence of individual aerosol particle chemical components remains limited (Fuzzi et al., 2015). One main contributor to fine particulate matter is organic aerosol (Kanakidou et al., 2005), which includes a large variety of different, to a large part unknown, organic molecules (Goldstein and Galbally, 2007).
Much work has been invested in the past in order to chemi-cally characterise the organic material present within the am-bient aerosol, mostly using mass spectrometric techniques (Hoffmann et al., 2011). For offline analyses of filter sam-ples from atmospheric aerosol particles, mass spectrometry is often coupled to chromatographic methods for prior sep-aration of the organic compounds (Pratt and Prather, 2012), while with the most commonly used online techniques either single particles (Murphy, 2007; Silva and Prather, 2000) or small ensembles of particles (Canagaratna et al., 2007) are analysed without prior separation of substances.
Currently, the most widely used instrument deploying the latter method is the Aerodyne aerosol mass spectrometer (AMS, Aerodyne Inc.; Jayne et al., 2000), in which ensem-bles of particles are flash-vaporised at typically∼600◦C and the evolving vapour is ionised by electron impact ionisation before mass spectrometric analysis, usually with a time-of-flight mass spectrometer (ToF-AMS; Drewnick et al., 2005; DeCarlo et al., 2006). Since a large number of different
molecules are analysed simultaneously, a mathematical de-convolution algorithm has to be applied to the acquired mass spectra in order to obtain information on different particle components (Allan et al., 2004). Due to the thermal desorp-tion (which already might cause some fragmentadesorp-tion) and additional “hard” electron impact ionisation, molecules are highly fragmented, which means a partial loss of the origi-nal molecular information (e.g. typically no molecular ion is observed). At the same time, since different molecules con-taining the same substructure will be reduced to the same fragment ions, this considerably reduces the complexity of information when dealing with mixtures of a large variety of different organic compounds (Hoffmann et al., 2011) while some important information on the original molecular struc-tures are still retained in these common fragment ions, which enables the determination of “types” of organic particle con-stituents using positive matrix factorisation (Zhang et al., 2011).
The differentiation of organic components can be further constrained and improved using the higher-resolution ToF-AMS, which has a mass resolution of∼2000 or∼4000 in two modes providing higher and lower sensitivity, respec-tively (DeCarlo et al., 2006). With these resolutions, it is possible to distinguish between isobars, i.e. ion fragments of the same nominal mass-to-charge ratio (m/z)but with differ-ent elemdiffer-ental compositions. For example, a promindiffer-ent mass spectral signal at m/z55 is observed in both hydrocarbon-like (traffic-related) and cooking-related organic aerosol. While this signal seems to be related mostly to [C4H7]+in hydrocarbon-like organic aerosol, an additional large fraction of [C3H3O]+at the same nominalm/zis found for cooking-related organic aerosol (Sun et al., 2011).
While information on elemental composition of the frag-ment ions can be obtained with the ToF-AMS, it does not allow for the differentiation between fragment ions of the same elemental composition but with different structural for-mulas (i.e. isomeric ions). Such information can be obtained using ion trap mass spectrometers (March, 1997), which not only allow for measuring a “classic” mass spectrum (MS) but also enable MSnstudies. In such experiments, ions of a single nominalm/zare first isolated and then fragmented by collisions with buffer gas atoms (collision-induced dissocia-tion, CID). The resulting fragment ions can be mass scanned, which provides the mass spectrum of the fragment ions (MS-MS, or MS2), or again ions of a certainm/z can be sepa-rated and fragmented, and so on (MSn). From the fragment ions and fragmentation pathways, conclusions on the molec-ular structure of the parent ion can be drawn (March, 1997; McLafferty and Tureˇcek, 1993). Additionally, ion–molecule reactions inside the ion trap can be utilised in order to differ-entiate between isobaric or isomeric ions (e.g. Kascheres and Cooks, 1988).
Due to their capability to elucidate the molecular struc-ture of organic molecules, ion traps are often coupled to “soft” ionisation techniques in order to preserve the
molecu-lar structure of the compounds of interest as much as possi-ble. For atmospheric applications, for example vacuum ultra-violet single photon ionisation (Hanna et al., 2009; Schramm et al., 2009), proton transfer reaction (Thornberry et al., 2009), and atmospheric pressure chemical ionisation (Vogel et al., 2013), have been successfully applied in conjunction with ion trap mass spectrometry. Kürten et al. (2007) intro-duced an instrument which represents a synthesis of an AMS ionisation chamber (thermal desorption/electron impact ioni-sation) with a quadrupole ion trap mass spectrometer; a sim-ilar instrument was also developed by Harris et al. (2007). With these systems, a strong reduction in complexity of am-bient organic aerosol mass spectra (which consist of a large number of different organic molecules) is achieved compared to “soft” ionisation techniques, while still some additional information, e.g. on molecular functionality, can be obtained which is not accessible from ToF-AMS measurements.
Here, we present further design improvements of the ion trap aerosol mass spectrometer (IT-AMS) originally intro-duced by Kürten et al. (2007). Technical improvements en-able more robust and reproducible measurements with this instrument since the work of Kürten et al. (2007) and allowed for the instrument’s first field deployment. We show how the IT-AMS compares with a regular ToF-AMS and demonstrate its MSncapability up to MS4, also providing an estimate of the related detection limits. Finally, from MS2studies on var-ious compounds, we demonstrate how the IT-AMS is capa-ble of distinguishing between isomeric fragment ions, which could provide a means to distinguish between carboxylic acids and sugars in organic aerosol and, with more extensive calibration, potentially also to quantify their relative frac-tions in more complex mixtures. Since sugars and carboxylic acids can be associated with different aerosol sources (sug-ars originate e.g. from biomass burning or primary biological material, while carboxylic acids originate e.g. from photo-oxidation of organic precursors; Graham et al., 2003), this would help in further improving the differentiation of vari-ous organic aerosol components and therefore in source ap-portionment of atmospheric organic aerosol.
2 Instrumental developments
J. R. W. Fachinger et al.: The ion trap aerosol mass spectrometer 1625
Aerodynamic
lens Shutter
Filament Vaporiser Ion optics
Ion trap Channeltron
detector
10-6hPa Helium supply
P
e
-+
Trapping phase
e
-+
Deflection plate
-Ion source
Ion source
Trapping phase (a)
(b)
(c)
e
-e
-e
-e
-e
-Analysis phase
e
-Deflection plate
+
Ion source
Ion source
Analysis phase
TMP TMP TMP
TMP
~ 24 mL min-1 He
He
10-4hPa
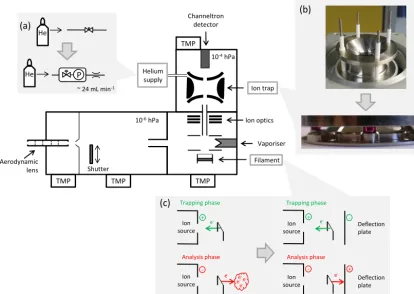
Figure 1. Schematics of the IT-AMS. The insets(a)–(c)visualise the major hardware modifications (compared to Kürten et al., 2007) described in the main text. (TMP: turbo molecular pump; photographs from Fachinger, 2012.)
mass spectra (open minus closed) originating purely from the particle beam (Canagaratna et al., 2007). In the ionisa-tion chamber the particles are flash-vaporised on a hot tung-sten surface (∼600◦C), and the resulting vapour is ionised by electron impact ionisation (70 eV). The ions are extracted through ion optics to the quadrupole ion trap, which con-sists of a ring electrode and two hyperbolical end cap elec-trodes with modified angle geometry with r0=1 cm and
z0=r0/
√
1.9=0.725 cm, where r0 andz0 are the shortest distances from the centre of the trap to the ring and end cap electrodes, respectively. In the ion trap, the ions can be stored and manipulated; ions leaving the trap are then detected us-ing a Channeltron (KBL510, Sjuts). High-purity helium (6.0, Westfalen AG) is used as buffer gas in the ion trap. Mass spectral resolution depends on the settings (Kürten et al., 2007) and was∼400 for the measurements described here.
While the instrument described in Kürten et al. (2007) was capable of providing quantitative information on aerosol components, it suffered from a lack of user-friendliness and from limited long-term stability and reproducibility of the settings. Therefore, in order to prepare the instrument for field measurements and regular laboratory applications, sev-eral hardware (electronic and mechanical) as well as in-strument control software modifications were performed, all aiming at a more robust, versatile, and user-friendly
oper-ation of the instrument. The operoper-ation principles for the MS and MSnmeasurements, e.g. mass range extension, ion isola-tion, and ion excitation and fragmentaisola-tion, were nevertheless kept the same. We only describe the most important changes in detail here; these as well as some other, minor modifica-tions are also described in Fachinger (2012).
Most importantly, three hardware modifications related to the mechanical design of the instrument were realised (see Fig. 1, inserts):
– In the ion trap, originally ceramic washers of 2.87 mm±25 µm thickness were used by Kürten et al. (2007) as spacers between the ring and end cap elec-trode, and the electrodes were held by four threaded bars insulated by ceramic shells with a play of 0.5 mm each. Due to these rather large allowances for tolerance, the electrodes could not be assembled reproducibly enough to maintain the geometry (i.e. without rotation or tilt-ing of the electrodes), and after each re-assembly of the electrodes the voltage settings for the various opera-tions (e.g. trapping, scanning, resonant excitation) had to be re-tuned. To avoid this, now four ruby spheres (diameter 6 mm±0.635 µm) sitting in precise counter-sinks (1.3 mm±10 µm) are used instead of the ceramic washers for a more defined mounting (Fig. 1b). This al-lows for a more reproducible assembly of the electrodes
(i.e. invariant geometry) and consequently more repro-ducible voltage settings without needing to re-tune after each re-assembly of the ion trap electrodes.
– In order to ensure stable and reproducible ion signal intensities, constant helium pressure in the ion trap is needed, which is achieved in the IT-AMS by a con-stant inlet mass flow of helium and concon-stant pump-ing speed. In the original set-up, this helium inlet flow was regulated via a needle valve and therefore changed with changing ambient (upstream) pressure (over the course of 4 days, a relative standard deviation of 2 % was found at an average pressure of 2×10⁻⁵hPa mea-sured outside the trap). Now, constant inlet mass flow is provided by a critical orifice (30 µm inner diameter) with constant upstream pressure ensured by a pressure-controlled mass flow controller (Bronkhorst High-Tech B.V., EL-PRESS P-502-C and F-004AC with a speci-fied flow rate of≤0.7 L min−1; Fig. 1a). With this sys-tem, the pressure inside the system (7×10⁻⁵hPa, mea-sured outside the trap) was found to be stable within less than 1 % (relative standard deviation of 15 s data) over the course of 11 days.
– The ion trap needs a pulsed ion source so that ions are only generated and transmitted to the ion trap during the trapping phase but not during the analysis phase. This was realised in the original set-up by gating of the ion source cage voltages (Kürten et al., 2007): only during the trapping phase were electrons accelerated into the ion source cage, while in the other phases, they were deflected from it. This led to an instable filament emis-sion current directly after switching the voltages, po-tentially due to the build-up of space charges. Now, a more stable filament emission current is achieved by the use of a modified filament which allows for pulsed ion source operation. In the original filament, the emission of the electrons (defined by the filament current) and the voltage of the filament’s deflection plate were elec-tronically coupled in such a way that emitted electrons always were repelled by the deflection plate and accel-erated away from the filament and towards the ion cage. In the modified filament the deflection plate is electron-ically decoupled from the filament, such that electrons are emitted continuously, but the voltage of the deflec-tion plate can be set independently and switched from negative to positive sign. By this means, electrons emit-ted by the filament are now either deflecemit-ted or absorbed by this deflection plate (Fig. 1c), depending on whether they are needed in the ion source or not. This controlled absorption of the electrons (instead of only repelling them from the ion cage) allows for a more defined gat-ing of the electrons and avoids the potential build-up of space charges.
The IT-AMS is controlled via a program written in Lab-VIEW (v.8.5, National Instruments), which is also utilised for data acquisition. The original software was very rudimen-tary and did not contain several important features needed for a routine deployment of the instrument. Therefore this soft-ware was extended and now includes the option for a semi-automatic tuning of operation parameters, i.e. the instrument is programmed by a user-adaptable text file to automatically scan the various (five for MS, nine for MS2)parameters of interest and to save the results, which then can be inspected to find the optimal set of tuning parameters. The software now also allows for much more flexibility in the measure-ment types and their operating conditions (MS, MS2, MSn>2 (n≤5), mass range extension), programming long series of measurements, and the control of the shutter to enable auto-matic switching between open and closed measurements, as described above. Furthermore, all instrumental settings and parameters are now saved along with the mass spectra after each measurement cycle.
3 Laboratory and field measurements
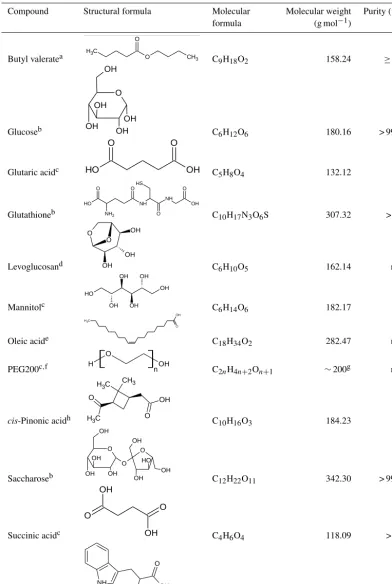
In the laboratory studies performed separately with the IT-AMS and the ToF-IT-AMS, respectively, particles were typi-cally generated from an aqueous solution of the respective substance (Table 1) using a nebuliser (model 3076, TSI Inc.). Oleic acid was dissolved in ethanol instead of water (in case of the ToF-AMS, an aqueous suspension was used), while butyl valerate in both cases was leaked as vapour directly into the instrument. After generation, the aerosol was dried using two consecutive silica gel diffusion driers before sampling with the IT-AMS or high-resolution ToF-AMS (DeCarlo et al., 2006), respectively. For the determination of the MSn detection limits using tryptophan (Sect. 4.2), monodisperse aerosol (130 nm mobility diameter) was generated by clas-sifying the dried particles using a differential mobility anal-yser (model 3081, TSI Inc.). Parallel measurement of particle number concentration using a condensation particle counter (model 3025A, TSI Inc.) enabled the calculation of the sam-pled aerosol mass concentration, assuming spherical parti-cles with the bulk density of tryptophan (1.34 g cm−3).
J. R. W. Fachinger et al.: The ion trap aerosol mass spectrometer 1627
Table 1.Organic substances investigated in the laboratory studies; n/a: not available.
Compound Structural formula Molecular Molecular weight Purity (%) formula (g mol−1)
Butyl valeratea
5
O O C H3 CH3OH C9H18O2 158.24
≥98
Glucoseb
Glucose
b 6180.16
>99.5
Glutaric acid
c 4132.12
99
b OH OH O OH OH OH
C6H12O6 180.16 > 99.5
Glutaric acidc
18
-1
Purity / %
≥98
a
Sigma-Aldrich Chemie GmbH.
b
Carl Roth GmbH + Co. KG.
c
Alfa Aesar GmbH + Co. KG.
d
Fluka Chemie GmbH.
e
Merck KGaA.
f
Polyethylene glycol.
g
Average molecular mass.
h
Aldrich Chem. Co.
5
OH O O H OC5H8O4 132.12 99
Glutathioneb NH2
S H O O O H O OH O NH NH
C10H17N3O6S 307.32 > 98
Levoglucosand OH OH OH O O
C6H10O5 162.14 n/a
Mannitolc OH OH OH OH OH O H
C6H14O6 182.17 99
Oleic acide
OH O C H3 H OH O n
C18H34O2 282.47 n/a
PEG200c,f
Table 1: Organic substances investigated in the laboratory studies. n/a: not available.
Compound
Structural formula
Molecular
formula
Molecular weight /
g mol
-1Purity / %
Butyl valerate
aC
9H
18O
2158.24
≥98
Glucose
bC
6H
12O
6180.16
>99.5
c O O C H3 CH3 OH OH O OH OH OH H OH O
n C2nH4n+2On+1 ∼200g n/a
cis-Pinonic acidh O OH O
C H3
C H3 CH3
C10H16O3 184.23 98
Saccharoseb OH OH OH OH O O H OH O O OH OH
C12H22O11 342.30 > 99.5
Succinic acidc
Table 1: Organic substances investigated in the laboratory studies. n/a: not available.
Compound
Structural formula
Molecular
formula
Molecular weight /
g mol
-1Purity / %
Butyl valerate
aC
9H
18O
2158.24
≥98
Glucose
bC
6H
12O
6180.16
>99.5
Glutaric acid
cC
5H
8O
4132.12
99
Glutathione
bC
10H
17N
3O
6S
307.32
>98
Levoglucosan
dC
6H
10O
5162.14
n/a
Mannitol
cC
6H
14O
6182.17
99
O O C H3 CH3 OH OH O OH OH OH OH O O H O NH2 S H O O O H O OH O NH NH OH OH OH O O OH OH OH OH OH O H OH O OH O
C4H6O4 118.09 > 99
Tryptophanb
C
11H
12OH O
N H2
NH
C11H12N2O2 204.23 n/a
aSigma-Aldrich Chemie GmbH.bCarl Roth GmbH+Co. KG.cAlfa Aesar GmbH+Co. KG.dFluka Chemie GmbH.eMerck KGaA. fPolyethylene glycol.gAverage molecular mass.hAldrich Chem. Co.
Table 2.IT-AMS operating parameters in the MSnstudies.VRFis the amplitude (zero-to-peak) of the radio frequency drive voltage (1.3 MHz) applied to the ring electrode;qzis the stability parameter resulting from the Mathieu equation (March, 1997). The resonance frequency was
experimentally determined.
Trapping phase Reaction phase Resonant excitation
m/z Duration (ms) VRF(V) qz Duration (ms) VRF(V) qz Amplitude (mV) Frequency (kHz)
130 50 700 0.303 150 700 0.303 80 118.5
103 50 700 0.383 150 700 0.383 80 150
77 50 700 0.512 100 700 0.512 120 202
73 50 258–287 0.206–0.228 100 402 0.320 120 152.5 60 50 258–287 0.25–0.278 100 402 0.389 120 186.5 57 50 258–287 0.263–0.296 100 402 0.409 120 196.5 55 50 258–287 0.273–0.314 100 402 0.424 120 204.5
interval 100 mass spectra were averaged, each acquired after 50 ms ion accumulation time), the ToF-AMS with a resolu-tion of 60 s (containing 15 s beam blocked, 15 s open, and 30 s size distribution measurement).
In all laboratory and field measurements, ions were trapped over 50 ms at a radio frequency (1.3 MHz) drive voltage of 250 to 700 V amplitude (zero-to-peak) applied to the ion trap ring electrode. To reach the maximum m/zof 135 used within this work, in the laboratory experiments – if needed – the mass range was extended by applying an ad-ditional voltage of 400 mV amplitude (zero-to-peak) with a frequency of 400 kHz to both end cap electrodes. In MSn experiments, ions ofm/zof interest were isolated (typically within a range of±5m/zbut sometimes up to± ∼15m/z)
by broadband excitation using a filtered noise field (Julian and Cooks, 1993) before they were fragmented using CID (see parameters in Table 2).
Measured IT-AMS mass spectral signals were converted to ion rates (number of measured ions divided by the length of the trapping phase) and integrated to unit mass resolution (UMR) mass spectra using home-built procedures in IGOR Pro (v.6.22, WaveMetrics Inc.) and MATLAB (R2006, Math-Works). High-resolution ToF-AMS data were analysed us-ing SQUIRREL v.1.44 and PIKA v.1.04 and higher (SQUIR-REL, 2016).
From the ToF-AMS field data, organics, nitrate, and sul-fate mass concentrations were determined using the fragmen-tation pattern table (Allan et al., 2004) within SQUIRREL (v.1.51H), which was adjusted to correct for background ef-fects using routinely performed measurements of particle-free air (obtained by inserting a high-efficiency particulate arrestance (HEPA) filter in the sampling line). Ionisation ef-ficiency of the ToF-AMS was determined prior to the cam-paign applying the established method (Canagaratna et al., 2007) using dried NH4NO3particles of known mobility di-ameter (400 nm). A collection efficiency of 50 % was applied following Canagaratna et al. (2007), which resulted in good agreement with other co-located measurements (Fachinger, 2012). Comparison of the 1 min averaged time series of PM1
Figure 2.Comparison of average difference mass spectra measured with the IT-AMS and the ToF-AMS during 11-day-long ambient measurements. Shown are the average mass spectra normalised (af-ter conversion to ion rates) to their respective mass spectral signal atm/z28(a)and the ratio (IT-AMS to ToF-AMS) of these relative signal intensities, colour-coded for the dominant species at the re-spectivem/z(b). Note the logarithmic scaling of theyaxes and that the upper panel’syaxis only starts at 10−5(i.e. ion signals smaller than that are not shown).
calculated by summing all ToF-AMS measured species plus independently measured black carbon (using a Multi-Angle Absorption Photometer (MAAP), model 5012, Thermo Sci-entific) with measurements of total PM1(using an Environ-mental Dust Monitor (EDM) 180, Grimm Aerosol Technik GmbH & Co. KG) gave a correlation of Pearson’sR2=0.91 and a slope of 1.11, i.e. good agreement within the uncer-tainty of the ToF-AMS of∼30 %.
J. R. W. Fachinger et al.: The ion trap aerosol mass spectrometer 1629
signal-to-noise ratio) by summing the mass spectral signal of them/zcontaining the respective species’ dominant ions in them/zrange 30–106 (nitrate:m/z30, 46; sulfate:m/z48, 64, 80, 81, 98; organics: all otherm/zexcept 32, 39, 40).
4 Results and discussion
4.1 Measurement of ambient aerosol: comparability to ToF-AMS results
Figure 2 shows a comparison of the average mass spectra from the IT-AMS and the ToF-AMS, acquired during 11 days of field measurement. The m/z30 and above are colour-coded for the species (organics, nitrate, sulfate) with which they are dominantly associated (see Sect. 3). Here, we dis-cuss general trends on the basis of the campaign average in order to minimise the statistical uncertainty. The same fea-tures are typically also visible when comparing 1 h averaged mass spectra; in that case the observed trends are more dis-tinct at higher absolute mass concentration (i.e. at higher signal-to-noise ratio).
Strong differences between the mass spectra are observed in the m/zrange below 30. Apart from the potential influ-ence of lower ion transmission or lower trapping efficien-cies for lowm/zions in the IT-AMS, this is probably mostly due to the strong influence of charge-transfer reactions in the ion trap during the trapping phase in thism/zrange, e.g. in-volving N+, O+, N+
2, or O
+
2 (Dotan et al., 1997; Hierl et al., 1997). m/z28 (N+2), 32 (O+2), and 40 (Ar+), but also
m/z44 (CO+2), are depleted in the IT-AMS compared to the ToF-AMS mass spectrum, likely due to formation of more stable ions by charge-transfer reactions in the ion trap (Ot-tens et al., 2005). Furthermore, the ratio ofm/z18 tom/z19 (H2O+to H3O+)is much smaller (by more than 99 %) in the IT-AMS mass spectrum compared to that of the ToF-AMS, probably caused by proton transfer reactions occurring in the ion trap (H2O+H2O+→H3O++ ·OH; Cole et al., 2003). In laboratory experiments, we found that with increasing ion accumulation and reaction times, this ratio decreases expo-nentially, converging to a ratio of ∼1:1 at accumulation times≥200 ms. Beside these differences, a plateau of more or less constant relative signal intensity is observed from
m/z20 to 27 for the IT-AMS (Fig. 2a) but not for the ToF-AMS. Kürten (2007) found that this plateau disappears (i.e. the mass spectral pattern in this m/z range becomes more similar to that of the ToF-AMS) when an additional reac-tion time is applied to allow for collisional cooling (Wu and Brodbelt, 1992). It can therefore be considered an artefact. In this work, we focus onm/z30 and above, since the deconvo-lution of ion signal belowm/z30 is complicated due to the contribution of several species to most singlem/z(Allan et al., 2004) and the relatively strong influence of artefacts in thism/zrange.
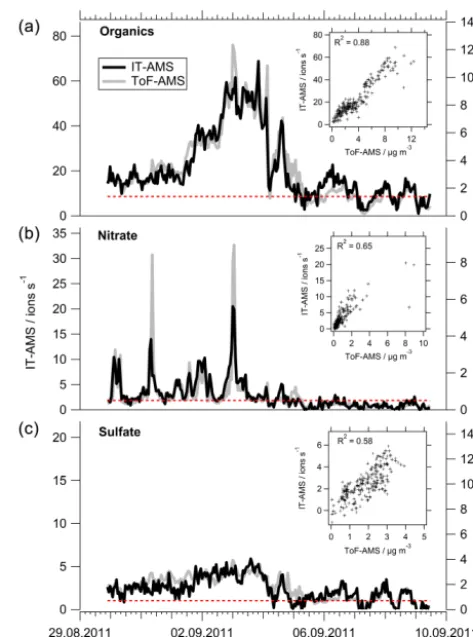
Figure 3.Comparison of 1 h averaged time series of organics(a), nitrate(b), and sulfate(c)measured with the IT-AMS (left and right axes for ion rate and mass concentrations, respectively) and the ToF-AMS (right axis) during 11-day-long ambient measurements. The inlays show the correlation of the respective time series and the associated squared Pearson’s correlation coefficient (R2); the IT-AMS detection limits are marked with red dotted lines. IT-IT-AMS mass concentrations are calculated using the linear correlation with the ToF-AMS time series (inlays).
Considering the organics signal atm/z> 30, most strik-ingly, an increasing signal ratio (IT-AMS/ToF-AMS) with increasing m/zis observed (Fig. 2b). This probably is ex-plained by different ion transmission efficiency curves with respect tom/zfor the two instruments, which can easily be accounted for by calibrations. Importantly, though, the frag-mentation pattern (Fig. 2a) is comparable between both in-struments (Pearson’sR2of 0.78; ifm/z44 – which is influ-enced by charge-transfer reactions inside the trap, see above – is disregarded, R2=0.90) despite the much longer resi-dence time of the ions in the ion trap (50 ms accumulation time) compared to the ToF-AMS. Thus results obtained with the IT-AMS, including MS-MS measurements, are directly transferable to ToF-AMS measurements. This comparability needs to be validated also for other accumulation and reac-tion times.
In contrast, signals of m/zmostly related to sulfate frag-ments are strongly depleted in the IT-AMS compared to the ToF-AMS mass spectrum, and also the fragmentation pat-tern is different. The signal ratio m/z48 tom/z64, which are dominated by the sulfate ion fragments SO+ and SO+2, is 0.8 in the ToF-AMS mass spectrum, but 1.7 in that of the IT-AMS, despite the opposing trend of ion transmission ef-ficiency. Both decomposition of the ions and charge-transfer reactions (with different efficiency for different ions) could cause this ion depletion and fragmentation pattern changes. This needs to be further investigated, also as a function of ac-cumulation and reaction times. Contrarily, for nitrate-related ions, no depletion in the IT-AMS has been found.
Figure 3 shows the measured organics, nitrate, and sulfate concentration time series for both instruments. For the IT-AMS, the results are reported both in ion rates and in mass concentrations, which are calculated using the linear rela-tionships with the ToF-AMS (Fig. 3, inlays). For all three species, the time series measured with IT-AMS and ToF-AMS correlate linearly over the range of observed mass con-centrations (Fig. 3), confirming the capability of the IT-AMS to quantitatively measure species mass concentrations in-dependently using adequate calibrations for all species, as demonstrated for nitrate by Kürten et al. (2007). The squared Pearson’s correlation coefficients for 10 min (1 h) averaged time series are 0.82 (0.88) for organics, 0.68 (0.65) for ni-trate, and 0.37 (0.58) for sulfate (Fig. 3). The much lower cor-relation coefficient for sulfate compared to the other species is in agreement with the observation of much lower response (and therefore lower ion rates and signal-to-noise ratio) of the IT-AMS for sulfate than for nitrate and organics (Figs. 2 and 3). Also the fact that the observed range of mass concen-trations for sulfate was smaller than for organics and nitrate might have added to the less tight correlation for this species. From the calibration of the IT-AMS against the ToF-AMS, furthermore relative ionisation efficiency (RIE) values for sulfate and organics can be calculated for the IT-AMS. The RIE is a constant factor with which the ionisation efficiency (determined in calibrations using ammonium nitrate) is mul-tiplied in order to get the species-dependent ionisation effi-ciency. In order to determine these RIEs, the slope obtained for nitrate from the correlation depicted in Fig. 3 (inlay) is related to those determined for organics and sulfate. By this means, RIE values of 0.4 for sulfate and of 1.7 for organ-ics were found. For organorgan-ics, this is slightly higher than the RIE value of 1.4 used for the ToF-AMS, consistent with the slightly higher ion transmission of the IT-AMS for larger
m/z(to which mostly organics are contributing). For sulfate, the RIE of 0.4 is much smaller than the sulfate RIE value typically used for the ToF-AMS (1.2), consistent with the depletion of sulfate-related ions in the IT-AMS, as described above. It also has to be kept in mind that even without those influences, not exactly the same RIE values as for the ToF-AMS can be expected due to the use of a simplified fragmen-tation pattern table (see Sect. 3).
By calibrating the IT-AMS for nitrate as demonstrated by Kürten et al. (2007), with the RIE values determined here the mass concentrations of sulfate and organics can be di-rectly obtained from IT-AMS measurements. Note, however, that RIE values might change with different accumulation and reaction times and therefore need to be newly mea-sured when changing the instrumental settings. The uncer-tainty of the derived mass concentrations can be estimated to 30 % (which includes the uncertainty due to ionisation efficiency, relative ionisation efficiency, and collection effi-ciency), the same as usually estimated for ToF-AMS mea-surements. Note that with the IT-AMS, unlike the ToF-AMS, ammonium mass concentration cannot be determined due to artefacts in them/z range <m/z30, as described above. Another species typically reported from ToF-AMS measure-ments, nonrefractory chloride, should in principle be possible to detect with the IT-AMS (dominant mass spectral lines at
m/z35 and 36) but has not been observed during this mea-surement due to very low mass concentrations (campaign av-erage of 0.04 µg m−3found with the ToF-AMS).
The mass concentration time series derived from the IT-AMS measurements using the linear correlation with the ToF-AMS measurement (Fig. 3, inlays) within their uncer-tainty agree well with those of co-located measurements: the sum of black carbon (from MAAP) with IT-AMS sulfate, nitrate, and organics and corrected for the missing species ammonium by assuming fully neutralised aerosol (as ex-pected for regional background aerosol and validated by the ToF-AMS measurements) correlates well with the total PM1 mass concentration measured with the EDM (slope=1.03,
R2=0.64 for 1 h data).
Detection limits for organics, nitrate, and sulfate are calcu-lated following the method by Drewnick et al. (2009). Detec-tion limits for 10 min averages are (3.7±1.1) µg m−3for or-ganics, (1.3±0.4) µg m−3for nitrate, and (1.3±0.4) µg m−3 for sulfate (for 1 h averages: (1.4±0.4) µg m−3for organics, (0.5±0.2) µg m−3for nitrate, (0.7±0.2) µg m−3for sulfate). The higher detection limit for organics can be explained by the fact that the mass spectral signal is distributed over a much larger number of m/z(Fig. 2), thereby lowering the signal-to-noise ratio. For all three species, the detection lim-its found for the IT-AMS are 2 to 3 orders of magnitude higher than those reported for the ToF-AMS (DeCarlo et al., 2006; Drewnick et al., 2009) due to much lower ion rates (by 3 orders of magnitude). Thus, the IT-AMS is capable of providing absolute mass concentrations of organics, nitrate, and sulfate at typical ambient concentrations, e.g. in urban areas (i.e. in the order of several µg m−3)after application of adequate calibrations.
4.2 Prospects and limitations of MSnstudies
J. R. W. Fachinger et al.: The ion trap aerosol mass spectrometer 1631
Figure 4.MS2study on glutathione. Shown are the “classic” MS(a)and the mass spectrum acquired after isolating(b)and fragmenting (MS2,c)m/z130. The signal in(c)in them/zrange∼115–130 originates from ions remaining after the isolation step(b). The dashed vertical line in panel(a)divides them/zranges for which the left/rightyaxes are used, respectively.
structural information on the measured ions, while with the ToF-AMS only information on their elemental composition can be obtained.
In this section, we discuss the potential of MSn
stud-ies with the IT-AMS exemplarily by means of results ob-tained for two compounds: glutathione and tryptophan (Ta-ble 1). Their “classic” mass spectra, obtained with the IT-AMS, are shown in Figs. 4a (glutathione) and 5a (trypto-phan). Both show prominent ion signals atm/z130, which judging from the structure of the respective parent molecules are likely from [C5H8O3N]+ (glutathione) and [C9H8N]+ (tryptophan). With the ToF-AMS, these would be possible to distinguish in the mode of highest mass resolution (∼4000) but not in the more sensitive mode of lower mass resolu-tion (∼2000; DeCarlo et al., 2006). With the IT-AMS, they can be distinguished by means of MS-MS (MS2): CID of
m/z130 yields the fragment ions m/z103 ([C8H7]+)and
m/z128 ([C9H6N]+) for tryptophan (Fig. 5b) but m/z83 ([C4H5ON]+) and m/z84 ([C4H6ON]+) for glutathione (Fig. 4c), revealing the different nature of their respective parent ions. It has to be noted that CID in these experiments is found to potentially affect ions in a range of ±1 around the m/zof interest; i.e. in the case of glutathione at least parts of the signal atm/z83 could also originate from CID ofm/z129.
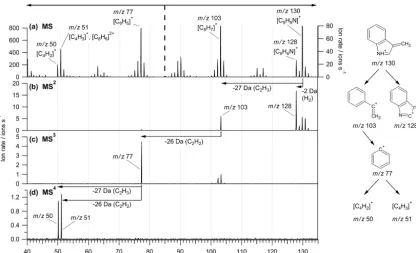
The resulting ions (from MS2)can be further fragmented in order to obtain more detailed information on their molec-ular structure, as shown for tryptophan in Fig. 5c, d: CID
of m/z103 yields m/z77 ([C6H5]+) (MS3); the thereby formed ion atm/z77 can be further fragmented to m/z50 ([C4H2]+) and m/z51 ([C4H3]+) (MS4). When trying to fragment these ions (MS5), no ions (neither remaining parent ions atm/z50/51 nor any fragments) could be detected. This could be because the ions are very stable and therefore are removed from the ion trap, even at very low amplitudes for resonant excitation, or because they are fragmented to ions ofm/z< 20, which were not analysed in the present study.
Further information on the nature of the ions observed in the “classic” MS can be obtained by comparing the CID products of different ions from the original mass spectrum (i.e. MS2of these ions) with those of the fragmentation chain (MS3−5) of larger (parent) fragment ions. While MS2 of
m/z103, 77, and 50 results in the same fragment ions as ob-served in the respective MS3−5studies ofm/z130 presented above, MS2ofm/z51 yields different results. Here,m/z39 ([C3H3]+)andm/z63 ([C5H3]+)are formed, while in the fragmentation chain no further fragmentation was observed for this ion. Therefore, it can be concluded that additionally to the fragmentation product ofm/z77 (i.e. [C4H3]+), the doubly charged ion [C8H6]2+also contributes to m/z51 in the “classic” MS of tryptophan to at least∼10 %. The ions [C4H3]+and [C8H6]2+would not be possible to distinguish with the ToF-AMS.
The detection limits of the tryptophan MSn experiments were calculated following the method by Drewnick et al. (2009) from the standard deviations of the signal
Figure 5.MS4study on tryptophan. Shown are the “classic” MS(a)and mass spectra acquired after isolating and fragmentingm/z130 (MS2,b),m/z103 (MS3, c), andm/z77 (MS4,d) from the respective previous step. The dashed vertical line in panel(a)divides the
m/zranges for which the left/rightyaxes are used, respectively.
sities at the investigatedm/zin a blank MSnmeasurement, and the signal intensity enhancements at the samem/z dur-ing MSn measurements of known tryptophan mass concen-trations. All detection limits were calculated for averages of 3000 mass spectra, which correspond to measurement times of 6, 16, 28, and 46 min for the full MS, MS2, MS3, and MS4 cycles, respectively. The corresponding detection limits were found to be ∼0.6, 7, 13, and 30 µg m−3 at the given mea-surement conditions. This suggests that MS2studies might be feasible under favourable conditions at ambient concen-trations, while MSn>2studies are only possible at high mass concentrations, e.g. in smog chamber studies or by applying an aerosol concentrator.
4.3 Differentiation of organic compound classes
In this section, we investigate how the IT-AMS is capable of distinguishing fragments of the same nominal mass but with different molecular and/or structural formulas. This makes it possible to distinguish not only between, for example, hydrocarbon-like and oxygenated organic species (Zhang et al., 2011) but potentially also between species with differ-ent functional groups, which would allow for the assignmdiffer-ent of measured organic species to different compound classes. This potential is investigated by means of MS2 studies on various substances from different compound classes, partic-ularly sugars and carboxylic acids (Table 1).
4.3.1 Differentiation of ions of the same nominal mass but with different molecular formulas
The differentiation of ions of the same nominalm/zbut with different molecular formulas allows, for example, for the dis-tinction between hydrocarbon-like and oxygenated organic species. This kind of information is also accessible with a high-resolution ToF-AMS, given the resolution at the respec-tivem/zis sufficiently high, and is commonly retrieved from such data (Zhang et al., 2011). Here, we demonstrate how the IT-AMS is also capable of providing such information. Figure 6 shows a compilation of results from MS2studies on
m/z55 and 57 for a variety of compounds. Also shown is the relative contribution of the major ions at thesem/zmeasured with a ToF-AMS (left panels): [C3H3O]+ and [C4H7]+ at
m/z55 and [C3H5O]+and [C4H9]+atm/z57.
When fragmenting the ions at m/z55 and 57 in the IT-AMS (MS2), clear differences in the resulting fragmenta-tion patterns are observed between the different compounds. For sugars (glucose, saccharose, mannitol, and levoglucosan; reddish/brownish colours in Fig. 6), as well as for succinic and glutaric acid (carboxylic acids, bluish colours in Fig. 6), fragmentation occurs predominantly by loss of CO (28 Da, resulting inm/z27 and 29 ions from parent ions atm/z55 and 57, respectively). This points to [C3HyO]+as the
J. R. W. Fachinger et al.: The ion trap aerosol mass spectrometer 1633
Figure 6.Results of studies on(a)m/z55 and(b)m/z57 for various compounds. On the left, the relative contributions of [C3H3O]+and [C4H7]+tom/z55 and of [C3H5O]+and [C4H9]+tom/z57 are given (from ToF-AMS measurements; the difference to 100 % is due to one or several other ions contributing little to the respectivem/z). On the right, the results from IT-AMS MS2studies on these ions are summarised. For each investigated compound, the signal intensity of the fragment ions (relative to the signal intensity of the most abundant fragment) and the ion recovery are given. Not shown are fragments accounting for less than 1 % and, for the MS2experiment onm/z57, small contributions observed at fragment ionm/z31 for mannitol (1 % relative fraction) and atm/z42 for glucose, oleic acid, and butyl valerate (3, 1, and 3 % relative fraction).
results in the fragment ion m/z29 ([COH]+) for MS2 of
m/z55 for some of these compounds. Ion recovery (i.e. the total signal of all fragment ions detected in MS2divided by the concurrent loss in signal of the parent ion) is rather low for these compounds for MS2ofm/z55 (< 20 %) and slightly higher form/z57 (∼40 %).
In contrast, MS2 studies on oleic acid and butyl valer-ate reveal the dominant presence of [C4Hy]+ fragment ions
at the nominal masses m/z55 and 57, consistent with the structure of the respective molecules (with long hydrocar-bon chains, greenish colours in Fig. 6) and with results from corresponding ToF-AMS measurements (Fig. 6, left): for m/z55, predominantly loss of H2(2 Da), CH4(16 Da), and C2H2 (26 Da) is observed. Less abundant is the frag-ment ionm/z27, originating from the loss of C2H4(28 Da). For m/z57, predominantly fragmentation to m/z41 (loss of CH4, 16 Da) is found. Ion recovery for MS2 on these
[C4Hy]+fragments was found to be much better (50–100 %)
than for the [C3HyO]+fragments discussed above.
For pinonic acid and PEG200 (polyethylene glycol; see Table 1), no clear picture is obtained. For both compounds, MS2studies suggest dominance of [C4H7]+atm/z55, with fragmentation patterns similar to those of oleic acid and butyl valerate. While this is comprehensible from the molecular structure for pinonic acid, for which also ToF-AMS results show a strong fraction of [C4H7]+ atm/z55, for PEG200, dominance of [C3H3O]+ would have been expected both from the molecular structure and from the ToF-AMS mea-surement (Fig. 6). This needs to be further investigated; it might be possible that the oligomeric structure of PEG200 plays a role here, which could lead to multiply charged larger ion fragments and to ion rearrangements and, therefore, to a different molecular structure of the ion with the elemental composition [C3H3O]+and a different MS2mass spectrum. Form/z57, however, both PEG200 and pinonic acid show
Figure 7.Results of studies on(a)m/z60 and(b)m/z73 for various compounds. On the left, the relative contributions of [C2H4O2]+and [C3H8O]+tom/z60 and of [C3H5O2]+and [C4H9O]+tom/z73 are given (from ToF-AMS measurements; the difference to 100 % is due to one or several other ions contributing little to the respectivem/z). On the right, the results from IT-AMS MS2studies on these ions are summarised. For each investigated compound, the signal intensity of the fragment ions (relative to the signal intensity of the most abundant fragment) and the ion recovery are given. Not shown are fragments accounting for less than 1 % and, for the MS2experiment onm/z73, a small contribution observed at fragment ionm/z61 for glucose (2 % relative fraction).
fragmentation patterns originating from [C3H5O]+and only small contributions at m/z41, which likely originate from fragmentation of [C4H9]+. This is consistent with the ab-sence of straight hydrocarbon chains in the molecular struc-tures of these compounds (Table 1) and with the results from the respective ToF-AMS measurements (Fig. 6, left).
These findings show that it is generally possible to dis-tinguish between compounds containing straight hydrocar-bon chains and such that do not contain them by MS2 ex-periments onm/z55 and 57. Our results suggest that com-bined information from the MS2fragmentation patterns and the corresponding ion recoveries could facilitate the quanti-tative determination of the relative contributions of the differ-ent ions ([C3HyO]+vs. [C4Hy]+)to these parentm/z. More
work with a larger number of different compounds and under a larger range of operating conditions (in particular also for different vaporisation/ionisation as well as MS2 fragmenta-tion condifragmenta-tions) is needed in order to test further this assump-tion and to develop a robust method for the quantificaassump-tion of
the relative contributions of these ions to nominalm/z55 and 57.
4.3.2 Differentiation of ions with the same molecular formula but different molecular structures While differentiation of ions with the same nominal mass but different molecular formulas is possible both with the IT-AMS and the ToF-AMS, the differentiation of ions of the same elemental composition but with different molecu-lar structures is unique to instruments such as the IT-AMS. This feature has already been demonstrated in Sect. 4.2 in the differentiation of singly and doubly charged fragments at
m/z51 in the case of tryptophan and is further investigated here for ions of the nominalm/z60 and 73 for a number of carboxylic acids and sugars.
J. R. W. Fachinger et al.: The ion trap aerosol mass spectrometer 1635
acids (bluish colours). For m/z73, measurements of the polyether PEG200 (pink colour) and of pinonic acid are also included in the figure. ToF-AMS measurements indi-cate the dominant contribution of the ions [C2H4O2]+ and [C3H5O2]+ tom/z60 and 73, respectively, for both sugars and carboxylic acids (Fig. 7, first column). MS2 measure-ments with the IT-AMS, however, reveal differences in the molecular structure of these fragments between the two com-pound classes, which can be utilised for the differentiation between the latter.
While the ion atm/z60 from sugars in MS2experiments fragments only to ions ofm/z42 by loss of water (18 Da), for carboxylic acids additionally a small contribution of the fragmentm/z43 (loss of OH, 17 Da) is observed (Fig. 7a). This can be explained by different molecular structures of the parent ions [C2H4O2]+for the two compound classes, which can be deduced from the molecular structures of the respec-tive parent compounds (Table 1). For sugars, the fragment ion [C2H4O2]+most likely consists of a diol, with two OH groups attached to two carbon atoms adjacent to each other. In contrast, in the fragment ion of the same molecular for-mula formed from fragmentation of carboxylic acids, both oxygen atoms most likely are attached to the same carbon atom, forming a carboxyl group. Alcohols fragment predom-inantly by loss of water, while carboxyl groups are known to also fragment by loss of OH (McLafferty and Tureˇcek, 1993), which is in agreement with our findings. For all inves-tigated compounds, ion recovery was found to be 100 %.
Also in MS2 experiments on m/z73 ([C3H5O2]+), dif-ferences in the fragmentation chains of carboxylic acids and sugars were observed (Fig. 7b). Whilem/z73 from sugars predominantly fragments by loss of CO (28 Da) to ions of
m/z45, form/z73 from carboxylic acids this fragmentation pathway is less important, and in contrast it is fragmented predominantly by loss of water (18 Da) to ions of m/z55. Notably, ion recovery was found to be very different for the two compound groups, with ∼100 % ion recovery for car-boxylic acids but only∼60 % for sugars, pointing to an addi-tional fragmentation pathway form/z73 from sugars which was not traceable under the given measurement settings. In-terestingly, the polyether PEG200 shows a similar fragmen-tation pattern of m/z73 as sugars but with∼100 % ion re-covery, pointing to yet another molecular structure of the ion with the chemical formula [C3H5O2]+.
These results indicate that with the IT-AMS, it should be possible to determine the relative contributions of carboxylic acids and sugars to the ionsm/z60 and 73 (even though they have the same elemental composition), given no major con-tributions from other compound classes are present. For MS2 on m/z60, the ratio of relative intensities of the fragment ionsm/z43 to m/z42 is a direct indication for the relative contribution of carboxylic acids to the parent ion: the ratio was found to be (0 %/100 %) for the sugars, but in the range (11±1) %/100 % for the tested carboxylic acids (Fig. 7a). For MS2 onm/z73, the ratio of relative intensities of the
fragment ionsm/z45 tom/z55 was on average 100 %/3 % (range 100 %/(2–5) %) for sugars and 32 %/100 % (range (13–57) %/100 %) for carboxylic acids (Fig. 7b).
Using these results and the average relative contributions ofm/z60 and 73 to the mass spectra of sugars and carboxylic acids, in principle the absolute contribution of these com-pound classes to the measured total organic mass concentra-tion could be determined from MS2experiments on ions of
m/z60 and 73, which would not be possible with the reg-ular ToF-AMS. More work is needed in order to test this possibility with a large number of compounds, concentration ranges, range of operating parameters (especially different MS2 fragmentation conditions and vaporisation/ionisation conditions), as well as for mixtures of compounds. In first sensitivity studies for MS2onm/z73, we already found the presented differentiation to be robust for different aerosol loads, ion quantities in the trapping volume, and ion trap-ping parametersqz(see March, 1997). Further
characterisa-tion and calibracharacterisa-tion work is needed in order to fully facilitate quantification of the presented compound classes with the IT-AMS with more robust average values and to identify the associated limitations and uncertainties, like the cross sensi-tivity observed for the polyether PEG200 atm/z73.
5 Summary and conclusion
An IT-AMS was further developed and optimised, now al-lowing for more reproducible and reliable measurements while the instrument is also more robust and user-friendly and has extended measurement capabilities implemented in its data acquisition software. This allowed for the instru-ment’s first, 11-day-long field deployment, during which it was continuously running in parallel to a ToF-AMS. The re-sults show that the IT-AMS is capable of providing quan-titative information on the major nonrefractory submicron species organics, nitrate, and sulfate, with detection lim-its between 0.5 and 1.4 µg m−3 for 1 h averages. IT-AMS and ToF-AMS apply the same type of ion source (thermal desorption/electron impact ionisation), and consequently the observed organics fragmentation patterns were found to be comparable between the two instruments.
The capability of the IT-AMS to elucidate the structure of the fragmentation products observed in such mass spec-tra was demonsspec-trated by an MS4study on tryptophan. De-tection limits were found to be sufficiently low to allow for MS2studies on atmospheric particles under favourable am-bient conditions (7 µg m−3at a time resolution of 16 min in the given example), while MSn>2studies are only feasible at higher concentrations. Such a situation can be reached either under laboratory conditions or via aerosol concentrator sys-tems. All in all, we conclude that the IT-AMS can provide in-depth, quantitative information on total organic aerosol and on individual ion fragments both in field and in laboratory
studies and that these results are directly relatable to ToF-AMS results.
In laboratory studies on a variety of compounds, we found that the IT-AMS is capable of distinguishing [C4Hy]+ and
[C3HyO]+ fragments at the nominal m/z55 and 57 via
their characteristic fragmentation patterns in MS2 experi-ments. Furthermore, it is possible to distinguish between fragments of the same elemental composition but with differ-ent molecular structures: differdiffer-ent characteristic MS2 frag-mentation patterns were found for the ions at m/z60 and 73 for sugars and carboxylic acids, which have the same elemental compositions ([C2H4O2]+/[C3H5O2]+) in both cases. While the fragment ions at thesem/zoriginating from carboxylic acids and sugars therefore could not be differenti-ated with a ToF-AMS, the observed differences in their MS2 fragmentation patterns could be used to distinguish between the two compound classes using the IT-AMS. MS2atm/z60 yields ratios of average relative intensities of fragment ions
m/z43 tom/z42 of 11 %/100 % for carboxylic acids but of 0 %/100 % for sugars. Similarly, atm/z73, the ratio of rel-ative intensities of the MS2fragment ionsm/z45 tom/z55 was on average 100 %/3 % for sugars but 32 %/100 % for carboxylic acids.
More research is needed in order to further constrain these average values by testing a larger number of compounds and by also testing substances from other compound classes for potential cross sensitivities. However, these results already indicate that instruments like the IT-AMS potentially enable the distinction between carboxylic acids and sugars in or-ganic aerosol by means of MS2 experiments, which would further help in organic aerosol characterisation and source apportionment.
Data availability. The data are available upon request from the cor-responding author.
Competing interests. The authors declare that they have no conflict of interest.
Acknowledgements. We thank T. Böttger and the teams of the electronic and the mechanical workshops of the Max Planck Institute for Chemistry for their technical support and valuable help, especially M. Flanz, K.-H. Bückart, and M. Dieterich. We also thank J. Curtius and A. Kürten for their support and technical help regarding the initial design of the IT-AMS. P. Faber is gratefully acknowledged for providing some of the ToF-AMS data. Funding was provided by the Max Planck Institute for Chemistry and by the Institute for Atmospheric Physics at the Johannes Gutenberg University, Mainz.
The article processing charges for this open-access publication were covered by the Max Planck Society.
Edited by: P. Herckes
Reviewed by: two anonymous referees
References
Allan, J. D., Delia, A. E., Coe, H., Bower, K. N., Alfarra, M. R., Jimenez, J. L., Middlebrook, A. M., Drewnick, F., Onasch, T. B., Canagaratna, M. R., Jayne, J. T., and Worsnop, D. R.: A generalised method for the extraction of chemically resolved mass spectra from Aerodyne aerosol mass spectrometer data, J. Aerosol. Sci., 35, 909–922, 2004.
Canagaratna, M. R., Jayne, J. T., Jimenez, J. L., Allan, J. D., Al-farra, M. R., Zhang, Q., Onasch, T. B., Drewnick, F., Coe, H., Middlebrook, A., Delia, A., Williams, L. R., Trimborn, A. M., Northway, M. J., DeCarlo, P. F., Kolb, C. E., Davidovits, P., and Worsnop, D. R.: Chemical and microphysical characterization of ambient aerosols with the Aerodyne aerosol mass spectrometer, Mass Spectrom. Rev., 26, 185–222, 2007.
Cole, C. R., Outlaw, R. A., Champion, R. L., Baker, D. H., and Holloway, B. C.: Mass spectral resolution of F+and H3O+ in very high vacuum, J. Vac. Sci. Technol. A, 21, 1796–1799, 2003. DeCarlo, P. F., Kimmel, J. R., Trimborn, A., Northway, M. J., Jayne, J. T., Aiken, A. C., Gonin, M., Fuhrer, K., Horvath, T., Docherty, K. S., Worsnop, D. R., and Jimenez, J. L.: Field-Deployable, High-Resolution, Time-of-Flight Aerosol Mass Spectrometer, Anal. Chem., 78, 8281–8289, 2006.
Dotan, I., Hierl, P. M., Morris, R. A., and Viggiano, A. A.: Rate constants for the reactions of N+and N+2 with O2as a function of temperature (300–1800 K), Int. J. Mass Spectrom., 167, 223– 230, 1997.
Drewnick, F., Hings, S. S., Alfarra, M. R., Prevot, A. S. H., and Borrmann, S.: Aerosol quantification with the Aerodyne Aerosol Mass Spectrometer: detection limits and ionizer background effects, Atmos. Meas. Tech., 2, 33–46, doi:10.5194/amt-2-33-2009, 2009.
Drewnick, F., Hings, S. S., DeCarlo, P., Jayne, J. T., Gonin, M., Fuhrer, K., Weimer, S., Jimenez, J. L., Demerjian, K. L., Bor-rmann, S., and Worsnop, D. R.: A New Time-of-Flight Aerosol Mass Spectrometer (TOF-AMS) – Instrument Description and First Field Deployment, Aerosol Sci. Tech., 39, 637–658, 2005. Fachinger, J. R. W.: Das Aerosol-Ionenfallen-Massenspektrometer
(AIMS): Aufbau, Charakterisierung und Feldeinsatz, PhD thesis, Johannes Gutenberg University Mainz, Mainz, 2012.
Fuzzi, S., Baltensperger, U., Carslaw, K., Decesari, S., Denier van der Gon, H., Facchini, M. C., Fowler, D., Koren, I., Langford, B., Lohmann, U., Nemitz, E., Pandis, S., Riipinen, I., Rudich, Y., Schaap, M., Slowik, J. G., Spracklen, D. V., Vignati, E., Wild, M., Williams, M., and Gilardoni, S.: Particulate matter, air qual-ity and climate: lessons learned and future needs, Atmos. Chem. Phys., 15, 8217–8299, doi:10.5194/acp-15-8217-2015, 2015. Goldstein, A. H. and Galbally, I. E.: Known and Unexplored
Or-ganic Constituents in the Earth’s Atmosphere, Environ. Sci. Technol., 41, 1514–1521, 2007.
J. R. W. Fachinger et al.: The ion trap aerosol mass spectrometer 1637
Hanna, S. J., Campuzano-Jost, P., Simpson, E. A., Robb, D. B., Bu-rak, I., Blades, M. W., Hepburn, J. W., and Bertram, A. K.: A new broadly tunable (7.4–10.2 eV) laser based VUV light source and its first application to aerosol mass spectrometry, Int. J. Mass Spectrom., 279, 134–146, 2009.
Harris, W. A., Reilly, P. T. A., and Whitten, W. B.: Detection of Chemical Warfare-Related Species on Complex Aerosol Parti-cles Deposited on Surfaces Using an Ion Trap-Based Aerosol Mass Spectrometer, Anal. Chem., 79, 2354–2358, 2007. Hierl, P. M., Dotan, I., Seeley, J. V., Van Doren, J. M., Morris, R.
A., and Viggiano, A. A.: Rate constants for the reactions of O+ with N2and O2as a function of temperature (300–1800 K), J. Chem. Phys., 106, 3540–3544, 1997.
Hoffmann, T., Huang, R.-J., and Kalberer, M.: Atmospheric Ana-lytical Chemistry, Anal. Chem., 83, 4649–4664, 2011.
Jayne, J. T., Leard, D. C., Zhang, X., Davidovits, P., Smith, K. A., Kolb, C. E., and Worsnop, D. R.: Development of an Aerosol Mass Spectrometer for Size and Composition Analysis of Sub-micron Particles, Aerosol Sci. Tech., 33, 49–70, 2000.
Julian, R. K. and Cooks, R. G.: Broad-band excitation in the quadrupole ion trap mass spectrometer using shaped pulses cre-ated with the inverse Fourier transform, Anal. Chem., 65, 1827– 1833, 1993.
Kanakidou, M., Seinfeld, J. H., Pandis, S. N., Barnes, I., Dentener, F. J., Facchini, M. C., Van Dingenen, R., Ervens, B., Nenes, A., Nielsen, C. J., Swietlicki, E., Putaud, J. P., Balkanski, Y., Fuzzi, S., Horth, J., Moortgat, G. K., Winterhalter, R., Myhre, C. E. L., Tsigaridis, K., Vignati, E., Stephanou, E. G., and Wilson, J.: Organic aerosol and global climate modelling: a review, At-mos. Chem. Phys., 5, 1053–1123, doi:10.5194/acp-5-1053-2005, 2005.
Kascheres, C. and Cooks, R. G.: Isomer distinction by ion/molecule reactions in an ion trap: The case of C5H8, Anal. Chim. Ac., 215, 223–232, 1988.
Kürten, A., Curtius, J., Helleis, F., Lovejoy, E. R., and Borrmann, S.: Development and characterization of an ion trap mass spec-trometer for the on-line chemical analysis of atmospheric aerosol particles, Int. J. Mass Spectrom., 265, 30–39, 2007.
Kürten, C. A.: Entwicklung, Aufbau und Charakterisierung eines neuartigen Ionenfallen-Massenspektrometers für Aerosolpartikel (AIMS), PhD thesis, Johannes Gutenberg University Mainz, Mainz, 2007.
Liu, P., Ziemann, P. J., Kittelson, D. B., and McMurry, P. H.: Gener-ating Particle Beams of Controlled Dimensions and Divergence: 1. Theory of Particle Motion in Aerodynamic Lenses and Nozzle Expansions, Aerosol Sci. Tech., 22, 293–313, 1995.
March, R. E.: An introduction to quadrupole ion trap mass spec-trometry, J. Mass Spectrom., 32, 351–369, 1997.
McLafferty, F. W. and Tureˇcek, F.: Interpretation of mass spectra, University Science Books, Sausalito, 1993.
Murphy, D. M.: The design of single particle laser mass spectrome-ters, Mass Spectrom. Rev., 26, 150–165, 2007.
Ottens, A. K., Arkin, C. R., Griffin, T. P., Palmer, P. T., and Harrison, W. W.: Ion-molecule reactions in quadrupole ion trap mass spec-trometry: implications for lightweight gas analysis, Int. J. Mass Spectrom., 243, 31–39, 2005.
Pratt, K. A. and Prather, K. A.: Mass spectrometry of atmospheric aerosols – Recent developments and applications, Part I: Off-line mass spectrometry techniques, Mass Spectrom. Rev., 31, 1–16, 2012.
Schramm, E., Kürten, A., Hölzer, J., Mitschke, S., Mühlberger, F., Sklorz, M., Wieser, J., Ulrich, A., Pütz, M., Schulte-Ladbeck, R., Schultze, R., Curtius, J., Borrmann, S., and Zimmermann, R.: Trace Detection of Organic Compounds in Complex Sample Matrixes by Single Photon Ionization Ion Trap Mass Spectrom-etry: Real-Time Detection of Security-Relevant Compounds and Online Analysis of the Coffee-Roasting Process, Anal. Chem., 81, 4456–4467, 2009.
Silva, P. J. and Prather, K. A.: Interpretation of mass spectra from organic compounds in aerosol time-of-flight mass spectrometry, Anal. Chem., 72, 3553–3562, 2000.
Sobanski, N., Tang, M. J., Thieser, J., Schuster, G., Pöhler, D., Fischer, H., Song, W., Sauvage, C., Williams, J., Fachinger, J., Berkes, F., Hoor, P., Platt, U., Lelieveld, J., and Crowley, J. N.: Chemical and meteorological influences on the lifetime of NO3 at a semi-rural mountain site during PARADE, Atmos. Chem. Phys., 16, 4867–4883, doi:10.5194/acp-16-4867-2016, 2016. SQUIRREL: ToF-AMS Analysis Toolkit, available at:
http://cires.colorado.edu/jimenez-group/ToFAMSResources/ ToFSoftware/index.html, last access: 14 July 2016.
Sun, Y.-L., Zhang, Q., Schwab, J. J., Demerjian, K. L., Chen, W.-N., Bae, M.-S., Hung, H.-M., Hogrefe, O., Frank, B., Rattigan, O. V., and Lin, Y.-C.: Characterization of the sources and pro-cesses of organic and inorganic aerosols in New York city with a high-resolution time-of-flight aerosol mass apectrometer, At-mos. Chem. Phys., 11, 1581–1602, doi:10.5194/acp-11-1581-2011, 2011.
Thornberry, T., Murphy, D. M., Thomson, D. S., de Gouw, J., Warneke, C., Bates, T. S., Quinn, P. K., and Coffman, D.: Measurement of Aerosol Organic Compounds Using a Novel Collection/Thermal-Desorption PTR-ITMS Instrument, Aerosol Sci. Tech., 43, 486–501, 2009.
Vogel, A. L., Äijälä, M., Brüggemann, M., Ehn, M., Junninen, H., Petäjä, T., Worsnop, D. R., Kulmala, M., Williams, J., and Hoff-mann, T.: Online atmospheric pressure chemical ionization ion trap mass spectrometry (APCI-IT-MSn) for measuring organic acids in concentrated bulk aerosol – a laboratory and field study, Atmos. Meas. Tech., 6, 431–443, doi:10.5194/amt-6-431-2013, 2013.
Wu, H.-F. and Brodbelt, J. S.: Effects of collisional cooling on ion detection in a quadrupole ion trap mass spectrometer, Int. J. Mass Spectrom., 115, 67–81, 1992.
Zhang, Q., Jimenez, J. L., Canagaratna, M. R., Ulbrich, I. M., Ng, N. L., Worsnop, D. R., and Sun, Y.: Understanding atmospheric organic aerosols via factor analysis of aerosol mass spectrometry: a review, Anal. Bioanal. Chem., 401, 3045–3067, 2011.

![Figure 6. Results of studies on (a) m/z 55 and (b) m/z 57 for various compounds. On the left, the relative contributions of [C3H3O]+ and[C4H7]+ to m/z 55 and of [C3H5O]+ and [C4H9]+ to m/z 57 are given (from ToF-AMS measurements; the difference to 100 % is](https://thumb-us.123doks.com/thumbv2/123dok_us/40809.1504801/11.612.99.497.67.395/figure-results-various-compounds-relative-contributions-measurements-difference.webp)
![Figure 7. Results of studies on (a) m/z 60 and (b) m/z 73 for various compounds. On the left, the relative contributions of [C2H4O2]+ and[C3H8O]+ to m/z 60 and of [C3H5O2]+ and [C4H9O]+ to m/z 73 are given (from ToF-AMS measurements; the difference to 100](https://thumb-us.123doks.com/thumbv2/123dok_us/40809.1504801/12.612.101.498.66.394/figure-results-various-compounds-relative-contributions-measurements-difference.webp)