www.atmos-meas-tech.net/6/3425/2013/ doi:10.5194/amt-6-3425-2013
© Author(s) 2013. CC Attribution 3.0 License.
Atmospheric
Measurement
Techniques
Reporting the sensitivity of laser-induced fluorescence instruments
used for HO
2
detection to an interference from RO
2
radicals and
introducing a novel approach that enables HO
2
and certain RO
2
types to be selectively measured
L. K. Whalley1,2, M. A. Blitz1,2, M. Desservettaz1, P. W. Seakins1,2, and D. E. Heard1,2
1School of Chemistry, University of Leeds, Leeds, LS2 9JT, UK
2National Centre for Atmospheric Science, University of Leeds, Leeds, LS2 9JT, UK
Correspondence to: L. K. Whalley ([email protected])
Received: 11 June 2013 – Published in Atmos. Meas. Tech. Discuss.: 9 July 2013 Revised: 29 October 2013 – Accepted: 8 November 2013 – Published: 9 December 2013
Abstract. Laboratory studies have revealed that alkene-derived RO2 and longer chain alkane-derived RO2 (> C3)
radicals rapidly convert to HO2and then to OH in the
pres-ence of NO in a fluorescpres-ence assay by gas expansion (FAGE) detection cell (Fuchs et al., 2011). Three different FAGE cells that have been used to make ambient measurements of OH and HO2 in the University of Leeds ground-based
in-strument have been assessed to determine the sensitivity of each cell, when operating in HO2 detection mode, to RO2
radicals. The sensitivity to this interference was found to be highly dependent on cell design and operating parameters. Under the operating conditions employed, during fieldwork undertaken in the Borneo rainforest in 2008, an OH yield of 17 % was experimentally determined for both ethene- and isoprene-derived RO2 radicals. The high pumping capacity
of this system, resulting in a short residence time in the cell, coupled with poor mixing of NO into the ambient air-stream for the titration of HO2to OH effectively minimised this
po-tential interference. An OH yield of 46 % was observed for ethene-derived RO2 radicals when a smaller detection cell
was used, in which the mixing of NO into the ambient air was improved and the cell residence times were much longer. For a newly developed ROxLIF cell, used for detection of
HO2and RO2radicals an OH yield of 95 % was observed for
ethene-derived RO2radicals, when running in HO2mode.
In experiments in which conditions ensured the conversion of RO2to OH were complete, the yields of OH from a range
of different RO2species agreed well with model predictions
based on the Master Chemical Mechanism version 3.2. For
ethene and isoprene-derived RO2species, the relative
sensi-tivity of FAGE was found to be close to that for HO2, with
an OH yield of 100 % and 92 %, respectively. For the longer chain or cyclic alkane-derived RO2 radicals (> C3), model
predicted OH yields were highly dependent upon tempera-ture. A model predicted OH yield of 74 % at 298 K and 36 % at 255 K were calculated for cyclohexane-derived RO2
radi-cals, and an experimental yield of 38 % was observed indi-cating that the temperature within the cell was below ambient owing to the supersonic expansion of the airstream in the low pressure cell.
These findings suggest that observations of HO2by some
LIF instruments worldwide may be higher than the true value if the instruments were sensitive to these RO2species. If this
is the case, it becomes necessary to compare atmospheric chemistry model simulations to HO∗2 observations, where HO∗2= [HO2] +6iαi[RO2i], and αi is the mean fractional
contribution of the RO2 species that interfere (RO2i). This
methodology, however, relies on model simulations of speci-ated RO2radicals, as instrumentation to make speciated RO2
measurements does not currently exist. Here we present an approach that enables the concentration of HO2 and RO2i
to be selectively determined by varying the concentration of NO injected into a FAGE cell. Measurements of [HO2] and
1 Introduction
OH and HO2 radicals, collectively termed HOx, together
with RO2radicals, control the oxidative chemistry in the
at-mosphere, being responsible for the transformation of pri-mary emissions into secondary pollutants such as NO2, O3
and particulates. OH radicals control the lifetime of some greenhouse gases (e.g. CH4), the production of acidic species
(e.g. H2SO4) and aerosol precursors such as oxygenated
volatile organic compounds. Understanding the behaviour of free-radicals in the atmosphere is of paramount importance in understanding the lifetimes of pollutants and hence the spatial scales of their transport. Predictive models for fu-ture air quality and climate change contain complex chem-ical schemes, and comparison with measurements of free-radicals (the concentrations of which are controlled only by local chemistry and not by transport) in the present at-mosphere constitutes one of the best validations of these schemes (Heard and Pilling, 2003). OH and HO2radicals in
the troposphere have been measured since the early 1990s using laser-induced fluorescence (LIF) spectroscopy at low pressure (Fluorescence Assay by Gas Expansion, or the FAGE technique) originally developed by Hard et al. (1979, 1984). The technique employs 308 nm radiation, produced using a variety of laser technologies, to excite OH radicals, which fluoresce; this emission (also at 308 nm) is detected and used to quantify OH. It is also possible to simultane-ously detect HO2 in a second fluorescence cell, by
chemi-cal conversion to OH through reaction with NO and subse-quent detection by LIF. The technique has been employed by several groups worldwide for the detection of OH and HO2
(Hofzumahaus et al., 1996; Mather et al., 1997; Kanaya et al., 1999; Creasey et al., 2001; Faloona et al., 2001; Hanisco et al., 2002; Holland et al., 2003; Heard and Pilling, 2003; Stone et al., 2012). Specific to this work, the Leeds ground-based FAGE instrument has been operational since 1996 and has detected OH and HO2under a variety of conditions
rang-ing from urban (Heard et al., 2004) to clean marine (Whalley et al., 2010). Although the FAGE technique represents an ex-tremely sensitive (typical OH detection limits are in the low to mid- 105molecule cm−3)(Heard and Pilling, 2003) and selective method for OH and HO2 detection, ambient HOx
concentrations are themselves extremely low (OH concen-trations are typically a few 106molecule cm−3)(Stone et al., 2012), thus, care needs to be taken to ensure that any mea-surement is not biased by any chemical or spectral interfer-ence.
A well-documented example of an OH interference comes from the earliest tropospheric LIF instruments (Davis et al., 1981; Ortgies et al., 1980; Shirinzadeh et al., 1987), which used off-resonant pulsed laser excitation of the OH radical at 282 nm, via theA26+(υ0=1)←X25i(υ00=0)
transi-tion. These instruments were found to suffer from a consid-erable interference from laser-generated OH formed by the laser photolysis of ambient ozone and subsequent reaction of
O(1D) with ambient water vapour: O3
hv
−→O(1D)+O2 (R1)
O(1D)+H2O→2OH (R2)
The use of OH detection at lower pressure (reducing [H2O] and hence the rate of Reaction R2), lower laser
energy per pulse (the OH artefact signal depends on the square of the laser energy) and switching to excitation at 308 nm (the H2O/O3 interference is 30 times lower than at
282 nm) almost completely overcame this problem. Holland et al. (2003), however, observed an interference in the pres-ence of ozone and water vapour that appeared to be a dark reaction on the walls of their detection cell which produced a source of HO2radicals; the authors report a signal
equiv-alent to 5.4×10⁷molecule cm−3of HO2in the presence of
50 ppbv O3and at a relative humidity of 60 %. This
interfer-ence has been characterised in detail and is subtracted from their ambient HO2measurements.
In the presence of the added NO used to convert HO2 to
OH inside the fluorescence cell, and hence enable HO2 to
be measured, organic peroxy radicals (RO2) also have the
potential to be chemically converted to OH via:
RO2+NO→RO+NO2 (R3)
RO+O2→HO2+R−HO (R4)
HO2+NO→OH+NO2 (R5)
Due to the low pressure employed in FAGE detection, how-ever, Reaction (R4) is slow (∼12 s−1 for CH
3O at 1 Torr)
and, given the very short residence time in FAGE between NO injection and the detection region of typically just a few milliseconds or less (Creasey et al., 1997b), it was assumed, until recently, that RO2 radicals were not converted to OH
to any large extent. In support of this, Ren et al. (2004) re-ported no interference upon introduction of C1–C4
alkane-derived RO2 radicals in the Penn State FAGE system, and
concluded that there was no evidence of any significant inter-ferences for OH or HO2measurements in the atmosphere,
in-cluding in highly polluted urban environments. Only recently has an interference from alkene and aromatic-derived RO2
species been reported (Fuchs et al., 2011). Unlike alkane-derived RO2species which are formed via H-atom
abstrac-tion from the parent alkane and subsequent addiabstrac-tion of O2
(Reaction R6), the major pathway to alkene-derived RO2
for-mation is via OH addition across the double bond followed by O2addition (Reaction R7):
RH+OH−→O2 RO2+H2O (R6)
R(OH)−R0O2+NO→R(OH)−R0O+NO2 (R8)
R(OH)−R0O+O2→R(OH)−R0−HO+HO2 (R9)
R(OH)−R0ODecomp−→.R=O+R0−OH (R10)
R0−OH+O2→R=O+HO2 (R11)
The β-hydroxyalkylperoxy radical formed reacts with NO to form the β-hydroxyalkoxy radical Reaction (R8) which can either react with O2 (Reaction R9) or decompose
to a hydroxyalkyl radical (Reaction R10) which then re-acts rapidly with O2 to form a carbonyl and HO2
(Reac-tion R11). Compared to the slow RO + O2 reaction (k=
1.65×10⁻¹⁵cm3molecule−1s−1, for R = CH
3, Reaction R9;
Orlando et al., 2003), decomposition and subsequent reac-tion of the hydroxyalkyl radical (CH2OH) with O2 is fast
(k=9.6×10⁻¹²cm3molecule−1s−1; Atkinson et al., 1997). Fuchs et al. (2011) found, due to this rapid decomposition pathway, that RO2 species formed from alkene and
aro-matic precursors were detected as OH with relative sensi-tivities greater than 80 % with respect to that for detection of HO2 in their FAGE system. The level of the
interfer-ence was found to be highly dependent upon the NO con-centration injected and reaction time between injection and OH detection, which was varied by Fuchs et al. (2011) sug-gesting that other FAGE instruments with different cell de-signs and operational parameters may display different sen-sitivities towards this interference. FAGE cells used for air-borne HO2measurements tend to have longer inlets to extend
through the fuselage of the aircraft and, hence, sampled air tends to have longer residence times in these cell types com-pared to cells used solely for ground measurements. Very re-cently, Mao et al. (2012) reported an average RO2
sensitiv-ity of∼60 % with respect to that for HO2for a selection of
alkene-derived RO2species in the Penn State FAGE
instru-ment, whilst Vaughan et al. (2012) reported a sensitivity to ethene-derived RO2radicals of 40 % with respect to that for
HO2 for the University of Leeds aircraft FAGE instrument
(Commane et al., 2010). Ultimately, the measurement bias on the HO2 concentrations reported from past field studies
will depend upon the individual FAGE instruments utilised (because of variations in key operating parameters such as residence time) and the concentration and speciation of RO2
present. Many FAGE groups now report HO∗2 for compari-son with atmospheric chemistry box models (Lu et al., 2012) where HO∗2= [HO2] +6iαi[RO2i], andαi is the mean
frac-tional contribution of the RO2species that interfere (RO2i)
in a particular instrument which has been determined exper-imentally.
Together with a HO2interference, FAGE measurements of
OH are reported to have an interference for one instrument
type in forested environments (Mao et al., 2012). The au-thors postulate that OH may be generated in their FAGE cell in the presence of ozone and alkenes, with laser-generated OH within the cell being ruled out. Similar to the HO2
in-terference reported here, this OH inin-terference may be depen-dent upon the particular design of this FAGE cell, for exam-ple the residence time between sampling and detection and, as such, the extent that other OH measurements suffer from this interference is unknown, meaning that it is critical that a set of standardised experiments are performed on differ-ent FAGE cell types used for ambidiffer-ent detection of OH to assess the extent of any interference. Good agreement be-tween two independent OH measurements made using Dif-ferential Optical Absorption Spectroscopy (DOAS) and LIF was observed during a series of experiments performed in the SAPHIR atmospheric simulation chamber under a range of atmospheric conditions (Fuchs et al., 2012, 2013) suggest-ing that the Julich FAGE system, at least, does not suffer an interference when detecting OH under the conditions stud-ied.
In this paper we report results from interference stud-ies performed using the University of Leeds ground-based FAGE instrument (Creasey et al., 1997a) measuring in HO2
mode (NO added to the detection cell) and discuss the likely impact of the RO2interference on previous field studies. We
also compare absolute yields of OH from alkene-derived and higher alkane-derived RO2 species in the presence of NO
with MCMv3.2 recommendations, where experimental con-ditions allowed reactions to proceed to completion.
2 Experimental
HO2 and RO2 radicals were generated prior to FAGE
de-tection by two different methods: a steady-state turbulent flow tube reactor calibrated for absolute radical concentra-tions and a time-resolved laser flash photolysis system. Each method will be described in turn.
2.1 Steady-state experiments
The FAGE calibration system (described in detail by Com-mane et al., 2010) acts as a turbulent flow reactor and gener-ates known and equal quantities of OH and HO2radicals by
the 184.9 nm photolysis of H2O vapour by a Hg penray lamp
in a humidified air stream (Reactions R12–13):
H2O+hv→H+OH (R12)
H+O2 M
−→HO2 (R13)
With knowledge of the product of the lamp flux and irra-diation exposure time past the lamp (determined by N2O
actinometry; Commane et al., 2010), the concentration of OH and HO2 may be determined; typical radical
from Reaction R13) were generated by introducing the par-ent hydrocarbon into the FAGE calibration system approx-imately 2.5 cm after the penray lamp. The OH generated in the calibration photolysis region reacted rapidly with the hydrocarbon introduced, Reactions (R6) or (R7), generat-ing RO2 radicals. To assess the magnitude of any HO2
in-terference suffered during previous ambient field measure-ments, a number of individual peroxy radical species were generated and introduced into three different fluorescence cells (Fig. 1) which have been used during field deploy-ments by the Leeds group (further details on the fieldwork FAGE detection cells tested are given below). The peroxy radicals tested were derived from methane, propane, ethene, isoprene, toluene, cyclohexane and methanol. A small flow (∼10–150 standard cubic centimetre per minute, SCCM) of a dilute (0.1–5 %) hydrocarbon mix in N2(ethene, isoprene,
toluene, cyclohexane or methanol) or a 100 % hydrocarbon flow of propane (10 SCCM) or methane (500 SCCM) was in-troduced into a 20–40 standard litre per minute (SLM) hu-midified air-stream approximately 5 cm before the exit of the calibration tube. The residence time within the calibra-tion flow tube (∼10 ms at 40 SLM) was sufficient to ensure complete conversion of OH to RO2 before being sampled
in the fluorescence cells. In the case of ethene, at an initial concentration of 3.1×10¹⁴molecule cm−3, it takes∼1 ms for complete conversion of OH to RO2, using a rate
coeffi-cient (kC2H4+OH) equal to 2.86×10
−11molecule−1cm3s−1
(Cleary et al., 2006). This could be experimentally verified by observing the complete loss of the OH signal upon ad-dition of the hydrocarbons when no NO was added to the FAGE expansion cells; this complete loss of OH signal was observed even for the slowest reacting hydrocarbon species, methane.
FAGE detection cells
The University of Leeds ground-based FAGE instrument de-scribed in detail elsewhere (Whalley et al., 2010) was as-sessed to determine the magnitude of the HO2 interference
from selected RO2species under configurations employed in
two recent field studies. The first, the Oxidants and Particle Photochemical Processes (OP3) (Hewitt et al., 2010) which took place in the Borneo rainforest (Whalley et al., 2011) and the second, the Hill Cap Cloud Thuringer – 2010 (HCCT-2010) which aimed to quantify the loss of radicals to cloud droplets.
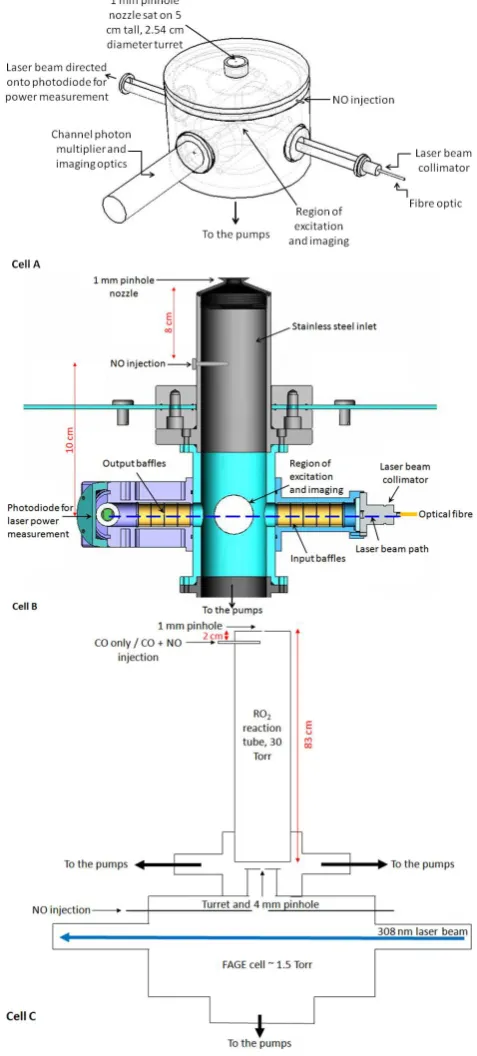
The operational parameters of the different FAGE fluores-cence cells considered are quite different and are summarised in Table 1. During OP3, one 22 cm internal diameter cylin-drical, stainless steel fluorescence cell (cell A) was used to make sequential measurements of OH and HO2 (Fig. 1a).
Air was drawn into the cell via a 5 cm tall, 2.54 cm di-ameter turret through a 1 mm didi-ameter pinhole nozzle in a flat plate (0.1 mm thickness). The cell was maintained at approximately 0.9 Torr using a Roots blower backed by
Fig. 1. Schematics highlighting the key features of the three FAGE
cells tested. Cell A was used for sequential OH and HO2detection
during the OP3 project; dotted line highlights internal cell compo-nents. Cell B was used to make sequential tower-based measure-ments of OH and HO2during the HCCT campaign. Cell C
a rotary pump (Leybold). The cell was connected to the pump system via a 10 cm ID, 5 m length stainless steel flex-ible hose. NO was injected into the cell 7.5 cm below the nozzle via a custom-built injection ring containing four in-jection points, spaced 4 cm apart, and made from 1.6 mm (ID) tubing in a square arrangement located around the air stream. In all, 50 SCCM NO was injected into the cell via a computer-controlled solenoid valve (Metron Semiconduc-tors) and calibrated mass flow controller (MKS 1179A, range 0–50 SCCM) during the second half of the collection period when the laser was tuned to the OH transition. As only one cell was used for sequential detection of OH and HO2, the
conditions were optimised to maximise the sensitivity to-wards OH. Under these conditions the conversion of HO2to
OH was only∼10 %, most likely due to poor mixing of the NO into the ambient air flow caused by the particular flow characteristics created by the combination of the 1 mm di-ameter pinhole nozzle and the pressure and pumping speeds employed. The 10 % conversion of HO2 to OH determined
assumes that there is no preferential loss of either radical in the calibration system (i.e. that the concentration of OH and HO2 are equal as they enter the FAGE detection cell). This
assumption has previously been verified by the addition of sufficient CO to the calibration system so as to rapidly con-vert all the OH to HO2 (Reaction R14) and the HO2
sig-nal was observed to double in the presence of CO. The rad-icals sampled, or converted from HO2, were electronically
excited at 308 nm, approximately 13 cm below the sampling nozzle using a tuneable, 5 KHz pulse repetition frequency laser (Nd : YAG pumped Ti : Sapphire, Photonics Industries) with the fluorescence at the same wavelength detected per-pendicular to the laser axis by a filtered (Barr Associates fil-ter, transmission > 50 % at 308 nm) channel photo-multiplier (CPM, Perkin Elmer) and gated-photon counting.
During the HCCT-2010 campaign a single FAGE fluores-cence cell was used to measure both radical species (cell B). The cell was operated from the top of a 22 m high tower to co-locate with hill-cap cloud measurements and ensure that the radical measurements were performed in full cloud when it had formed. As a result of these requirements a smaller cell, based on the University of Leeds aircraft FAGE fluo-rescence cell (Commane et al., 2010), was used to make se-quential measurements of OH and HO2(Fig. 1b); operational
details are provided in Table 1. NO (10 SCCM) was injected into this cell via 3.2 mm ID stainless tubing inserted into the centre of the ambient air stream. This configuration resulted in a high conversion of HO2to OH (∼90 %). Ambient air
was drawn into the cell through a 1 mm diameter pinhole nozzle into a 4.5 cm (ID) stainless steel cylinder. The cell was held at 1 Torr and was connected to the roots-rotary pump system, described above, via 30 m of flexible hosing (5 cm ID). Laser light was delivered from the Nd : YAG pumped Ti : Sapphire laser system to the cell via a 30 m fibre op-tic. The distance between sampling nozzle and detection was 18 cm with the NO injected∼8 cm below the nozzle.
The third FAGE cell (cell C) tested for an RO2
interfer-ence was a recently developed fluorescinterfer-ence cell designed for the detection of RO2radicals, alongside OH and HO2, using
the “ROxLIF” methodology outlined by Fuchs et al. (2008).
The RO2 cell is operated in two modes, providing a
mea-surement of the sum of OH + HO2in HOxmode and the sum
of OH + HO2+ RO2in ROxmode. Experiments were run on
this third FAGE cell to determine the magnitude of the HO2
interference suffered from a variety of RO2 species in the
HOxmode.
A similar FAGE fluorescence cell as the one described above (Fig. 1a, cell A) was modified by coupling it to a differentially pumped reaction tube (held at approximately 30 Torr) to allow for conversion of RO2 radicals to OH
(Fig. 1c). The reaction tube is an 83 cm high, 6.4 cm diame-ter aluminium tube which has been coated with halocarbon wax to minimise radical wall losses. Ambient air (7.5 SLM) is drawn into the reaction tube through a 1 mm diameter pin-hole drilled into a thin (1 mm thickness), flat plate aluminium inlet nozzle. In HOx mode, 250 SCCM of CO (5 % in N2,
BOC) is flowed into the centre of the reaction tube just be-neath the inlet (∼2 cm below) via a 6.4 mm (ID) stainless steel tube. Hydroxyl radicals are converted to HO2by
tion with CO (Reaction R14) as they pass through the reac-tion tube. Air (∼5 SLM) from the reaction tube is sampled by the FAGE detection cell (held at approximately 1.5 Torr) via a 4 mm diameter pinhole nozzle set on a 5 cm tall turret. Ambient HO2(and ambient OH which was converted to HO2
in the reaction tube) is titrated to OH by NO injected into the cell 7.5 cm below the nozzle and detected by LIF; 100 SCCM of NO was injected into this fluorescence cell to maximise the conversion of HO2to OH. In ROxmode, 25 SCCM of a
500 ppmv NO standard in N2 (BOC) was added to the CO
flow to promote conversion of RO2to OH (Reactions R3–
R5); the excess CO present rapidly converts OH to HO2
(Re-action R14) and helps to minimise the overall loss of the rad-icals to the walls of the reaction tube. Ambient RO2, HO2
and OH radicals (converted to HO2in the reaction tube)
en-ter the FAGE detection cell, are reconverted to OH by NO and detected as described above.
OH+CO−→O2 HO2+CO2 (R14)
2.2 Time-resolved experiments using laser flash photolysis
The time-resolved set-up was based on a laser-induced pump and probe OH reactivity technique developed by Sadanaga et al. (2004) which uses pulsed 266 nm light to photolyse ozone in a flow tube to generate O(1D) and, by the subsequent reac-tion of O(1D) with H2O vapour, OH radicals (Reactions R1–
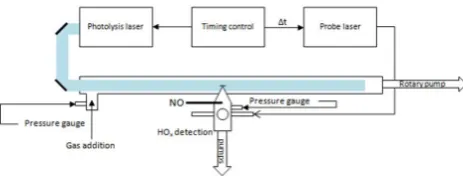
Fig. 2. Schematic highlighting the key features of the laser
flash-photolysis time-resolved experimental set-up.
should be noted that at the pressures employed in the experi-ments, the high pressure limit of any pressudependent re-actions taking place in the flow tube will have been reached and the results presented will be applicable to atmospheric conditions. A FAGE cell was located approximately halfway along the flow tube, held perpendicular to the flow tube, and sampled the gas flow through a 1 mm diameter pinhole noz-zle that was located within 1 cm of the central axis of the flow tube. At the flow rates and pressure employed, the residence time in the flow tube before sampling was∼4 s. A YAG laser (Spectron SL803) was used to generate∼10 mJ pulse−1 of 266 nm photolysis radiation with a 10 ns pulse width. The laser beam profile was shaped using a Galilean telescope to produce a collimated beam with a diameter of∼2 cm and directed along the flow tube such that the outer edge just il-luminated the pinhole – gauged by the silhouette of the beam profile at the end of the tube.
The FAGE expansion cell was pumped by a rotary/Roots blower pump combination (Leybold), which reduced the pressure in the expansion cell to 1 Torr, and typically sam-pled about 30 % of the total flow of the flow tube with the remaining flow evacuated from the flow tube via the ro-tary pump. The expansion cell was 4.5 cm in internal di-ameter with the fluorescence detection axis∼23.5 cm from the pinhole. An excimer (Lambda Physik LPX105) pumped dye laser (Lambda Physik FL3002) operating on Rhodamine 6G generated visible light which was frequency doubled to 307.844 nm and used to probe the OH radical via the Q1
(1) (A-X) (0-0) transition; typical pulse energies and pulse lengths were 0.2 mJ pulse−1 and 20 ns respectively. The ra-diation was directed into the detection axis via a baffled en-trance arm and the fluorescence was captured by a filtered (Barr Associates), gated CPM (Perkin Elmer) mounted at right-angles to the laser beam. The pump and probe lasers were typically operated with a pulse repetition frequency of 2.5 Hz.
A LabView™ program controlled the experiment via a GPIB interfaced to a delay generator (Berkley Nucleon-ics Corporation, BNC 555) and an oscilloscope (LeCroy LT264). The time between the photolysis and probe lasers was controlled by the delay generator, and OH time profiles were built-up by scanning the delay between the lasers over 200 points. At each time point the OH fluorescence signal
was integrated across its entire decay on the oscilloscope be-fore being transferred for storage on the computer.
Gases were introduced to the flow tube via calibrated mass flow controllers (MKS). Nitrogen (10 SLM), was passed through a water bubbler (HPLC grade) and then into a man-ifold to mix with oxygen (1 SLM), ozone (≤10 standard cu-bic centimetres – SCCM) and a reagent gas (≤40 SCCM), before admission into the flow tube. Although the O2
mix-ing ratio of the total flow was only∼0.1, this was sufficient to drive completely RO2formation in the flow tube (and OH
formation within the FAGE cell in the presence of NO), and so behaves in the same way as an O2fraction of 0.2. Ozone
from an ozone generator (Easelec, ELO-3G) was used di-rectly to fill a 5 L Pyrex bulb, and then pressurised with nitro-gen (up to 2 bar) to give concentrations between 1–3 %. The reagent gases, methanol, n butane, n pentane, ethene, iso-prene and cyclohexane were degassed by freeze pump thaw-ing, and known concentrations were prepared in Pyrex 5 L bulbs. Pressure gauges (MKS) were used to determine the bulb concentrations and the pressure in the flow tube and FAGE cell.
The OH generated (approximately 1010molecule cm−3) via the photolysis of ozone in the presence of H2O vapour
(Reactions R1–R2) reacted rapidly with the added reagents (at a rate of > 1000 s−1)in the presence of O2forming
per-oxy radicals (Reactions R6 or R7) or in the case of methanol, HO2formed via the following reactions:
OH+CH3OH→CH2OH+H2O (R15)
CH2OH+O2→HO2+CH2O (R16)
or
OH+CH3OH→CH3O+H2O (R17)
CH3O+O2→HO2+CH2O (R18)
OH reacts with methanol, predominantly forming CH2OH
(reported yields of 0.75–0.85; Atkinson et al., 2004) (Re-action R15) which then rapidly reacts with O2 (9.6×
10−12cm3molecule−1s−1)(Atkinson et al., 2004) to form HO2 (Reaction R16). The other, minor, abstraction
chan-nel produces CH3O, which reacts slower with O2 (1.92×
10−15cm3molecule−1s−1) (Atkinson et al., 2004) to pro-duce HO2(Reactions R17 and R18). HO2generated in the
system was detected by adding nitric oxide (NO-99.95 %, BOC) to the FAGE expansion cell (Fig. 2) to titrate to OH for subsequent detection (Reaction R5). The NO flow, con-trolled by a mass flow controller (Brookes) (0–50 SCCM), was injected into the centre of the FAGE cell, via 3.2 mm stainless steel tubing, approximately 13.75 cm below the pin-hole. The fluorescence signal observed when NO was added to the expansion cell derived from OH and converted HO2
of Reaction (R5), which is a function of the amount of NO added and the contact time in the expansion cell. For com-plete conversion of HO2to OH in the detection cellαwill
equal 1. If this is the case, in the presence and absence of methanol there should be no overall change in the initial flu-orescence signal when NO was added as the OH lost in Reac-tion (R15) is rapidly converted to HO2in Reaction (R16) and
then back to OH via reaction with NO. In the time-resolved experiments, a 6 SCCM flow of NO was found to provide the maximum conversion of HO2to OH (close to 100 %).
2.3 Model comparison
The measured HO2 yields from the different RO2 species
studied have been compared with model predictions based on the Master Chemical Mechanism (MCM) version 3.2 (http://mcm.leeds.ac.uk/MCM/home.htt) (Jenkin et al., 1997, 2003; Carslaw et al., 1999b; Saunders et al., 2003; Bloss et al., 2005). The chemical reactions which convert the various VOC tested to OH that were incorporated in the model are listed explicitly in the Supplementary information (SI). The MCM makes the assumption that alkoxy radicals either react with O2to form a carbonyl species and HO2or decompose
(or in the case of the > C3 alkane-derived alkoxy radicals,
isomerise) to form a hydroxyalkyl radical. Within a low tem-perature FAGE expansion, however, in the presence of NO, the reaction of alkoxy radicals and NO may begin to com-pete as the rate of decomposition and isomerisation slows considerably at reduced temperatures (as discussed further in Sect. 4, temperatures may drop as low as 25 K within the jet and remain below ambient temperatures in the region be-tween NO injection and detection; Creasey et al., 1997b). To account for this, Reaction (R19) has been included in model predictions with all rate coefficients for the reaction of var-ious RO radicals with NO taken from the review paper by Heicklen (2007).
RO+NO−→M RONO (R19)
For reactions between alkoxy radicals and NO which do not have reported rate coefficients, kRO+NO=3.3×
10−11cm3molecule−1s−1, (average rate coefficient for re-action of C3 – C5 RO radicals with NO) was assumed.
The model was initialised with the radical concentrations used and [NO] and [O2] which encompassed
experimen-tal conditions within the FAGE expansion cell. The concen-trations of all other intermediate species or products were initialised as zero. [NO] was varied between 1×10¹³–1× 10¹⁵molecule cm−3 depending upon the NO flow rates
in-troduced to each of the FAGE detection cells. For the large FAGE detection cell (of the style cell A), good agreement be-tween the model and experiment is only achieved if the con-centration of NO in the jet is lower than that calculated from the initial NO injection flow rate suggesting that the mixing within the jet is poor for this cell (see Sect. 4.2 for further details). The simultaneous rate equations were solved using
an Excel based integrator, Kintecus (Ianni, 2002). The model runs were 80 ms in duration, which provided sufficient time for complete conversion of peroxy radicals to OH under the time-resolved experimental conditions discussed above.
3 Results
3.1 RO2interferences in HO2measurements using
fieldwork FAGE instrumentation
A variety of RO2 species were generated in the turbulent
flow reactor and introduced into the three FAGE cells, A– C (Fig. 1) described in Sect. 2.1.1. The yield of OH from the different RO2 species for the different cells is given in
Table 1. The flow reactor produces OH and HO2 in equal
quantities in the absence of a hydrocarbon (Fuchs et al., 2011). Upon addition of a hydrocarbon all the OH gener-ated is quickly consumed (on a timescale of the order of 1 m s−1) and RO
2 radicals form. In the case of propane or
methane, the RO2 formed does not yield appreciable OH
(via the formation of HO2)in the FAGE expansion cells in
the presence of NO (as shown by the time-resolved exper-iments, Sect. 3.2, the OH yield from propane was < 4 %), and so any fluorescence signal observed upon NO addition relates solely to the co-generated HO2. The yield of OH
from RO2ispecies can be determined by comparing the
flu-orescence signal observed when a RO2ispecies was present
(HOxsignal(reagent)) with the OH yield from HO2alone (HO2
signal in the propane or methane experiments, which have no interference) using Eq. (1):
Relative OH yield=HOxsignal(reagent)
−HO2signal
HO2signal
. (1) The flows of hydrocarbons were adjusted so that equivalent OH reactivities (kHC+OH[HC]) for each of the hydrocarbons
tested were used to ensure that any other loss of OH in the turbulent flow reactor (e.g. loss to walls) did not bias the rel-ative yields determined.
In a number of experiments the NO concentration added to detection cell A was varied and the ratio of the OH signal observed for propane-derived RO2radicals relative to
ethene-derived RO2 radicals were compared and are shown in
Ta-ble 1 and Fig. 4. As the NO concentration was reduced the interference from alkene-derived RO2radicals decreased. By
varying [NO], it becomes possible to discriminate ambient RO2radicals from ambient HO2radicals and this is discussed
further in Sect. 4.2.
3.2 Time-resolved experiments
To determine the absolute yield of OH from different RO2
radicals in the presence of NO, a range of RO2radicals (or
HO2 in the case of methanol) were generated by the
Table 1. Experimentally determined OH yields (derived using Eq. 1) from peroxy radicals (RO2→HO2→OH) in continuous flow ex-periments for FAGE cells operated under fieldwork conditions and comparison with the MCMv3.2 OH yield. The modelled OH yield was determined using Eq. (4).
Source of peroxy radicals
Flow of NO (SCCM)
Cell A, OH yield – Residence time:
∼0.9 msa – Typical NO flow used during fieldwork: 50 SCCMb
– Flow rate through pinhole: 4.8 SLM – Cell Pressure: 0.9 Torr
MCM OH yield (referenced to initial [RO2])
assuming a reaction time of 0.9 ms, a temperature of 255 K and [NO] = 1×
1014molecule cm−3
Cell B, OH yield – Residence time:
∼1.9 msc – Typical NO flow used during fieldwork: 10 SCCM – Flow rate through pinhole: 3 SLM – Cell Pressure: 1 Torr
MCM OH yield (referenced to initial [RO2])
assuming a reaction time of 1.9 ms, a temperature of 255 K and [NO] = 1×
1014molecule cm−3
Cell C, OH yield – Residence time:
∼60 msc – Typical NO flow used during fieldwork: 100 SCCM – Flow rate through pinhole: 3.5 SLM – Cell Pressure: 1.5 Torr
MCM OH yield (referenced to initial [RO2])
assuming a reaction time of 70 ms, a temperature of 298 K and [NO] = 9.5×
1014molecule cm−3
Ethene 10 20 30 40 50 100
0.057±0.033 0.073±0.029 0.098±0.025 0.157±0.047 0.172±0.057 –
0.170
0.463±0.030 – – – – – 0.446 – – – – –
0.947±0.073 0.936
Methanol 50 0.756±0.273 1.000 – –
Isoprene 50 0.178±0.075 0.175 – 0.849±0.057 0.871
Propane 50 0.000±0.053 0.004 0.000±0.102 0.004 –
Methane 100 – – 0.000±0.091 4.8×10⁻⁴
Cyclohexane 100 – – 0.606±0.051 0.575
Toluene 100 – – 0.874±0.072 0.900
aDetermined by computational fluid dynamics, for further details refer to Creasey et al. (1997b).bExperiments during which the NO concentration was varied from 10–50 SCCM and compared to modelled OH yields (see Fig. 4) suggest that the NO that mixes into to the air flow is actually 5.5 times less than the NO that is injected.cEstimated from comparison of experimentally determined OH yield from ethane-derived RO
2radicals and MCM-predicted yields.
was sufficient time for complete conversion of RO2to OH.
The time-resolved flow tube experiments were not performed on a field instrument used for ambient HO2 detection and
so the purpose of these experiments, rather than gauge the level of interference suffered, was to experimentally deter-mine the yield of OH from a range of RO2 radicals in the
presence of NO to compare to MCM recommendations. The time-resolved experiments enabled long reaction times to be reached, allowing the conversion of RO2to OH to proceed
to completion, and providing a measure of the asymptotic yields of HO2.
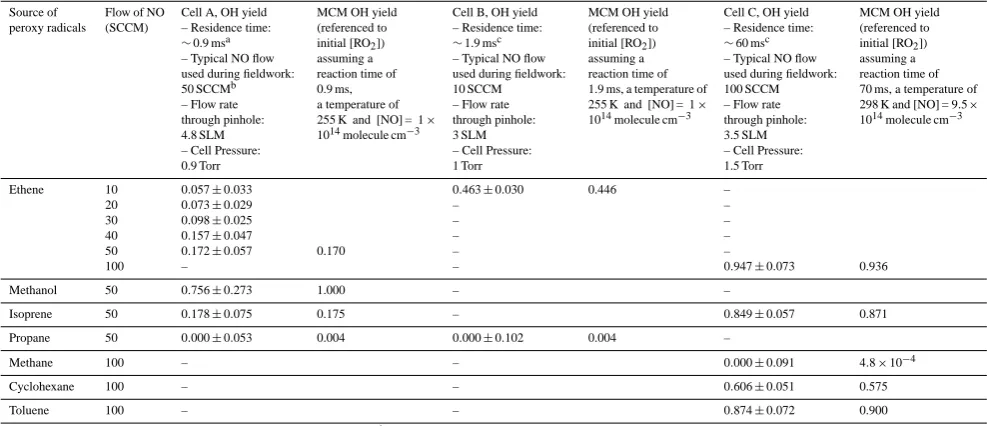
The time-resolved OH signals observed for a selection of RO2 species tested are shown in Fig. 3, and Table 2
sum-marises the OH yields for all RO2 investigated. In the
ab-sence of reagent, an OH signal was observable (upper panel, Fig. 3) which decayed at a rate of∼25 s−1. This loss can be
attributed to reaction of OH with ozone that was present and diffusion of the radical out of the photolysis beam area. Upon addition of a reagent to the flow tube, OH was converted to RO2 at > 1000 s−1. This rapid conversion ensured that the
different RO2generated were present at the same
concentra-tion as each other (allowing relative yields to be determined) and that all the OH initially generated was consumed in the flow tube (given the residence time of 4 s) thus allowing a single exponential fit to be applied to the RO2 signals
dis-played in the lower panel of Fig. 3. The slow decay (∼5 s−1) of the radical signal, displayed in the lower panel of Fig. 3, may be attributed primarily to diffusion of the radicals out of the photolysis beam area and, to a lesser extent (no greater than 1 s−1), to radical–radical reaction.
As the initial OH concentration generated and subsequent HO2 or RO2 concentration generated within the flow tube
were uncalibrated, the absolute OH yields within the FAGE expansion cell from the different RO2 species were
deter-mined by comparing with the OH signal observed from HO2
generated in the methanol experiments which has a 100 % yield. An exponential function of the form: OH signal =y0+
A×exp(−B×probe delay time)was fitted to each OH tem-poral profile associated with the different RO2species
inves-tigated. To determine the relative yields of OH, the ratio of theAfactor for each fit relative to theAfactor determined for the methanol fit was calculated using Eq. (2):
Relative OH yield=Afactor(reagent): Afactor(methanol). (2)
In agreement with Fuchs et al. (2011), a large OH yield from alkene-derived RO2radicals was observed (see Table 2)
when NO was present in the FAGE cell. Smaller, but still sig-nificant, OH yields were also observed for RO2radicals
de-rived from cyclohexane,n butane andnpentane (Table 2); the OH signal observed for propane-derived RO2 radicals
was negligible (upper limit of 4 %).
In several experiments, it was found that ethene-derived RO2radicals when compared to HO2from methanol had OH
yields greater than one. The formation of β-hydroxy per-oxy radicals is fast in the flow tube, and, if complete RO2
titration to HO2 and ultimately to OH was occurring in the
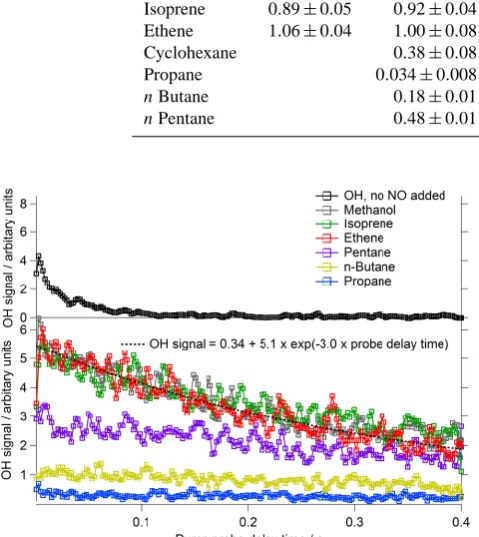
Table 2. OH yields in time-resolved experiments from peroxy radicals determined using Eqs. (2) and (3); the MCMv3.2 OH yield is provided
in the final columns for comparison. The modelled OH yield was determined using Eq. (4) calculated after 9.8 ms integration time. The model was constrained with a [NO] = 1×10¹⁴molecule cm−3and a temperature = 298 K (fourth column) or [NO] = 1×10¹⁴molecule cm−3and a temperature = 255 K (final column).
Source of OH yield OH Yield MCM OH yield MCM OH yield peroxy (referenced (referenced (referenced to (referenced to radicals to methanol) to ethene) initial [RO2]) at 298 K initial [RO2]) at 255 K
Methanol 1.00±0.08 0.85±0.09 1.00 – Isoprene 0.89±0.05 0.92±0.04 0.90 – Ethene 1.06±0.04 1.00±0.08 0.99 0.90 Cyclohexane 0.38±0.08 0.74 0.36 Propane 0.034±0.008 0.01 –
nButane 0.18±0.01 0.13 0.12
nPentane 0.48±0.01 0.62 0.49
Fig. 3. (Upper panel) time evolution of OH formed in the flow
tube by laser-photolysis of O3in humidified air in the absence of
reagent with no NO added to the FAGE cell. The observed decay of
∼25 s−1may be attributed to reaction of OH with ozone and dif-fusion of the radical out of the photolysis beam area. (Lower panel) typical time-resolved experiments showing the OH signal from iso-prene (green), ethene (red), methanol (grey),npentane (purple),
nbutane-derived (mustard) and propane-derived (blue) peroxy rad-icals that was observed when 6 SCCM NO was added to the FAGE cell, and the relevant VOC reagent added to the flow tube to con-vert OH quantitatively to RO2. The dashed line shows the fit to
the OH signal from ethene-derived RO2radicals of the function:
OH signal =y0+A×exp(−B×probe delay time). The signal
de-cay (∼5 s−1)observed in the lower panel (i.e. the B parameter) may be attributed primarily to diffusion of the radicals out of the photolysis beam area and to a lesser extent (∼1 s−1)to radical-radical reaction. The relative yields were determined from the ratio of theAfactors. See Table 2 for the yields determined.
experiments where the Pyrex bulb containing methanol was left for a full day before use to allow for mixing rather than just a couple of hours, that yields closer to one were obtained
indicating that in several of the experiments there may have been insufficient methanol reaching the flow tube owing to extremely slow mixing of the gas bulb. To ensure that the results are not biased by a possible problem with methanol, column 2, Table 2 only includes relative OH yields calculated when the methanol bulb had been left for a day or longer. As this constraint limited the amount of data available, a third column which presents the OH yields referenced with respect to ethene (calculated using Eq. 3) is also provided:
Relative OH yield=Afactor(reagent): Afactor(ethene). (3)
4 Discussion
4.1 Time-resolved experiments. Measured and
modelled HO2yields following complete conversion
of RO2
Under conditions optimised for complete conversion of RO2
radicals to OH in a FAGE cell with added NO (i.e. very long reaction times), the yield of HO2from a number of
alkene-derived RO2species compares favourably to the MCMv3.2
predictions of the OH yield determined using Eq. (4) after a reaction time of 9.8 ms, as shown in Table 2. This suggests that the yield of HO2from other RO2species not measured
here can be derived with some confidence from MCM pre-dictions for this particular experimental set-up.
MCM OH yield=modelled[OH]generated model initialised[RO2]
. (4) For greater than C3alkane-derived RO2species, the MCM
also predicts a non-zero HO2 yield. For these species,
re-action with NO produces an alkoxy radical which can react with O2or isomerise forming aβ-hydroxyalkylperoxy
rad-ical in the presence of O2, which for the case ofn
butane-derived peroxy radical is:
C4H9O isom.
−→(HO)C4H8 (R21)
(HO)C4H8+O2→(HO)C4H8O2 (R22)
The alkoxy radical, C4H9O, may also react with NO under
FAGE conditions:
C4H9O+NO→C4H9ONO (R23)
As shown in Reactions (R8–R11) theβ-hydroxyalkylperoxy radical can react further with NO and decompose rapidly in the presence of O2 to form HO2. However, as seen in
Ta-ble 2, the MCM over-predicts the yield of HO2 at 298 K
from n pentane and cyclohexane-derived peroxy radicals, and under-predicts the OH yield fromnbutane-derived alka-nes. The modelled to measured agreement fornpentane and cyclohexane-derived RO2radicals can be improved if the rate
coefficient for isomerisation (Reaction R21) is reduced by as-suming a lower temperature; it was found by varying the tem-perature in the model that 255 K provided the best agreement for all RO2species considered (Table 2). In the case of
cyclo-hexane, the rate coefficient for isomerisation (taken from the MCMv3.2) decreases from 6.3×10⁴s−1to 2.1×10³s−1as the temperature was reduced from 298 K to 255 K. Stevens et al. (1994) report a temperature of 245 K within the Penn State FAGE instrument as an airstream enters the detection cell and accelerates to velocities of > 300 m s−1; at the laser detection axis the velocity is reduced to∼50 m s−1and the air temperature increases to ambient levels once more. Sim-ilarly, measurements of rotational temperatures and compu-tational fluid dynamic (CFD) calculations performed to de-termine the temperature and density profiles of an airstream within a Leeds FAGE detection cell, type A (Fig. 1a), suggest that air temperatures drop as low as 25 K in the first 2 cm in the detection cell beneath the pinhole as the airstream ex-pands supersonically and reaches velocities of 750 m s−1 be-fore slowing and increasing back to ambient temperatures at the detection axis (Creasey et al., 1997b). Taking these tem-perature profiles into account, it is expected that the mean temperature experienced between pinhole and the detection axis will be below ambient and if this is the case the rate co-efficient for isomerisation will slow considerably (Orlando et al., 2003). At lower temperatures the reaction between an alkoxy radical and NO (Reaction R19) can begin to compete with the isomerisation Reaction (R21) and can, as a result, lower the overall OH yield observed from these RO2radicals.
This effect reduces the agreement between the experimental and modelled OH yield fromnbutane-derived RO2further
suggesting that the rate coefficient for isomerisation of the C4H9O alkoxy radical may actually be faster than assumed
in the model. There is very little information on the tempera-ture dependence associated with the rate ofβ-hydroxyalkoxy decomposition in the literature. A theoretical temperature de-pendence for the rate of decomposition of ethene-derived
β-hydroxyalkoxy radical has been reported (Kukui and Le Bras, 2001):
kdecomp.=1.1×10¹³[s−1].e
−41.84[KJ mole−1]
RT . (5)
When this temperature dependence is included in model cal-culations, assuming a temperature of 255 K, the OH yield predicted is reduced by∼10 % from calculations assuming a temperature of 298 K (Table 2) as the rate coefficient for de-composition decreases from 5.1×10⁵s−1to 3.0×10⁴s−1. Although likely to be similar to that of the ethene-dervied alkoxy radical, no information on the temperature depen-dence of isoprene-derived alkoxy radical decomposition ex-ists in the literature so the impact on the OH yield at reduced temperatures is not considered here.
Magnitude of the interference for fieldwork instruments
For the three fieldwork FAGE cells tested (Fig. 1) which have different residence times and, hence reaction times for RO2 conversion to OH, the yield of OH from the
alkene-derived RO2 radicals was variable. For cell A, CFD
interference; at reduced temperatures, however, the impact of NO becomes more complex: increasing the concentration of NO will increase the rates of Reactions (R3) and (R5) but also increases the rate of Reaction (R19). For alkoxy radicals which display a strong temperature dependence with respect to isomerisation, as is the case for the alkoxy radical derived from cyclohexane (CHEXO), increasing NO concentrations beyond a certain concentration may actually lead to a reduc-tion in the level of interference observed as Reacreduc-tion (R19) begins to compete effectively with Reaction (R21). Model simulations looking at the yield of OH from cyclohexane-derived RO2radicals at 255 K predict that at a residence time
of 9.8 ms (time over which time-resolved experiments were run) the yield of OH will increase with increasing [NO] until a NO concentration of 1.2×10¹⁴molecule cm−3is reached and then the yield will begin to decrease as [NO] increases further. Note, if the residence time is increased, less NO is required to achieve the maximum yield and vice versa. Un-der the experimental conditions discussed in this paper the OH yield should have been directly proportional to [NO]: InterferenceαResidence time× [NO]
Temperature . (6)
Fuchs et al. (2011) observed a large under-prediction of the OH yield from cyclohexane-derived RO2radicals in the
pres-ence of NO and suggested that the model under-prediction for the yield of OH from this species may reflect a missing ring opening mechanism in the MCM which could promote further HO2formation. Fuchs et al. (2011) used MCMv3.1
which did not contain a ring opening mechanism to estimate the expected level of interference in the Julich FAGE sys-tem. An additional degradation pathway for CHEXO which includes a ring opening route, is included in MCMv3.2 lead-ing to the yield of HO2(and ultimately OH, following
fur-ther reaction) from cyclohexane-derived RO2 radicals
ap-proximately doubling when switching from MCMv3.1 to MCMv3.2 chemistry.
4.2 Minimising the RO2interference further
As highlighted in Table 1, a decrease in the amount of NO in-jected into cell A reduces the OH yield from ethene-derived RO2 radicals. Reducing the sensitivity of the instrument to
the interference, however, leads to a concomitant reduction in HO2sensitivity. As only one NO molecule is required to
titrate one HO2 radical to OH, whilst two or more are
re-quired for RO2to OH titration, it is possible to begin to
dis-criminate between HO2 and RO2 by reducing the amount
of NO mixed into the jet as shown in Fig. 4. For cell A, at an NO concentration of 1×10¹³molecule cm−3, approxi-mately twenty HO2radicals titrate to OH for one RO2i
rad-ical conversion to OH; determined from the ratio “relative OH yield (propane) : relative OH yield (ethene)” with “rela-tive OH yield” calculated using Eq. (1). At this NO concen-tration the 5 min limit of detection of the instrument for HO2
will be∼4×10⁶molecule cm−3and, although higher than
detection limits from earlier campaigns (e.g. the HO2 LOD
during the SOAPEX campaign which took place in Cape Grim in Australia was 5.4×10⁵molecule cm−3for 2.5 min integration time) (Creasey et al., 2003), the instrument re-mains sufficiently sensitive for ambient HO2detection with
minimal RO2 interference (∼5 %). It should be noted that
agreement between the MCMv3.2 model and observations can only be achieved if it is assumed that 5.5 times less NO is mixed fully into the air sample within the FAGE cell than is actually injected. Even when a reduced [NO] is as-sumed, the model predicted HO2: RO2ratio vs. [NO] is not
wholly consistent with the ratio observed experimentally. As displayed in Fig. 4, the observed ratio increases slower than the model predicts as [NO] decreases (most apparent at the lowest [NO]) suggesting an enhanced RO2→OH conversion
relative to HO2→OH conversion. This observation may
in-dicate that HO2is preferentially lost in the cell compared to
RO2radicals, potentially, by more efficient removal of HO2
relative to RO2by H2O clusters (Creasey et al., 2001). This
finding only serves to further highlight the need to experi-mentally determine the level of interference for each individ-ual FAGE system and specific experimental conditions.
As demonstrated by Fig. 4, by varying the amount of NO injected it is possible to switch from conditions where cer-tain RO2 types are efficiently converted to OH (NO > 5×
1013molecule cm−3) to conditions were the conversion is poor (NO < 1×10¹³molecule cm−3). With knowledge of the conversion efficiency of RO2and HO2at different NO
con-centrations, changing the NO flow during ambient measure-ments can selectively provide a measurement of the concen-tration of RO2iand HO2by simultaneously solving Eqs. (7)
and (8):
HOxsignallow[NO]=CHO2,low[NO]
×([HO2] +αlow[NO][RO2i]) (7)
HOxsignalhigh[NO]=CHO2,high[NO]
×([HO2] +αhigh[NO][RO2i]), (8)
where HOx signal is the fluorescence signal observed in
cts s−1mW−1, CHO2 is the sensitivity of the instrument to HO2 (determined by calibration) at a particular NO flow in
units of cm3molecule−1ct s−1mW−1andαis the mean frac-tional contribution of RO2iat a selected [NO].
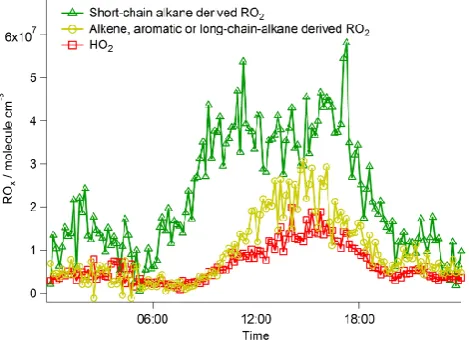
During a recent field project, the Clean Air for London campaign (ClearfLo), this approach was adopted during am-bient measurements. The NO concentration injected into a FAGE cell (cell type A) used during the campaign for se-quential measurements of OH and HO2was varied between
∼1 and 9×10¹³ molecule cm−3; a measurement of the to-tal [RO2] was determined simultaneously using the ROxLIF
cell C operating in ROxmode. The campaign average diurnal
profile of HO2, alkene/aromatic or long-chain alkane-derived
Fig. 4. Modelled (dashed line) and measured (open diamonds)
ra-tio of the OH yield from HO2 signal: RO2 signalas a function of NO
concentration determined for cell A. For best agreement with model predictions, it has to be assumed that the NO concentration that mixes into the ambient air stream is 5.5 times lower than the amount actually injected. The error bars represent the fractional error asso-ciated with each measured ratio determined from the 1σ standard deviation of the experiments conducted.
measured is provided in Fig. 5. The [HO2] (red) and [RO2i]
(mustard) have been derived using Eqs. (7) and (8) (i.e. from HO∗2signal observed when using cell A at low and high NO flows; with the sensitivity to HO2and RO2idetermined
ex-perimentally at the two NO flows used). The C1–C3 alkane-derived [RO2] (green) was determined from cell C detection
of total [ROx] with the derived [HO2] and [RO2i] subtracted.
In generating Fig. 5, it was assumed that all RO2i (RO2
species which interfere) had the same conversion efficiency (α)as ethene-derived RO2. This assumption, whilst
reason-able for other RO2radicals derived from other alkenes or
aro-matic VOC, may positively bias the [RO2i] and negatively
bias [HO2] calculated if longer chain alkane-derived RO2
(≥C4) which have a lowerαwere present at significant lev-els. Preliminary box modelling studies run for the ClearfLo project, which were constrained by the measurements of a wide range of VOCs of various classes, demonstrate that aro-matic and alkene RO2species do dominate RO2i, with≥C4
alkane-derived RO2species only contributing 7 % to all RO2i
identified on average. For this particular environment at least (and likely applicable to many others), determining HO2and
RO2i by the methodology discussed here may provide
rea-sonable results.
An alternative approach to partial speciation of RO2
radi-cal classes would be to use two FAGE cells in which the RO2
interference is minimised in the first (e.g. cell A, run at a low [NO]) and maximised in the second (e.g. cell C, HOxmode,
run at a high [NO]).
Fig. 5. Campaign averaged diurnal profiles of short-chain alkane
RO2radicals (green), HO2(red) and alkene or aromatic or long-chain alkane-derived RO2 radicals (mustard) from the ClearfLo
project which took place in London (North Kensington) from the 21 July to 18 August 2012.
4.3 Impact on previous field studies
The University of Leeds ground-based FAGE instrument has been operational since 1996 and has taken part in 17 cam-paigns with HO2 measurements made during 13; see
Ta-ble 3 for further details. In some of the earlier campaigns good conversion of HO2 to OH was achieved as two
in-dependent cells were used, e.g. Smith et al. (2006), with the conditions of one cell optimised for HO2detection, and
so a significant portion of RO2i, if present, may also have
been titrated to OH, constituting an interference. Many of the previous campaigns took place under relatively clean, un-polluted conditions, for example EASE-96 (Carslaw et al., 1999a), EASE-97 (Creasey et al., 2002; Carslaw et al., 2002), SOAPEX (Creasey et al., 2003; Sommariva et al., 2004), NAMBLEX (Sommariva et al., 2006), CHABLIS (Bloss et al., 2010), RHaMBLe (Whalley et al., 2010) where the con-centrations of RO2i are likely low and methyl peroxy
rad-icals, which do not give an interference (Ren et al., 2004), were expected to be the dominant RO2species; for example,
during EASE-96 the model predicted that 92 % of peroxy radicals present were either HO2 (53 %) or CH3O2(39 %)
during unpolluted conditions (Carslaw et al., 1999a). Simi-larly, for the SOS project (Vaughan et al., 2012), which took place in Cape Verde, models predicted that∼90 % of peroxy radicals were either HO2or CH3O2. In general, models run
for these campaigns tended to over-predict HO2despite
ad-ditional HO2loss mechanisms such as reaction with halogen
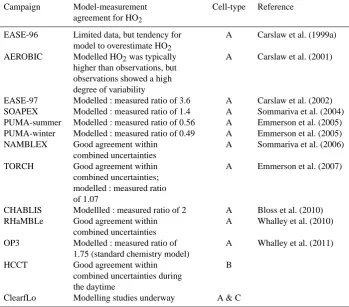
Table 3. Model: measured HO2ratio reported for the University of Leeds ground-based FAGE system during field campaigns where HO2 measurements were made.
Campaign Model-measurement agreement for HO2
Cell-type Reference
EASE-96 Limited data, but tendency for model to overestimate HO2
A Carslaw et al. (1999a)
AEROBIC Modelled HO2was typically
higher than observations, but observations showed a high degree of variability
A Carslaw et al. (2001)
EASE-97 Modelled : measured ratio of 3.6 A Carslaw et al. (2002) SOAPEX Modelled : measured ratio of 1.4 A Sommariva et al. (2004) PUMA-summer Modelled : measured ratio of 0.56 A Emmerson et al. (2005) PUMA-winter Modelled : measured ratio of 0.49 A Emmerson et al. (2005) NAMBLEX Good agreement within
combined uncertainties
A Sommariva et al. (2006)
TORCH Good agreement within combined uncertainties; modelled : measured ratio of 1.07
A Emmerson et al. (2007)
CHABLIS Modellled : measured ratio of 2 A Bloss et al. (2010) RHaMBLe Good agreement within
combined uncertainties
A Whalley et al. (2010)
OP3 Modelled : measured ratio of 1.75 (standard chemistry model)
A Whalley et al. (2011)
HCCT Good agreement within combined uncertainties during the daytime
B
ClearfLo Modelling studies underway A & C
were in relatively good agreement (TORCH-1) (Emmerson et al., 2007). If elevated concentrations of alkene-derived, aromatic-derived and higher alkane-derived RO2 species
were present, the true ambient HO2 concentrations, as
op-posed to HO∗2, were likely lower than reported. It is possible, although difficult to verify without observations of speciated RO2, that the conclusions drawn from these observations, for
example, that additional HO2sources in models are required
to replicate observations, may be in error.
Under the operating conditions employed during the OP3 campaign, the instrument was relatively insensitive to detec-tion of RO2species. The experiments presented here reveal
a 17 % yield of OH due to the decomposition of ethene-derived RO2 in the presence of NO in the FAGE detection
cell under OP3 conditions. This provides an upper limit to the HO2yield from RO2species during OP3 as, under conditions
in which the interference signal was maximised (Sect. 3.2), ethene-derived RO2species provided the largest HO2yield
compared with other RO2species. Model simulations
(Whal-ley et al., 2011) suggested that up to 2.1×10⁸molecule cm−3
of potentially interfering RO2 species were present at
so-lar noon during OP3 (with isoprene-derived peroxy rad-icals contributing ∼60 % to this total), and thus up to 3.5×10⁷molecule cm−3of the HO2 concentration may be
attributed to these species (∼10 % of the total HO2 signal
observed; Whalley et al., 2011). Model comparisons with the radical measurements made during the campaign demon-strated a large missing OH source and over-predicted the HO2observations. The small positive bias on the HO2
obser-vations, owing to the small yield of HO2from RO2species,
only serves to reduce the modelled to measured agreement further. For the HCCT-2010 campaign, the potential impact of the interfering RO2species is greater (Table 1) owing to
the smaller cell (with a longer inlet) and longer residence time employed. The campaign took place in a pine forest, close to the summit of Mount Schmücke in the Thüringer Wald mountain range in East Germany, during September and October 2010. VOC measurements were made down-wind of the measurement site. Only low concentrations of isoprene (50 pptv) were detected, however, suggesting that the concentration of RO2iwere also low.
5 Conclusions and further work
Recent studies conducted on a number of different fluo-rescence cells used in the FAGE instrument at Leeds have demonstrated that alkene- and aromatic-derived RO2species
in FAGE detection cells and, therefore, positively bias HO2
observations if left uncorrected. Many FAGE groups now re-port HO∗2 for comparison with atmospheric chemistry box models to include any interference from RO2i. As
demon-strated in this study, the magnitude of this interference is crit-ically dependent on the cell design, quantity of NO used in the titration, the residence time and mean temperature of the air stream within the FAGE cell. The interference may be minimised by reducing NO concentrations and/or residence time, and although such a reduction will also reduce the sen-sitivity of the instrument to HO2(albeit to a lesser extent than
the reduction in the sensitivity to RO2radicals) it will still be
possible to detect ambient levels HO2using FAGE.
In laboratory, laser-flash photolysis experiments, under conditions optimised for complete conversion of RO2
radi-cals to OH in a FAGE cell, the yield of HO2from a number
of alkene-derived RO2species could be measured, and
com-pared favourably with MCMv3.2 predictions. This suggests that the yield of HO2from other alkene-derived or
aromatic-derived RO2species not tested here, but which are expected
to exhibit high yields, could be determined from MCM pre-dictions. The ability to discriminate between HO2and RO2i
radicals, as illustrated for the ClearfLo project, is not only of great value for field measurements (and subsequent model comparisons), but such instrumentation may be used to selec-tively determine the yield of HO2in laboratory experiments
under conditions where RO2 radicals may also be present.
Important applications, for example, would be the experi-mental verification of a significant prompt HO2 yield from
OH initialised isoprene oxidation, as proposed by Peeters et al. (2009) or prompt HO2yields from OH initialised
oxida-tion of aromatics (Nehr et al., 2012).
This study demonstrates that some of the previous HO2
measurements that depend upon chemical titration to OH by NO may suffer an interference due to partial detection of RO2
radicals. Under conditions where there are significant alkene, aromatic or long-chain alkanes present, the HO∗2 concentra-tion which was measured will have been higher than the HO2
concentration that was actually present. Models have over-estimated HO2 concentrations under such conditions, and
this over-estimation would only increase if the observations of HO2were corrected for the interference suggesting there
is a major gap in our understanding of the chemistry control-ling these radicals.
Acknowledgements. We would like to thank the National Centre
for Atmospheric Science (NCAS) for financial support and EU-ROCHAMP is acknowledged for PWS.
Edited by: A. Hofzumahaus
References
Atkinson, R., Baulch, D. L., Cox, R. A., Hampson, R. F., Kerr, J. A., Rossi, M. J., and Troe, J.: Evaluated kinetic, photochemi-cal and heterogeneous data for atmospheric chemistry .5. IUPAC Subcommittee on Gas Kinetic Data Evaluation for Atmospheric Chemistry, J. Phys. Chem. Ref. Data, 26, 521–1011, 1997. Atkinson, R., Baulch, D. L., Cox, R. A., Crowley, J. N.,
Hamp-son, R. F., Hynes, R. G., Jenkin, M. E., Rossi, M. J., and Troe, J.: Evaluated kinetic and photochemical data for atmospheric chem-istry: Volume I – gas phase reactions of Ox, HOx, NOxand SOx
species, Atmos. Chem. Phys., 4, 1461–1738, doi:10.5194/acp-4-1461-2004, 2004.
Bloss, C., Wagner, V., Jenkin, M. E., Volkamer, R., Bloss, W. J., Lee, J. D., Heard, D. E., Wirtz, K., Martin-Reviejo, M., Rea, G., Wenger, J. C., and Pilling, M. J.: Development of a detailed chemical mechanism (MCMv3.1) for the atmospheric oxidation of aromatic hydrocarbons, Atmos. Chem. Phys., 5, 641–664, doi:10.5194/acp-5-641-2005, 2005.
Bloss, W. J., Camredon, M., Lee, J. D., Heard, D. E., Plane, J. M. C., Saiz-Lopez, A., Bauguitte, S. J.-B., Salmon, R. A., and Jones, A. E.: Coupling of HOx, NOxand halogen chemistry in
the antarctic boundary layer, Atmos. Chem. Phys., 10, 10187– 10209, doi:10.5194/acp-10-10187-2010, 2010.
Carslaw, N., Creasey, D. J., Heard, D. E., Lewis, A. C., McQuaid, J. B., Pilling, M. J., Monks, P. S., Bandy, B. J., and Penkett, S. A.: Modeling OH, HO2, and RO2radicals in the marine bound-ary layer – 1. Model construction and comparison with field measurements, J. Geophys. Res.-Atmos., 104, 30241–30255, doi:10.1029/1999jd900783, 1999a.
Carslaw, N., Jacobs, P. J., and Pilling, M. J.: Modeling OH, HO2,
and RO2radicals in the marine boundary layer 2. Mechanism
re-duction and uncertainty analysis, J. Geophys. Res.-Atmos., 104, 30257–30273, doi:10.1029/1999jd900782, 1999b.
Carslaw, N., Creasey, D. J., Harrison, D., Heard, D. E., Hunter, M. C., Jacobs, P. J., Jenkin, M. E., Lee, J. D., Lewis, A. C., Pilling, M. J., Saunders, S. M., and Seakins, P. W.: OH and HO2radical
chemistry in a forested region of north-western Greece, Atmos. Environ., 35, 4725–4737, doi:10.1016/S1352-2310(01)00089-9, 2001.
Carslaw, N., Creasey, D. J., Heard, D. E., Jacobs, P. J., Lee, J. D., Lewis, A. C., McQuaid, J. B., Pilling, M. J., Baugui-tte, S., Penkett, S. A., Monks, P. S., and Salisbury, G.: East-ern Atlantic Spring Experiment 1997 (EASE97) – 2. Compar-isons of model concentrations of OH, HO2, and RO2with
mea-surements, J. Geophys. Res.-Atmos., 107, ACH5.1–ACH5.16, doi:10.1029/2001jd001568, 2002.
Cleary, P. A., Romero, M. T. B., Blitz, M. A., Heard, D. E., Pilling, M. J., Seakins, P. W., and Wang, L.: Determination of the temperature and pressure dependence of the reaction OH+C2H4 from 200–400 K using experimental and master
equation analyses, Phys. Chem. Chem. Phys., 8, 5633–5642, doi:10.1039/B612127f, 2006.
Commane, R., Floquet, C. F. A., Ingham, T., Stone, D., Evans, M. J., and Heard, D. E.: Observations of OH and HO2
rad-icals over West Africa, Atmos. Chem. Phys., 10, 8783–8801, doi:10.5194/acp-10-8783-2010, 2010.
tropo-sphere by laser-induced fluorescence, J. Chem. Soc. Faraday T., 93, 2907–2913, doi:10.1039/A701469d, 1997a.
Creasey, D. J., Heard, D. E., Pilling, M. J., Whitaker, B. J., Berzins, M., and Fairlie, R.: Visualisation of a super-sonic free-jet expansion using laser-induced fluorescence spec-troscopy: Application to the measurement of rate constants at ultralow temperatures, Appl. Phys. B-Lasers O, 65, 375–391, doi:10.1007/s003400050285, 1997b.
Creasey, D. J., Heard, D. E., and Lee, J. D.: OH and HO2
mea-surements in a forested region of north-western Greece, Atmos. Environ., 35, 4713–4724, doi:10.1016/S1352-2310(01)00090-5, 2001.
Creasey, D. J., Heard, D. E., and Lee, J. D.: Eastern Atlantic Spring Experiment 1997 (EASE97) 1. Measurements of OH and HO2
concentrations at Mace Head, Ireland, J. Geophys. Res.-Atmos., 107, 4091, doi:10.1029/2001jd000892, 2002.
Creasey, D. J., Evans, G. E., Heard, D. E., and Lee, J. D.: Mea-surements of OH and HO2concentrations in the Southern Ocean
marine boundary layer, J. Geophys. Res.-Atmos., 108, 4475, doi:10.1029/2002jd003206, 2003.
Davis, D. D., Rodgers, M. O., Fischer, S. D., and Asai, K.: An exper-imental assessment of the O3/H2O interference problem in the
detection of natural levels of OH via laser induced fluorescence, Geophys. Res. Lett., 8, 69–72, doi:10.1029/GL008i001p00069, 1981.
Emmerson, K. M., Carslaw, N., Carpenter, L. J., Heard, D. E., Lee, J. D., and Pilling, M. J.: Urban Atmospheric Chemistry During the PUMA Campaign 1: Comparison of Modelled OH and HO2 Concentrations with Measurements, J. Atmos. Chem., 52, 143– 164, 2005.
Emmerson, K. M., Carslaw, N., Carslaw, D. C., Lee, J. D., McFig-gans, G., Bloss, W. J., Gravestock, T., Heard, D. E., Hopkins, J., Ingham, T., Pilling, M. J., Smith, S. C., Jacob, M., and Monks, P. S.: Free radical modelling studies during the UK TORCH Campaign in Summer 2003, Atmos. Chem. Phys., 7, 167–181, doi:10.5194/acp-7-167-2007, 2007.
Faloona, I., Tan, D., Brune, W., Hurst, J., Barket, D., Couch, T. L., Shepson, P., Apel, E., Riemer, D., Thornberry, T., Carroll, M. A., Sillman, S., Keeler, G. J., Sagady, J., Hooper, D., and Pater-son, K.: Nighttime observations of anomalously high levels of hydroxyl radicals above a deciduous forest canopy, J. Geophys. Res.-Atmos., 106, 24315–24333, doi:10.1029/2000jd900691, 2001.
Fuchs, H., Holland, F., and Hofzumahaus, A.: Measurement of tropospheric RO2 and HO2 radicals by a laser-induced
fluorescence instrument, Rev. Sci. Instrum., 79, 084104, doi:10.1063/1.2968712, 2008.
Fuchs, H., Bohn, B., Hofzumahaus, A., Holland, F., Lu, K. D., Nehr, S., Rohrer, F., and Wahner, A.: Detection of HO2by
laser-induced fluorescence: calibration and interferences from RO2
radicals, Atmos. Meas. Tech., 4, 1209–1225, doi:10.5194/amt-4-1209-2011, 2011.
Fuchs, H., Dorn, H.-P., Bachner, M., Bohn, B., Brauers, T., Gomm, S., Hofzumahaus, A., Holland, F., Nehr, S., Rohrer, F., Tillmann, R., and Wahner, A.: Comparison of OH concentration measure-ments by DOAS and LIF during SAPHIR chamber experimeasure-ments at high OH reactivity and low NO concentration, Atmos. Meas. Tech., 5, 1611–1626, doi:10.5194/amt-5-1611-2012, 2012.
Fuchs, H., Hofzumahaus, A., Rohrer, F., Bohn, B., Brauers, T., Dorn, H. P., Haseler, R., Holland, F., Kaminski, M., Li, X., Lu, K., Nehr, S., Tillmann, R., Wegener, R., and Wahner, A.: Experimental evidence for efficient hydroxyl radical re-generation in isoprene oxidation, Nat. Geosci., online first, doi:10.1038/NGEO1964, 2013.
Hanisco, T. F., Smith, J. B., Stimpfle, R. M., Wilmouth, D. M., An-derson, J. G., Richard, E. C., and Bui, T. P.: In situ observations of HO2and OH obtained on the NASA ER-2 in the high-ClO
con-ditions of the 1999/2000 Arctic polar vortex, J. Geophys. Res.-Atmos., 107, 8283, doi:10.1029/2001jd001024, 2002.
Hard, T. M., Obrien, R. J., Cook, T. B., and Tsongas, G. A.: Interfer-ence Suppression in OH FluorescInterfer-ence Detection, Appl. Optics, 18, 3216–3217, doi:10.1364/Ao.18.003216, 1979.
Hard, T. M., Obrien, R. J., Chan, C. Y., and Mehrabzadeh, A. A.: Tropospheric Free-Radical Determination by Fage, Environ. Sci. Technol., 18, 768–777, doi:10.1021/Es00128a009, 1984. Heard, D. E. and Pilling, M. J.: Measurement of OH and
HO2 in the troposphere, Chem. Rev., 103, 5163–5198, doi:10.1021/Cr020522s, 2003.
Heard, D. E., Carpenter, L. J., Creasey, D. J., Hopkins, J. R., Lee, J. D., Lewis, A. C., Pilling, M. J., Seakins, P. W., Carslaw, N., and Emmerson, K. M.: High levels of the hydroxyl radical in the winter urban troposphere, Geophys. Res. Lett., 31, L18112, doi:10.1029/2004gl020544, 2004.
Heicklen, J.: The Decomposition of Alkyl Nitrites and the Reac-tions of Alkoxyl Radicals, in: Advances in Photochemistry, John Wiley & Sons, Inc., 177–272, 2007.
Hewitt, C. N., Lee, J. D., MacKenzie, A. R., Barkley, M. P., Carslaw, N., Carver, G. D., Chappell, N. A., Coe, H., Collier, C., Com-mane, R., Davies, F., Davison, B., DiCarlo, P., Di Marco, C. F., Dorsey, J. R., Edwards, P. M., Evans, M. J., Fowler, D., Furneaux, K. L., Gallagher, M., Guenther, A., Heard, D. E., Helfter, C., Hopkins, J., Ingham, T., Irwin, M., Jones, C., Karunaharan, A., Langford, B., Lewis, A. C., Lim, S. F., MacDonald, S. M., Ma-hajan, A. S., Malpass, S., McFiggans, G., Mills, G., Misztal, P., Moller, S., Monks, P. S., Nemitz, E., Nicolas-Perea, V., Oetjen, H., Oram, D. E., Palmer, P. I., Phillips, G. J., Pike, R., Plane, J. M. C., Pugh, T., Pyle, J. A., Reeves, C. E., Robinson, N. H., Stewart, D., Stone, D., Whalley, L. K., and Yin, X.: Overview: oxidant and particle photochemical processes above a south-east Asian tropical rainforest (the OP3 project): introduction, ratio-nale, location characteristics and tools, Atmos. Chem. Phys., 10, 169–199, doi:10.5194/acp-10-169-2010, 2010.
Hofzumahaus, A., Aschmutat, U., Hessling, M., Holland, F., and Ehhalt, D. H.: The measurement of tropospheric OH radicals by laser-induced fluorescence spectroscopy during the POP-CORN field campaign, Geophys. Res. Lett., 23, 2541–2544, doi:10.1029/96gl02205, 1996.
Holland, F., Hofzumahaus, A., Schafer, R., Kraus, A., and Patz, H. W.: Measurements of OH and HO2 radical concentrations and photolysis frequencies during BERLIOZ, J. Geophys. Res.-Atmos., 108, 8246, doi:10.1029/2001jd001393, 2003.
Ianni, J. C.: available at: http://www.kintecus.com (last access: 5 December 2013), Windows version 2.80 Edn., 2002.