www.atmos-meas-tech.net/9/1247/2016/ doi:10.5194/amt-9-1247-2016
© Author(s) 2016. CC Attribution 3.0 License.
A new plant chamber facility, PLUS, coupled to the atmosphere
simulation chamber SAPHIR
T. Hohaus1,*, U. Kuhn1,a,*, S. Andres1, M. Kaminski1, F. Rohrer1, R. Tillmann1, A. Wahner1, R. Wegener1, Z. Yu1, and A. Kiendler-Scharr1
1Institute of Energy and Climate Research, IEK-8: Troposphere, Forschungszentrum Jülich GmbH, Jülich, Germany
aMax Planck Institute for Chemistry, Department for Multiphase Chemistry, Mainz, Germany *These authors contributed equally to this work.
Correspondence to: A. Kiendler-Scharr ([email protected])
Received: 13 October 2015 – Published in Atmos. Meas. Tech. Discuss.: 16 November 2015 Revised: 24 February 2016 – Accepted: 8 March 2016 – Published: 23 March 2016
Abstract. A new PLant chamber Unit for Simulation (PLUS) for use with the atmosphere simulation chamber SAPHIR (Simulation of Atmospheric PHotochemistry In a large Re-action Chamber) has been built and characterized at the Forschungszentrum Jülich GmbH, Germany. The PLUS chamber is an environmentally controlled flow-through plant chamber. Inside PLUS the natural blend of biogenic emis-sions of trees is mixed with synthetic air and transferred to the SAPHIR chamber, where the atmospheric chemistry and the impact of biogenic volatile organic compounds (BVOCs) can be studied in detail. In PLUS all important environmen-tal parameters (e.g., temperature, photosynthetically active radiation (PAR), soil relative humidity (RH)) are well con-trolled. The gas exchange volume of 9.32 m3which encloses the stem and the leaves of the plants is constructed such that gases are exposed to only fluorinated ethylene propy-lene (FEP) Teflon film and other Teflon surfaces to minimize any potential losses of BVOCs in the chamber. Solar radia-tion is simulated using 15 light-emitting diode (LED) panels, which have an emission strength up to 800 µmol m−2s−1. Results of the initial characterization experiments are pre-sented in detail. Background concentrations, mixing inside the gas exchange volume, and transfer rate of volatile organic compounds (VOCs) through PLUS under different humidity conditions are explored. Typical plant characteristics such as light- and temperature- dependent BVOC emissions are stud-ied using six Quercus ilex trees and compared to previous studies. Results of an initial ozonolysis experiment of BVOC emissions from Quercus ilex at typical atmospheric
concen-trations inside SAPHIR are presented to demonstrate a typ-ical experimental setup and the utility of the newly added plant chamber.
1 Introduction
al., 2011; Di Carlo et al., 2004). This gap in OH reactivity may be explained either by direct emissions or atmospheric oxidation products that are currently not identified as single compounds. It is plausible that large sources of organic com-pounds have not yet been identified (Hallquist et al., 2009; Goldstein and Galbally, 2007). This lack of understanding of BVOC sources may limit bottom-up estimates of SOA for-mation and OVOCs such as acetone.
Due to the importance of BVOCs for atmospheric chem-istry and the large remaining gaps in process level under-standing, BVOCs are a subject of continuous research. One concern with investigations of BVOCs and their impact on at-mospheric chemistry arises from the fact that, under natural conditions, BVOCs are emitted as complex blends, whereas many simulation chamber experiments use single BVOCs or simple mixtures to explore atmospheric chemistry pro-cesses. The use of direct emissions from plants is a way of progressing towards more realistic experimental simulations. Recently a number of setups implementing the use of direct plant emissions in atmospheric chemistry experiments have emerged, ranging from the investigation of BVOC oxidation within a greenhouse (Pinto et al., 2007; Joutsensaari et al., 2005) to designs implementing two separate chambers for independent variation of emission and oxidation conditions (Timkovsky et al., 2014; Wyche et al., 2014; Hao et al., 2009; Mentel et al., 2009; VanReken et al., 2006).
Here we present details of the design and implementation of a PLant chamber Unit for Simulation (PLUS) for use with our atmosphere simulation chamber SAPHIR (Simulation of Atmospheric PHotochemistry In a large Reaction Chamber). The PLUS chamber setup is described in detail and charac-terization experiments quantifying VOC transfer efficiencies and plant emission behavior as a function of key physiolog-ical parameters are discussed. An example of an ozonolysis experiment in SAPHIR using PLUS as a BVOC source is given to show how such experiments can be used to quantify BVOC impacts on atmospheric composition.
2 Facility description
Experiments were conducted in the atmosphere simulation chamber SAPHIR, coupled with a newly developed plant chamber, PLUS, in Jülich, Germany. In brief SAPHIR con-sist of a double-walled Teflon (FEP) film of cylindrical shape (volume 270 m3)and is used for simulation experi-ments studying atmospheric chemistry processes under at-mospherically relevant conditions. Representative concen-tration ranges for experiments are ensured by using ultra-pure zero air, generated from evaporated liquid nitrogen and oxygen (Linde, purity 99.99990 %). To this clean, dry air, trace gases are added according to experimental purpose. The SAPHIR chamber is described in more detail elsewhere (Schlosser et al., 2009; Bohn et al., 2005; Rohrer et al., 2005).
The PLUS facility consists of three containers, which are installed beneath the SAPHIR chamber. The first container is the gas exchange chamber, which houses the plants. When used for experiments with SAPHIR, this chamber is operated with air from the Linde ultra-high purity zero air supply. A second container houses the process control system including standard instrumentation monitoring plant chamber environ-mental conditions. The third container houses a system to pu-rify ambient air from NOx, O3, VOCs, and particles. This air can be used to supply the gas exchange chamber with cleaned outside air instead of zero air. All three components of PLUS are described in more detail in the following sections. 2.1 PLUS plant container design and implementation
A schematic diagram of the container housing the PLUS plant container is shown in Fig. 1. The custom-built con-tainer (Ilkazell Isoliertechnik GmbH, Zwickau, Germany) is gastight and temperature- and light-controlled with outer di-mensions of 2.39 m×3.84 m×2.84 m. Special emphasis of the dynamic plant chamber setup was on contamination-free operation, with some of the contamination prevention strate-gies being adopted from SAPHIR. The walls of the container have a layered structure to provide good thermal insulation while limiting the risk of outgassing from wall materials (see Fig. 2). From the outside to the inside the wall is built of (i) an outer steel housing, (ii) a spray foam insulation of 120 mm thickness, (iii) a stainless steel wall, (iv) an air buffer vol-ume, and (v) a gastight welded stainless steel containment. The side and back walls of this inner containment are made of double-walled (pre-inflated) stainless steel heat exchange panels. Temperature control inside the container is achieved by adjusting the temperature (0 to 50◦C) of the water-based
thermofluid with an externally installed heating/cooling unit (Unistat Chiller, type 055T-H-TP35, Huber, Germany).
The inner volume of the container is divided in three her-metically separated compartments: (i) a light control unit, (ii) the gas exchange unit, and (iii) an interspace also hous-ing the soil. These three compartments are described in more detail in the following.
Figure 1. Schematic diagram of the PLUS plant container. The green lines show the inflow of synthetic air and other gases into PLUS (PLUS inlet) and the red lines are the outflows of PLUS to either instrumentation (PLUS outlet), SAPHIR or the atmosphere.
compartment for the light control unit is air-conditioned by means of an external air cooling system (5.5 kW, Robert Schiessel GmbH, Germany). Recirculating air through the external cooler sustains an (adjustable) continuous under-pressure of∼200 Pa with respect to the gas exchange unit, to ensure mass transfer out of the gas exchange unit in case of any leakage on the window panes. An ultrasonic sound leak test proved the tightness of the glass windows.
The gas exchange unit is setup as follows. A rectangular aluminum frame inside the chamber provides the frame for the 1.80 m×3.52 m×1.45 m gas exchange volume. Teflon film (FEP, 75 µm thickness, Vector Foiltec, Bremen, Ger-many) is mounted across each side and the ceiling of the frame separately. The side wall and the ceiling of the frame are assembled such that the inside of the frame is exposed to the FEP film only. The bottom part of the frame is con-structed as a table-like structure where the surface of the table, except for the holes where the plant stem and leaves reach into the gas exchange volume, is also completely covered with the FEP film. The seal of this table against the frame is achieved by a silicone-based pneumatic gas-ket (Flohreus GmbH, Germany), which is installed along a groove in the rim of the table. While inflated (up to 2 bar) the pneumatic gasket presses the FEP film of the table against the FEP film of the frame. When plants are installed in the gas exchange chamber, the stem and leaves protrude through one of six holes in the table into the gas exchange volume, while the soil is kept beneath the table. Each hole is sealed by fus-ing a rectangular piece of the FEP film around the stem of a plant, separating the soil from the upper parts of the plant.
The piece of rectangular FEP film is then pressed onto the FEP film covering the table using a Teflon ring with a Viton O-ring.
The space around the sealed gas exchange unit is called the interspace. The interspace houses all necessary connec-tions for the installed sensors (e.g. light and temperature sen-sors), plant pots including soil, tubing for the air supply, and the irrigation system. To ensure a low gaseous contaminant level, all cables and tubing are either made of Teflon or have a Teflon cover. The plant pots are made of stainless steel. The interspace is furthermore flushed with high purity air (up to 1 m3h−1) and kept at 31 Pa below the gas exchange unit to avoid transfer of gases from this compartment to the gas ex-change unit.
The new plant chamber PLUS is run in dynamic mode, which means that it is continuously flushed with purge air to (i) sustain CO2 for photosynthetic activity of enclosed plants and (ii) allow purging of emitted trace gases and water vapour. The air supply (see Sect. 2.3 for details) is distributed inside the gas exchange unit using six Teflon tubes with an in-ner diameter (ID) of 0.5 in. Each tube is connected to a Teflon nozzle (0.25 in. ID). Three nozzles are distributed along each side of the plant table, introducing synthetic air into the gas exchange volume. Through the nozzles, flow of air into the gas exchange unit is turbulent, thus ensuring homogeneous mixing.
Air from PLUS can be transferred to SAPHIR via a trans-fer line tube with an ID of 80 mm and a length of 1.89 m that connects the back plane of the gas exchange unit with the bottom plane of SAPHIR (see Fig. 1). The tube is made of perfluoroalkoxy (PFA) and temperature-controlled (typically 60◦C). Directly prior to the inlet to SAPHIR, two wide-bore
valves are situated: one controls the flow towards SAPHIR, the other towards ambient. When only PLUS-related exper-iments are conducted, the airflow is usually directed to the ambient. To prevent pressure fluctuations within the plant chamber by valve switching, the opening width (resistance) of the exhaust valve can be adjusted by a pneumatic posi-tioner to mimic the internal counter-pressure of SAPHIR. The adjustable positioners implemented in both of the trans-fer tube valves also allow dynamic operation of SAPHIR, i.e., only a fraction of VOC-loaded PLUS air may be intro-duced into SAPHIR, while the residual can be vented to am-bient. When plants are installed in PLUS, continuous flow through the gas exchange unit ensures that the plants are sup-plied with CO2and that the emissions of the plants are con-tinuously flushed out of the gas exchange unit.
installed to adjust the pressure difference between the inter-space surrounding the gas exchange unit and ambient atmo-sphere. The pressure in the interspace is kept at a constant pressure of 25±2 Pa over atmosphere. Differential pressures are monitored by means of two fully metal-sealed differ-ential pressure gauges (type Barathon 226A, 200 Pa, MKS, Germany) to control the PLUS pressure gradients. All three valves (plant chamber exhausts and sheath air exhaust) are process-controlled, i.e., the desired pressure differences can be set and are controlled by a feedback control loop in the automatic process control system. The stepwise increase in overpressure from ambient conditions outside the chamber to 56 Pa in the gas exchange unit prevents diffusion of pos-sible contaminants from the outside into the gas exchange unit. The pressure of the PLUS gas exchange unit is al-ways kept 6±2 Pa above the pressure in the SAPHIR cham-ber. This pressure difference ensures flow from the PLUS gas exchange volume to SAPHIR while PLUS is coupled to SAPHIR.
2.2 Air supply and mixing
Two air supply systems can be used for the gas exchange chamber, the SAPHIR air supply and a system utilizing cleaned outside air. As mentioned above the air supply used for SAPHIR is based on mixing O2and N2from liquid reser-voirs (Linde, purity 99.99990 %). This ultra-clean air can be used for PLUS when CO2is added to the gas exchange cham-ber inlet to supply the plants with CO2. This air supply is al-ways used in experiments where both chambers are coupled. Usually for standby operations of the PLUS plant cham-ber cleaned outside air is used. Ambient air is compressed into a stainless steel buffer volume (500 L, 7 bar) by means of four oil-free scroll pumps (Mark, OFMS 15). The large-bore (100 mm ID) inlet tube of the compressor is made from stainless steel and has a recyclable stainless steel mesh fil-ter cartridge (1 µm pore size) for aerosols, which is built into a stainless steel housing installed outdoors at ca. 2 m above ground. The compressed air is dried to a dew point of typ-ically below −40◦C using two columns of molecular sieve and is subsequently scrubbed from VOC contaminants by means of an additional column filled with activated char-coal (both Zander KA-MT 10–95). Highly volatile organic compounds, which might break through this first purification stage, are removed by a second-stage heated VOC converter (Bekokat type CC-120, Beko, Germany). Aerosols are re-moved by two pure Teflon particle filter units (FEP/PTFE, Fluoroflow 33-14710-002-5-E, with 0.2 µm cut off size and 33-14710-825-5-E with 0.05 µm cut off size, Parker Hannifin GmbH, USA) installed in stainless steel housings (VBA-111-BE, Parker Hannifin GmbH, USA).
Trace gases, e.g., CO2, VOCs, and water vapor can indi-vidually be added to the air supply. Both VOC standard com-pounds and CO2are added from gas bottles to the synthetic airflow. Mixing ratios of both additions are controlled by two
mass flow controllers (Mass Stream 6311, Bronkhorst, Ger-many). CO2concentration at the PLUS inlet is kept at the up-per range of naturally occurring conditions of about 500 ppm to maintain vital photosynthesis. Depending on the mass flow rate through the chamber and the amount of leaf biomass in-stalled, typical CO2mixing ratios at the outlet (and represen-tative of inside chamber) are about 450 ppm. Water vapor can be added to the purge air by vaporization of purified (Milli-Q, Millipore Corporation) water in a 25 mm outer diameter stainless steel tube with a length of 30 cm which is heated to 350◦C. Adjusting the liquid flow sustained by a peristaltic pump, the relative humidity of the purge air can be varied between 0 and 100 % .
2.3 Process control unit and analytical instrumentation
For ease of user operation the PLUS facility is equipped with an automated control process unit and standard instrumenta-tion used to monitor environmental condiinstrumenta-tions and trace gas exchange. All process control is based on industrial software and hardware (S7, Siemens, Germany). Parameter settings (flow rate and direction, gas addition, light intensity, tem-perature, pressure gradients, soil water content etc.) can be set by an automatic process control system, or follow pre-programmed adjustable diel courses. For most of these pa-rameters, two-stage (alarm and shut down, respectively) up-per and lower threshold levels are preset for cases of malop-eration and/or malfunction.
Pressures inside the PLUS chamber are monitored by pressure gauges (MKS Barathon 226A). As mentioned be-fore, transfer of air from the PLUS gas exchange chamber to SAPHIR is ensured by relative overpressures. These are monitored continuously, and upper and lower threshold val-ues are defined as shutdown criteria. Light intensity in the chamber is varied by regulating the output of the LED pan-els between 0 and 100 %. Monitoring of the light intensity is provided using a quantum sensor (LI-190SZ-50, LI-COR GmbH, Germany) installed inside the gas exchange volume, situated in the center of the plant table at about canopy height of the installed plants. Distributed over the canopy height of the installed plants, a set of six leaf temperature sensors (type K) is applied to measure leaf temperature. Gas temper-ature inside the gas exchange volume is also measured by a type K temperature sensor which is located approximately in the center (height-, length- and width-wise) of the gas ex-change volume. The soil moisture of each plant is measured individually using a moisture sensor (UMS GmbH Munich, EC-5). The irrigation system is automated such that water drips into the plant pot if the soil moisture falls below a threshold value until the soil moisture rises above a defined threshold.
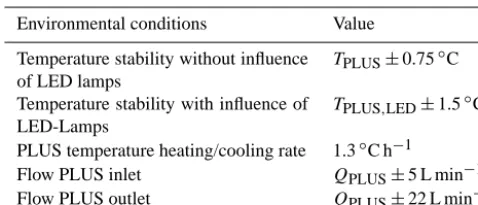
Table 1. Temperature and flow stability for typical operational con-ditions withTPLUS=20◦C andQPLUS=500 L min−1.
Environmental conditions Value
Temperature stability without influence of LED lamps
TPLUS±0.75◦C
Temperature stability with influence of LED-Lamps
TPLUS,LED±1.5◦C
PLUS temperature heating/cooling rate 1.3◦C h−1
Flow PLUS inlet QPLUS±5 L min−1
Flow PLUS outlet QPLUS±22 L min−1
the gas mixture transferred through the transfer line tube. A second sampling line (6 mm Teflon tube) is connected to the PLUS inlet, where the air mixture can be measured before it enters the gas exchange unit.
Gas-phase CO2 and water vapor concentration are mea-sured at the PLUS inlet and outlet by cavity ring down spectroscopy (CRDS, Picarro, model G2301). Measurements for the inlet and outlet are obtained by switching via a valve system between both measurement ports. This al-lows for continuous measurement of the plants transpiration and respiration rates. VOC mixing ratios are measured us-ing a proton-transfer-reaction time-of-flight mass spectrom-eter (PTR-ToF-MS, Ionicon, Austria; Jordan et al., 2009). A valve system is used to switch the measurement point of the PTR-ToF-MS between the PLUS inlet, PLUS outlet, and SAPHIR chamber. Calibrations were performed with diffu-sion sources. The sensitivity of the instrument as checked by custom-made compressed gas standard containing about 670 ppb of isoprene,α-pinene, acetone, other carbonyl com-pounds, and aromatics. The gas standard was diluted to mix-ing ratios from 2 to 13 ppb by means of an advanced liquid calibration unit (LCUa, Ionicon, Austria). For the accuracy of the VOC measurement see Table 2. For VOC specifica-tion two GC/MS/FID systems (7890N GC, 5975 B/C MS, Agilent, USA) are directly coupled to SAPHIR (Kaminski, 2014). Samples were taken every 30 min by an online ther-mal desorption unit (TDSG, Gerstel, Germany). The GC sys-tems were specifically optimized for the quantification of la-bile BVOCs using silanized surfaces. Ozone was removed in the enrichment system by chemical titration with NO. The substance identification was done by the comparison of the samples with certified standard gas mixtures (Apel-Riemer Environmental Inc., USA). In cases where no authentic stan-dards were available the substances were identified by using the specific mass spectra or in the case of the monoterpenes, in addition to the mass spectra identification, the identity is verified by using Kovats indices. Due to its excellent signal stability, the FID signal was used for compound quantifica-tion.
3 Characterization experiments and results 3.1 Temperature and flow stability
As mentioned, the temperature inside the PLUS chamber is adjusted and controlled using heat exchangers at three walls of the container. While this system has relatively slow re-sponse to changes in temperature set points (1–3◦C h−1; see Table 1), it provides good temperature stability in the range 13–35◦C. The system thus allows for the investigation of temperature dependence of biogenic emissions (see below). Table 1 provides further details on the temperature and flow stability performance of PLUS.
3.2 Gas purity and background concentrations
After 2 days of flushing the empty gas exchange chamber with synthetic air from the Linde supply, the purity of gas exiting the gas exchange volume was determined by mea-suring with the PTR-ToF-MS at the inlet and outlet of the gas exchange chamber (see Fig. 1). The PTR-ToF-MS was switched between measuring 15 min at the PLUS inlet and 105 min at the PLUS outlet for a total duration of 12 h. The difference in concentration between the outlet and inlet mea-surements determines the type and level of contamination in-side of the plant gas exchange volume. A relative increase of 48 pptv of acetone between the PLUS inlet and outlet was detected as being the compound with the largest contribu-tion. Isoprene was also identified with a relative contribution of 14 pptv. No other significant contamination could be de-tected. The most likely source for these compounds inside the plant gas exchange volume is the silicon-based pneumatic seal, which seals the plant table against the frame of the gas exchange volume. Overall, contaminant concentrations in the lower ppt range are about 3 orders of magnitude lower than VOCs emitted biogenically, and can be considered negligible for the purpose of our atmosphere simulation experiments. 3.3 Mixing in the PLUS gas exchange volume
As-Table 2. LOD and accuracy (3δerror of the sensitivity) of calibration-based PTR-TOF-MS measurements for VOCs of interest.
VOC Methanol Acetaldehyde Acetone Isoprene α-Pinene Nopinone
LOD [ppt] 601.42 218.37 97.78 80.70 60.12 24.61
Accuracy [%] 8.06 6.48 4.08 4.25 3.89 5.06
Figure 2. Horizontal cross-section through the multi-layered walls of the triple-cage plant chamber system, including the double-walled wall opening and flanges for the transfer tube to SAPHIR.
suming perfect mixing the trace gas concentration should de-pend on the flow of synthetic air in the chamber and the vol-ume of the chamber only and is expected to follow an expo-nential decrease.
Ct=Ct−1×e
−QPLUS,t
VPLUS
, (1)
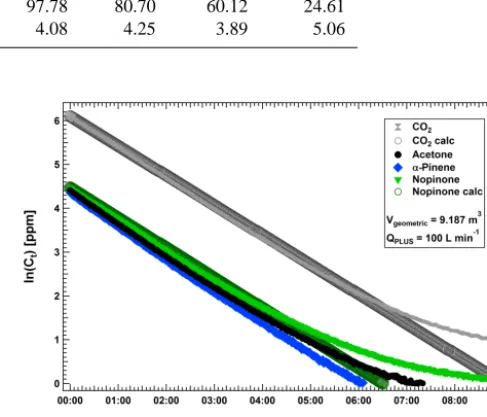
withCt being the trace gas concentration at the timet,Ct−1 the concentration at the previous time step,QPLUS,t the flow through the gas exchange volume at timet,VPLUS the vol-ume of the gas exchange volvol-ume. Figure 3 shows the change in concentration, ln(Ct)vs. time for CO2, acetone,α-pinene and nopinone in the gas exchange volume as measured and calculated. Inhomogeneous mixing in the gas exchange vol-ume (e.g., by stratification or air pockets/regions inside the chamber, where CO2-rich or VOC-rich air remains) would result in deviation from the expected exponential concentra-tion decrease. The ln(Ct)decreased linearly over a period of approximately 8 h, equivalent to exchanging the gas vol-ume in the chamber five times. No significant deviations from the exponential decrease in the trace gas concentration could be observed during this time period. Therefore we can as-sume that the gas exchange chamber is well mixed by using turbulent mixing from the six injection nozzles in the plant table. Note that no significant difference between CO2and
Figure 3. CO2and VOC flush out characteristic inside the PLUS gas exchange volume.
VOCs was observed, indicating that, in the time range ex-plored, VOCs are not lost on chamber walls.
Additionally the CO2flush out was also used to determine the effective volume of the gas exchange chamber. By apply-ing a linear fit to the CO2concentration and using an average of the flow into the chamber during the first 5 h of the exper-iment, the effective volume of the chamber was determined to 9.32±0.5 m3, in agreement with the geometric volume of the gas exchange unit of 9.187 m3.
3.4 Transfer efficiency of selected VOCs at different relative humidity
The transfer efficiency of the complete system of SAPHIR-PLUS was studied using a self-prepared gas standard. The gas standard consisted of acetone, isoprene,α-pinene, nopinone, and methyl salicylate (MeSa) in N2(99.999 % pu-rity). The compounds were chosen to represent on the one hand typical BVOC emissions (isoprene,α-Pinene, MeSa) and on the other hand, a significant variety in molecular masses, boiling point, and solubility in water (see Table 3).
main-Table 3. Summary of physical and chemical properties of VOCs (acetone, isoprene,α-pinene, nopinone, and methyl salicylate) used in gas standard for transfer efficiency characterization.
VOC Molecular formula Molar mass Boiling point (K) k◦Hat 298.15 K (mol kg−1bar)
Acetone C3H6O 58 329.3±0.3a 25a
Isoprene C5H8 68 307±2a 0.036±0.003b
α-Pinene C10H16 136 430±4a 0.029±0.004b
Nopinone C9H14O 138 482.15c 195±60d
Methyl salicylate C8H8O3 152 495.2–496.5a 33.5±4.0e
aNIST chemistry webbook;bLeng et al. (2013);cSigma Aldrich data sheet;dNozière et al. (2001);eKarl et al. (2008)
tained in the PLUS exchange volume throughout the experi-ment.
The addition of water to the synthetic air was varied during the experiment to achieve different relative humidity levels, while the VOC concentration was kept constant. In total four different relative humidity levels (25 to 100 %) were chosen for this experiment. Once a stable RH was achieved inside the gas exchange unit, PLUS was coupled to SAPHIR and VOCs, CO2, and water vapor were transferred from PLUS to SAPHIR. For practical reasons the sequence of experiments was started with RH of 64 %, decreasing stepwise to 50 and 25 % by dilution. In a second experiment the transfer effi-ciency was examined starting at 100 % RH. Note that the RH in SAPHIR was little affected by the injection of air from PLUS. The RH changed in SAPHIR from 1 to about 7 % RH for the first experiment (for a total coupling duration for all RH steps of 6 h) and 0.5 to 3 % for the second experiment (for a total coupling duration of 3 h).
For evaluation of the transfer efficiency, VOC concentra-tions were measured by PTR-ToF-MS with a 1 min time res-olution switching between the PLUS inlet and PLUS out-let and then subsequently between the PLUS outout-let and SAPHIR. After starting VOC addition, the concentration at the PLUS inlet was monitored for about 1 h to verify a sta-ble concentration of VOCs in the inlet flow. Then the PTR-ToF-MS measurements were switched repeatedly to measure between the PLUS outlet and SAPHIR. The VOC concen-trations at the PLUS outlet were measured for 20 min before switching for 40 min to the SAPHIR outlet; thus one mea-surement cycle was 1 h. The coupling of PLUS to SAPHIR was maintained for approximately 1 h, ensuring that con-centration changes in SAPHIR due to continuous inflow of VOC-rich air could be measured.
After 1 h PLUS was decoupled from SAPHIR and the RH was changed. This procedure was repeated for all different RH values. Throughout the experiment the CO2 was used as an inert tracer and measured switching continuously be-tween the PLUS inlet and outlet with one Picarro instrument and separately with a second Pircarro system in SAPHIR. The transfer efficiencies between the PLUS inlet and outlet and between the PLUS outlet and SAPHIR were determined by the ratio of the measured VOC and CO2 concentration
divided by the calculated concentration. The calculated con-centration for PLUS was derived by taking the initial concen-trations measured at the PLUS inlet and calculating the con-centration inside the gas exchange volume, depending only on the flow and the volume.
CPLUS,t=Cinlet,t× QPLUS,t
VPLUS
+CPLUS, t−1×e
−QPLUS,t
VPLUS
, (2) withCPLUS,t being the calculated concentration in the gas exchange volume at timet, Cinlet,t the VOC concentration at the PLUS inlet at timet,QPLUS,tthe flow through the gas exchange volume,VPLUSthe volume of the gas exchange vol-ume, andCPLUS,t−1the previously calculated VOC concen-tration in the gas exchange volume. Similarly, the calculated concentration in SAPHIR was determined by concentration in PLUS and calculating depending on flow from PLUS into SAPHIR and on the volume of SAPHIR.
CSAPHIR,t=CPLUS,t×
QPLUS,t VSAPHIR
+CSAPHIR,t−1×e
−QSAPHIR,t
VSAPHIR
, (3)
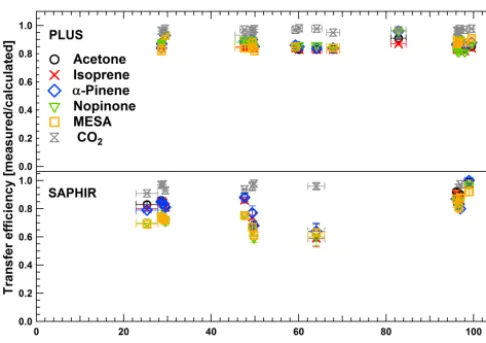
Figure 4. Measured/calculated averaged mixing ratios of VOC gas standard compounds. Upper panel shows the transfer efficiency be-tween the PLUS inlet and PLUS outlet. Lower panel shows the transfer efficiency between the PLUS outlet and the SAPHIR
cham-ber. Error bars shown are the standard deviation (NPLUS=18,
NSAPHIR=37).
these conditions. The transfer efficiencies from the PLUS in-let to the PLUS outin-let and from the PLUS outin-let to SAPHIR are comparable. However the transfer efficiencies from the PLUS outlet to SAPHIR are slightly lower at an average of 0.8, with the lowest value of 0.59 observed at 65% RH. Note that this lowest value was observed for the first stage of the experiment, when transfer lines between PLUS and SAPHIR were not conditioned for VOCs.
It is important to note that there is no significant difference in the transfer efficiencies for different VOCs, indicating that within the range of vapor pressure and polarity investigated here, VOC mixtures emitted from trees enclosed in the gas exchange unit, are transferred to SAPHIR without changes to the relative composition of the VOC mixture. Transfer is furthermore independent of relative humidity in the range of 25 to 100 % for both transfer between the PLUS inlet and outlet and transfer between PLUS and SAPHIR.
Coupling of PLUS to SAPHIR for transfer of BVOCs emitted from trees is achieved by either continuously trans-ferring air from PLUS to SAPHIR or by a short pulsed cou-pling (timescale of several minutes to hours). Figure 5 dis-plays the temporal evolution of monoterpenes emitted from six Quercus ilex trees. The upper panel shows monoterpene mixing ratios in PLUS together with light intensity (yellow area). The lower panel shows resulting monoterpene concen-trations in SAPHIR when a continuous flow of 30 m3h−1 was fed from PLUS to SAPHIR. Also shown is the cal-culated monoterpene concentration applying Eq. (3) to de-rive monoterpene concentration in SAPHIR. Note that here a transfer efficiency of 1 is implicitly assumed. Apart from the very beginning of the experiment, where calculated monoter-pene concentration exceeds observed ones, good agreement
Figure 5. Illustration of monoterpene transfer from PLUS to SAPHIR when continuously coupling the chambers with a flow of 30 m3h−1. Yellow shaded areas indicate time periods and intensity of light in the plant chamber; green shaded area indicates coupling of PLUS to SAPHIR.
is found. At these early times, chamber mixing times may play a role. The overall mixing time of SAPHIR for uniform mixing is 5 min, limiting the ability to observe fast changes in concentration of the inflow from PLUS.
3.5 Light- and temperature-dependent plant emissions
To evaluate BVOC emission characteristics inside PLUS, six potted Mediterranean holm oak (Quercus ilex) trees were installed in the plant chamber. Quercus ilex is a strong monoterpene emitter with emissions being light dependent (Kesselmeier and Staudt, 1999, and references therein). The main compounds emitted from the plants during our experi-ments wereα-pinene,β-pinene,Z-β-ocimene, and limonene as determined by GC-MS/FID (see Fig. 6) in agreement with observations from laboratory plant enclosure and field stud-ies (e.g., Blanch et al., 2007; Llusià and Peñuelas, 1999).
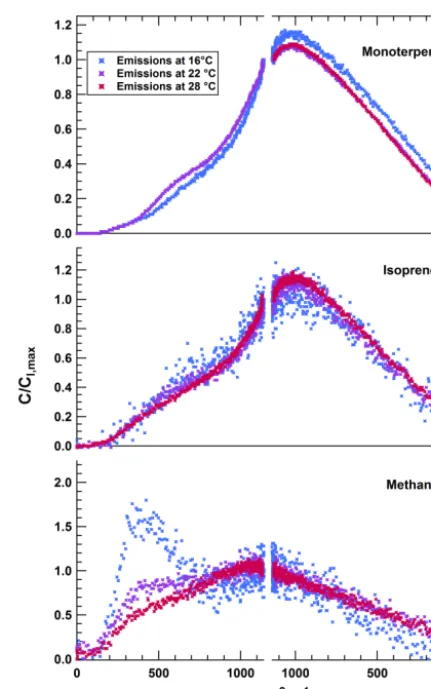
To determine the dependence of emissions on light and temperature, diel courses of light and temperature were pre-set with 12 h day/night periods (Fig. 7). To simulate field conditions the light intensity was gradually increased over a period of 6 h, followed by a 6 h gradual decrease. VOC emis-sions were analyzed as a function of temperature (13–31◦C) for periods of up to 3 consecutive days at one temperature.
Figure 6. BVOC composition of six Quercus ilex trees. BVOC pat-tern was measured with GC-MS/FID in SAPHIR during the ozonol-ysis experiment described in Sect. 3.6. The relative contribution of each compound concentration (ppbv) is shown.
light intensity in all temperature regimes. Methanol, how-ever, showed emission pulses after the onset of illumina-tion, as has been observed previously for different plant species both in field and laboratory experiments under con-trolled conditions (Folkers et al., 2008; Warneke et al., 2002; Nemecek-Marshall et al., 1995). Morning pulses of methanol emissions were explained as a consequence of accumula-tion in extracellular water of the plant’s apoplast when stom-ata are closed during nighttime (Niinemets and Reichstein, 2003). Methanol is continuously produced and high aqueous-phase concentrations built up in the aqueous-aqueous-phase during nighttime when stomata are closed. In the morning, stomata open and methanol is released until equilibrium is reached between the gas-phase of the substomatal cavity and the at-mosphere.13C-labeling experiments confirmed that the PAR dependence of methanol emissions is not directly linked (< 10 %) to photosynthetic de novo production, but rather originates from precursor compounds with long turnover times for carbon, such as cell wall components (Folkers et al., 2008). Methanol emissions are generally associated with plant growth (Hueve et al., 2007; Fall and Benson, 1996; Nemecek-Marshall et al., 1995; Obendorf et al., 1990). Methanol emissions have been shown to be temperature-dependent in general (Folkers et al., 2008). Note that due to the increase of methanol emissions with increasing tempera-ture (see also below), the relative importance of the morning emissions gradually vanished in PLUS with increasing tem-perature (Fig. 7).
The same set of experiments was used to study the tem-perature dependence of the Quercus ilex emissions. Fig-ure 8 shows the concentrations of isoprene, the sum of the monoterpenes, and methanol normalized to the concentra-tions at 30◦C vs. temperature in PLUS. The 4 h averaged data of peak emissions of isoprene and the monoterpene
fol-Figure 7. Light-dependent emissions of Quercus ilex under differ-ent air temperature conditions, withCI,max referring to observed concentrations at maximum light intensity (I) (upward branch).
lowed a well-described exponential increase with increasing temperature (e.g., Guenther et al., 1993). For monoterpenes the emissions increased with a slope (βin Eq. (5) in Guenther et al. (1993)) of 0.11±0.02 which is in good agreement with the literature (Staudt and Bertin, 1998). Methanol increased linearly with temperature, with a 10 % increase in peak emis-sions every∼4◦C between 13 and 31◦C. Note that for these experiments the plants were kept in the plant chamber undis-turbed for 109 consecutive days. During that time period the plants showed no signs of stress effects.
3.6 BVOC ozonolysis of real plant emissions
Figure 8. Temperature-dependent emission of Quercus ilex. 1 h av-eraged data of peak emissions during the photoperiod are used. Er-ror bars are calculated using erEr-ror progagation based on the standard deviation for the concentration at 30◦C and the measured temper-atures. Result of the fit shows that monoterpene emissions increase with a slope ofβ=0.11±0.02.
Table 4. Fractional oxidation of individual BVOCs by ozone (FO3)
and OH (FOH)together with maximum literature-reported acetone
yields during ozonolysis (YO3)and OH oxidation (YOH)taken to calculate maximum weighted average acetone yield (Atkinson and Arey, 2003).
BVOC %total FOH FO3 YO3 YOH
α-Pinene 24.5 0.38 0.62 0.08 0.15 β-Pinene 19 0.82 0.18 0.07 0.13
Myrcene 14 0.36 0.64 0.29 0.45
Z-β-Ocimene 25 0.34 0.66 0.24 0.2 E-β-Ocimene 6.5 0.34 0.66 0.24 0.2
Limonene 11 0.44 0.56 0.02 0.03
initial conditions inside the chamber prior to injection were 47 % relative humidity at a temperature of 17◦C. Ozonolysis of BVOCs is known to be a source of OVOCs and SOAs in the atmosphere. One OVOC of interest in this respect is ace-tone, as it is relatively long lived (global mean lifetime sev-eral weeks), and serves as a source of HOx and PAN in the upper troposphere (Jacob et al., 2002; Gierczak et al., 1998). As can be seen in Fig. 9 (lower panel) the ozonolysis of the monoterpene mixture leads to production of acetone with a maximum concentration gain of 0.68 ppb. Note that the back-ground concentration of acetone in SAPHIR prior to the in-jection of ozone could be considered constant and was on av-erage 0.22 ppbv. The acetone time series shown in Fig. 9 are corrected for the background concentration. Considering di-lution in SAPHIR, this observed acetone production is equiv-alent to an overall yield of 18.8 % from the mixed monoter-pene emissions form Quercus ilex. This yield can be eval-uated taking known acetone yields of individual monoter-penes and their relative contributions to Quercus ilex
emis-Figure 9. PLUS (upper panel) and SAPHIR (lower panel) observed concentrations of monoterpenes (red symbols) in an experiment per-forming a pulsed transfer of BVOC emissions. After ozone addi-tion to the SAPHIR chamber, formaaddi-tion of oxidaaddi-tion products is observed. Acetone, as one representative OVOC, is shown as mea-sured (black symbols) together with calculated acetone (blue line).
sions (Fig. 6) into account. As no OH scavenger was used in these experiments, the monoterpene are oxidized by OH and ozone. From the decay curve of the individual monoterpenes (determined by the GC-MS/FID), it can be estimated that be-tween 17 to 64 % of the monoterpenes were oxidized by OH, depending on the substance. Based on upper limits in the lit-erature (Atkinson and Arey, 2003) a weighted average molar yield of 17 % is expected from the mixture used in this ex-periment (see Table 4). This takes relative contributions from ozone and OH oxidation into account. Considering that some acetone could have been produced from compounds which were not measured, such as plant-emitted sesquiterpenes or intermediate oxidation products, the observed 18.8 % ace-tone yield is in good agreement with upper estimates from literature data. With overall concentrations in the range of at-mospheric conditions, this combined contribution of ozone and OH to monoterpene oxidation and product formation may still be considered representative of BVOC oxidation in low-NOx environments. This experiment thus exemplar-ily shows that, using direct emissions of plants as a BVOC source, a simulation of atmospheric chemistry can be used to derive representative product yields for use in bottom-up estimates of global sources.
4 Conclusion
impor-tance. The emissions from Quercus ilex as a function of both light and temperature observed in the gas exchange chamber are representative of emissions observed in ambient studies. Therefore PLUS can be considered a representative source of BVOC emission mixtures. VOC mixtures were shown to be quantitatively transferred to SAPHIR, ensuring the emis-sion pattern remains unchanged. In an ozonolysis experiment the total yield of acetone from oxidation of Quercus ilex emissions was determined. Future applications of SAPHIR-PLUS can therefore target a wide spectrum of atmospheric chemistry questions ranging from product yield determina-tion (OVOC and SOA), oxidadetermina-tion cycles, and oxidant (OH) recycling to the evaluation of total OH reactivity of both di-rect emissions and their oxidation products under a variety of oxidation regimes.
Acknowledgements. We gratefully acknowledge Theo Brauers
(IEK-8, Forschungszentrum Jülich), Knut Dahlhoff
(ZEA-1, Forschungszentrum Jülich), and Jürgen Wildt (IBG-2,
Forschungszentrum Jülich) for their valuable contributions to discussions on the design of PLUS. Alfred Budwig (ZEA1, Forschungszentrum Jülich) implemented the user control system (S7).
The article processing charges for this open-access publication were covered by a Research
Centre of the Helmholtz Association.
Edited by: D. Heard
References
Atkinson, R. and Arey, J.: Gas-phase tropospheric chemistry of bio-genic volatile organic compounds: a review, Atmos. Environ., 37, S197-S219, doi:10.1016/s1352-2310(03)00391-1, 2003. Blanch, J.-S., Peñuelas, J., and Llusià, J.: Sensitivity of terpene
emissions to drought and fertilization in terpene-storing Pinus halepensis and non-storing Quercus ilex, Physiol. Plantarum, 131, 211–225, doi:10.1111/j.1399-3054.2007.00944.x, 2007. Bohn, B., Rohrer, F., Brauers, T., and Wahner, A.: Actinometric
measurements of NO2photolysis frequencies in the atmosphere
simulation chamber SAPHIR, Atmos. Chem. Phys., 5, 493–503, doi:10.5194/acp-5-493-2005, 2005.
Di Carlo, P., Brune, W. H., Martinez, M., Harder, H., Lesher, R., Ren, X. R., Thornberry, T., Carroll, M. A., Young, V., Shepson, P. B., Riemer, D., Apel, E., and Campbell, C.: Missing OH reac-tivity in a forest: evidence for unknown reactive biogenic VOCs, Science, 304, 722–725, doi:10.1126/science.1094392, 2004. Edwards, P. M., Evans, M. J., Furneaux, K. L., Hopkins, J., Ingham,
T., Jones, C., Lee, J. D., Lewis, A. C., Moller, S. J., Stone, D., Whalley, L. K., and Heard, D. E.: OH reactivity in a South East Asian tropical rainforest during the Oxidant and Particle Pho-tochemical Processes (OP3) project, Atmos. Chem. Phys., 13, 9497–9514, doi:10.5194/acp-13-9497-2013, 2013.
Fall, R. and Benson, A. A.: Leaf methanol – the simplest natural product from plants, Trends Plant Sci., 1, 296–301, doi:10.1016/S1360-1385(96)88175-0, 1996.
Folkers, A., Hüve, K., Ammann, C., Dindorf, T., Kesselmeier, J., Kleist, E., Kuhn, U., Uerlings, R., and Wildt, J.: Methanol emis-sions from deciduous tree species: dependence on temperature and light intensity, Plant Biol., 10, 65–75, doi:10.1111/j.1438-8677.2007.00012.x, 2008.
Gierczak, T., Burkholder, J. B., Bauerle, S., and Ravis-hankara, A. R.: Photochemistry of acetone under tropospheric conditions, Chem. Phys., 231, 229–244, doi:10.1016/s0301-0104(98)00006-8, 1998.
Goldstein, A. H. and Galbally, I. E.: Known and unexplored organic constituents in the earth’s atmosphere, Environ. Sci. Technol., 41, 1514–1521, doi:10.1021/es072476p, 2007.
Guenther, A.: The contribution of reactive carbon emissions from vegetation to the carbon balance of terrestrial ecosystems, Chemosphere, 49, 837–844, doi:10.1016/s0045-6535(02)00384-3, 2002.
Guenther, A., Zimmerman, P., Harley, P., Monson, R., and Fall, R.: Isoprene and monoterpene emission rate variability: model eval-uations and sensitivity analyses, J. Geophys. Res., 98, 12609– 12617, 1993.
Hallquist, M., Wenger, J. C., Baltensperger, U., Rudich, Y., Simp-son, D., Claeys, M., Dommen, J., Donahue, N. M., George, C., Goldstein, A. H., Hamilton, J. F., Herrmann, H., Hoff-mann, T., Iinuma, Y., Jang, M., Jenkin, M. E., Jimenez, J. L., Kiendler-Scharr, A., Maenhaut, W., McFiggans, G., Mentel, Th. F., Monod, A., Prévôt, A. S. H., Seinfeld, J. H., Surratt, J. D., Szmigielski, R., and Wildt, J.: The formation, properties and im-pact of secondary organic aerosol: current and emerging issues, Atmos. Chem. Phys., 9, 5155–5236, doi:10.5194/acp-9-5155-2009, 2009.
Hao, L. Q., Yli-Pirilä, P., Tiitta, P., Romakkaniemi, S., Vaattovaara, P., Kajos, M. K., Rinne, J., Heijari, J., Kortelainen, A., Mietti-nen, P., Kroll, J. H., HolopaiMietti-nen, J. K., Smith, J. N., Joutsensaari, J., Kulmala, M., Worsnop, D. R., and Laaksonen, A.: New par-ticle formation from the oxidation of direct emissions of pine seedlings, Atmos. Chem. Phys., 9, 8121–8137, doi:10.5194/acp-9-8121-2009, 2009.
Hofzumahaus, A., Rohrer, F., Lu, K. D., Bohn, B., Brauers, T., Chang, C. C., Fuchs, H., Holland, F., Kita, K., Kondo, Y., Li, X., Lou, S. R., Shao, M., Zeng, L. M., Wahner, A., and Zhang, Y. H.: Amplified trace gas removal in the troposphere, Science, 324, 1702–1704, doi:10.1126/science.1164566, 2009.
Hueve, K., Christ, M. M., Kleist, E., Uerlings, R., Niinemets, U., Walter, A., and Wildt, J.: Simultaneous growth and emission measurements demonstrate an interactive control of methanol re-lease by leaf expansion and stomata, J. Exp. Bot., 58, 1783–1793, doi:10.1093/jxb/erm038, 2007.
Jacob, D. J., Field, B. D., Jin, E. M., Bey, I., Li, Q., Logan, J. A., Yantosca, R. M., and Singh, H. B.: Atmospheric budget of acetone, J. Geophys. Res.-Atmos., 107, ACH 5-1–ACH 5-17, doi:10.1029/2001jd000694, 2002.
Joutsensaari, J., Loivamäki, M., Vuorinen, T., Miettinen, P., Nerg, A.-M., Holopainen, J. K., and Laaksonen, A.: Nanoparticle for-mation by ozonolysis of inducible plant volatiles, Atmos. Chem. Phys., 5, 1489–1495, doi:10.5194/acp-5-1489-2005, 2005. Kaminski, M.: Untersuchung des photochemischen
Terpenoidab-baus in der Atmosphärensimulationskammer SAPHIR, PhD the-sis, Institut für Physikalische Chemie, Universität Köln, 2014. Karl, T., Guenther, A., Turnipseed, A., Patton, E. G., and Jardine,
K.: Chemical sensing of plant stress at the ecosystem scale, Bio-geosciences, 5, 1287–1294, doi:10.5194/bg-5-1287-2008, 2008.
Kesselmeier, J. and Staudt, M.: Biogenic volatile
or-ganic compounds (VOC): an overview on emission,
physiology and ecology, J. Atmos. Chem., 33, 23–88, doi:10.1023/a:1006127516791, 1999.
Kiendler-Scharr, A., Wildt, J., Dal Maso, M., Hohaus, T., Kleist, E., Mentel, T. F., Tillmann, R., Uerlings, R., Schurr, U., and Wah-ner, A.: New particle formation in forests inhibited by isoprene emissions, Nature, 461, 381–384, doi:10.1038/nature08292, 2009.
Kiendler-Scharr, A., Andres, S., Bachner, M., Behnke, K., Broch, S., Hofzumahaus, A., Holland, F., Kleist, E., Mentel, T. F., Rubach, F., Springer, M., Steitz, B., Tillmann, R., Wahner, A., Schnitzler, J.-P., and Wildt, J.: Isoprene in poplar emissions: ef-fects on new particle formation and OH concentrations, Atmos. Chem. Phys., 12, 1021–1030, doi:10.5194/acp-12-1021-2012, 2012.
Lelieveld, J., Butler, T. M., Crowley, J. N., Dillon, T. J., Fis-cher, H., Ganzeveld, L., Harder, H., Lawrence, M. G., Martinez, M., Taraborrelli, D., and Williams, J.: Atmospheric oxidation capacity sustained by a tropical forest, Nature, 452, 737–740, doi:10.1038/nature06870, 2008.
Leng, C., Kish, J. D., Kelley, J., Mach, M., Hiltner, J., Zhang, Y., and Liu, Y.: Temperature-dependent Henry’s law constants of at-mospheric organics of biogenic origin, J. Phys. Chem. A, 117, 10359–10367, doi:10.1021/jp403603z, 2013.
Llusià, J. and Peñuelas, J.: Pinus Halepensis and Quercus Ilex ter-pene emission as affected by temperature and humidity, Biol. Plantarum, 42, 317–320, doi:10.1023/a:1002185324152, 1999. Mentel, Th. F., Wildt, J., Kiendler-Scharr, A., Kleist, E., Tillmann,
R., Dal Maso, M., Fisseha, R., Hohaus, Th., Spahn, H., Uerlings, R., Wegener, R., Griffiths, P. T., Dinar, E., Rudich, Y., and Wah-ner, A.: Photochemical production of aerosols from real plant emissions, Atmos. Chem. Phys., 9, 4387–4406, doi:10.5194/acp-9-4387-2009, 2009.
Mentel, Th. F., Kleist, E., Andres, S., Dal Maso, M., Hohaus, T., Kiendler-Scharr, A., Rudich, Y., Springer, M., Tillmann, R., Uerlings, R., Wahner, A., and Wildt, J.: Secondary aerosol formation from stress-induced biogenic emissions and possi-ble climate feedbacks, Atmos. Chem. Phys., 13, 8755–8770, doi:10.5194/acp-13-8755-2013, 2013.
Nemecek-Marshall, M., MacDonald, R. C., Franzen, J. J., Woj-ciechowski, C. L., and Fall, R.: Methanol emission from leaves (enzymatic detection of gas-phase methanol and relation of methanol fluxes to stomatal conductance and leaf development), Plant Physiol., 108, 1359–1368, doi:10.1104/pp.108.4.1359, 1995.
Niinemets, Ü. and Reichstein, M.: Controls on the emission of plant volatiles through stomata: differential sensitivity of emission
rates to stomatal closure explained, J. Geophys. Res.-Atmos., 108, 4208, doi:10.1029/2002jd002620, 2003.
Nölscher, A. C., Williams, J., Sinha, V., Custer, T., Song, W., John-son, A. M., Axinte, R., Bozem, H., Fischer, H., Pouvesle, N., Phillips, G., Crowley, J. N., Rantala, P., Rinne, J., Kulmala, M., Gonzales, D., Valverde-Canossa, J., Vogel, A., Hoffmann, T., Ouwersloot, H. G., Vilà-Guerau de Arellano, J., and Lelieveld, J.: Summertime total OH reactivity measurements from boreal forest during HUMPPA-COPEC 2010, Atmos. Chem. Phys., 12, 8257–8270, doi:10.5194/acp-12-8257-2012, 2012.
Nozière, B., Longfellow, C. A., Henry, B. E., Voisin, D., and Hanson, D. R.: Uptake of nopinone by water: comparison between aqueous-and gas-phase oxidation of organic com-pounds in the atmosphere, Geophys. Res. Lett., 28, 1965–1968, doi:10.1029/2000gl012663, 2001.
Obendorf, R. L., Koch, J. L., Gorecki, R. J., Amable, R. A., and Aveni, M. T.: Methanol accumulation in maturing seeds, J. Exp. Bot., 41, 489–495, doi:10.1093/jxb/41.4.489, 1990.
Pinto, D. M., Tiiva, P., Miettinen, P., Joutsensaari, J., Kokkola, H., Nerg, A.-M., Laaksonen, A., and Holopainen, J. K.: The effects of increasing atmospheric ozone on blogenic monoterpene pro-files and the formation of secondary aerosols, Atmos. Environ., 41, 4877–4887, doi:10.1016/j.atmosenv.2007.02.006, 2007. Rohrer, F., Bohn, B., Brauers, T., Brüning, D., Johnen, F.-J.,
Wah-ner, A., and Kleffmann, J.: Characterisation of the photolytic HONO-source in the atmosphere simulation chamber SAPHIR, Atmos. Chem. Phys., 5, 2189–2201, doi:10.5194/acp-5-2189-2005, 2005.
Schlosser, E., Brauers, T., Dorn, H.-P., Fuchs, H., Häseler, R., Hofzumahaus, A., Holland, F., Wahner, A., Kanaya, Y., Kajii, Y., Miyamoto, K., Nishida, S., Watanabe, K., Yoshino, A., Ku-bistin, D., Martinez, M., Rudolf, M., Harder, H., Berresheim, H., Elste, T., Plass-Dülmer, C., Stange, G., and Schurath, U.: Techni-cal Note: Formal blind intercomparison of OH measurements: re-sults from the international campaign HOxComp, Atmos. Chem. Phys., 9, 7923–7948, doi:10.5194/acp-9-7923-2009, 2009. Seinfeld, J. H. and Pandis, S. N.: Atmospheric Chemistry and
Physics, John Wiley & Sons, Inc., USA, 1998.
Staudt, M. and Bertin, N.: Light and temperature dependence of the emission of cyclic and acyclic monoterpenes from holm oak (Quercus ilex L.) leaves, Plant Cell Environ., 21, 385–395, doi:10.1046/j.1365-3040.1998.00288.x, 1998.
Steiner, A. H. and Goldstein, A. H.: Biogenic VOCs, in: Volatile Or-ganic Compounds in the Atmosphere, edited by: Koppmann, R., Blackwell Publishing, Oxford, UK, 82–128, 2007.
Timkovsky, J., Gankema, P., Pierik, R., and Holzinger, R.: A plant chamber system with downstream reaction cham-ber to study the effects of pollution on biogenic emissions, Environmental Science-Processes & Impacts, 16, 2301–2312, doi:10.1039/c4em00214h, 2014.
VanReken, T. M., Greenberg, J. P., Harley, P. C., Guenther, A. B., and Smith, J. N.: Direct measurement of particle formation and growth from the oxidation of biogenic emissions, Atmos. Chem. Phys., 6, 4403–4413, doi:10.5194/acp-6-4403-2006, 2006. Warneke, C., Luxembourg, S. L., de Gouw, J. A., Rinne, H. J. I.,
Whalley, L. K., Edwards, P. M., Furneaux, K. L., Goddard, A., In-gham, T., Evans, M. J., Stone, D., Hopkins, J. R., Jones, C. E., Karunaharan, A., Lee, J. D., Lewis, A. C., Monks, P. S., Moller, S. J., and Heard, D. E.: Quantifying the magnitude of a missing hydroxyl radical source in a tropical rainforest, Atmos. Chem. Phys., 11, 7223–7233, doi:10.5194/acp-11-7223-2011, 2011.