Baghdad Science Journal
Vol.16(1)Supplement 2019
DOI:http://dx.doi.org/10.21123/bsj.2019.16.1(Suppl.).0209
Plasma Spectroscopy Diagnostics of V
2O
5at a Variable of Operating Power and
Pressure With
Radio Frequency Magnetron Sputtering.
Ibrahim K. salman
1*Mohammed K. Khalaf
2N.K. Hassan
3Hanaa Eesa Jasim
4Received 6/5/2018, Accepted 2/9/2018, Published 17/3/2019
This work is licensed under a Creative Commons Attribution 4.0 International License.
Abstract
In this paper, we investigate the basic characteristics of "magnetron sputtering plasma" using the target V2O5. The "magnetron sputtering plasma" is produced using "radio frequency (RF)" power supply and Argon
gas. The intensity of the light emission from atoms and radicals in the plasma measured by using "optical emission spectrophotometer", and the appeared peaks in all patterns match the standard lines from NIST database and employed are to estimate the plasma parameters, of computes electron temperature and the electrons density. The characteristics of V2O5 sputtering plasma at multiple discharge provisos are studied at
the "radio frequency" (RF) power ranging from 75 - 150 Watt and gas pressure (0.03, 0.05 and 0.007) torr. One can observe that the intensity of the emission lines increases with increasing the sputtering power. We find that the electron temperature excess drastically from 0.95 eV to 1.11eV when the emptying gas pressure excess from 0.03 to 0.05 Torr. On other hand excess electron temperature from 0.9 to 1.01 eV with increasing sputtering power from 100 to 125 Watt, while the electron density decrease from 5.9×10¹⁴ to 4.5×1014 cm-3 with increasing sputtering power. and electron density decrease with increasing of pressure from 4.25×10¹⁴ to 2.80×1014 cm-3, But the electron density maximum values 5.9×10¹⁴ at pressure 0.03 Torr.
Keywords: Electron Density, Electron Temperature, Magnetron Sputtering, Plasma Spectroscopy, V2O5
.
Introduction:
The use of plasma for "material deposition" is vastly used in industrial process and technology, "Magnetron sputtering" is the anymore lower-class for thin films deposition (1). Noble gases are generally used to generate the plasma because they are inactive. Commonly, plasmas are properties by exogenous parameters such as radio frequency input power, pedestal siding, gas and pressure, flow rate. Anyway, saving these exogenous parameters does not retrofit adequate knowledge of the sputtering practicality. Further, the film construct and accretions ratio, is provided by achieving the internal plasma parameters. Many diagnostic techniques are used to show properties plasma such as "Langmuir probe", optical emitting spectroscopy (OES) and "mass spectrometry" (2).
1
Ministry of Science and Technology, Department of provincial affairs, Baghdad, Iraq.
2Ministry of Science and Technology, Center of Applied
Physics, Baghdad, Iraq. 3
Department of Physics, College of Education, Tikrit University, Tikrit, Iraq
4Department of Physics, College of Scientific, Tikrit
University, Tikrit, Iraq *
Among these techniques, "Langmuir probe" is widely used to gauge plasma parameters like "electron density" (ne), "ion density" (ni), "electron
temperature" (Te), etc. in low-pressure glow
discharges. Also among the same techniques, there is "Optical emission spectroscopy" (3). This technique is based on the measurement of the light pattern transmitted by the plasma because it distinguishes the plasma properties. Radiation is the result of the interaction of the electron or ions with other plasma molecules. Four types of this plasma were proposed by MC Whiter, which depends on the electron interaction mechanism. Many of the methods to "electron temperature measurement" can be reached, these are (4, 5):
1) The density ratio read between the lines. 2) The ratio of line density to the connected string. 3) The intensity of the two parts of the connection. The first pattern is used in this study for the valuation of the suggesting "electron temperature" in the (Ar) DC glow discharge. The intensity of these spectral stripe depends on (KTe), and always
spectral stripe intensities and "Boltzmann plot" equation (6):
𝐾𝑇𝑒= [𝑙𝑛𝐼𝐼1𝜆1𝑔2𝐴2
2𝜆2𝑔1𝐴1]
−1
× (𝐸2− 𝐸1) …… (1)
The indices number 1 and 2 transmit to the first and second spectral stripe, I is the intensity, K is the "Boltzmann constant", g is the statistical weight, E is the excited case energy and A is the transition probabilistic. "The Boltzmann plot" manner is only proper if the evacuation plasma under study is in "complete local thermodynamic equilibrium" (LTE). In this spectrum, the argon sent outa stripe observed in the scope of 200-900 nm and kTe determine by selecting two Ar-I spectral stripes.
In a titration, the E, g and A for choices stripe is taken from the National Institute of Standards and Technology NIST "Atomic Spectra Datasheet" (6, 7). The ne can determine using the near intensities
of atomic and ionic spectral lines in "Boltzmann - Saha equation" (8).
𝑛𝑒= [(2𝜋𝑚𝑘𝑇𝑒)
3/2
ℎ3 ] [
2𝐴+𝑔+𝜆𝑜𝐼𝑜
𝐴𝑜𝑔𝑜𝜆+𝐼+] 𝑒
[−(𝐸+−𝐸𝑜+𝐸𝑖𝑜−Δ𝐸𝑖)
𝑘𝑇𝑒 ]
…… (2)
Where, (0, +) include the ionized atoms and neutral, E is the energy of the emissive echelons, Ei
o
is "the ionization energy" of the different atoms and ∆Ei is the lower of ionization energy (9). In this study, we focus to investigate the plasma parameter of "magnetron sputtering plasma" using V2O5 target
and its deposited V2O5 thin film.
Materials and Methods:
The main parts of the clogged plasma system are shown in Fig.1. Our work, V2O5 films were by the
RF magnetron system (CRC600 CO. Manufactured in the USA). Films are placed on the glass base with changing powers. Glass slides were cleaned sequentially in the ultrasound course with ethanol and acetone. Finally, rinse with distilled water and come out. The spray chamber leaves the base pressure 3 ×10⁻⁵ torr using the turbine and the mechanical pump mixture before deposition. Before deposition of V2O5 films, target V2O5 (99.99% pure
and diameter 5 cm) in a pure argon atmosphere for 15 minutes to remove the oxide on the target face. Deposition of V2O5 used "sputtering RF system" in
pure gas (99.9%) with pressure (3 × 10⁻², 5×10⁻² and
7×10⁻³ torr), with various strengths (75, 100, 125, and 150 watts), respectively.
Figure 1. Graphical diagram of the setup used in this study.
Results and Discussions:
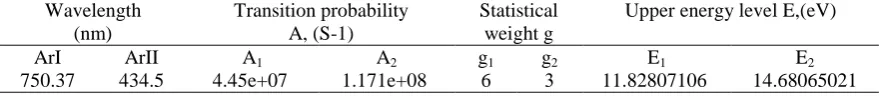
The emission spectra of argon plasma produced between electrodes at different RF power (75, 100, 125 and 150 Watt), are shown in Fig. 2. The intensity of two lines, one for Ar I at wavelength (750.37 nm) and the other for ArII at wavelength (434.5 nm) identical with NIST data, were chosen to estimate electron temperature by using lines intensity ratio method equation (1), NIST data, upper level energies, statistical weights (g) and transition probabilities(A), is listed in Table 1.
Figure 2. The emission spectra for plasma argon at different sputtering power.
Table 1. Values of transition probability, upper energy level and statistical weight that used to calculate Te (10).
Upper energy level E,(eV) Statistical
weight g Transition probability
A, (S-1) Wavelength
(nm)
E2 E1
g2 g1 A2
A1 ArII
ArI
14.68065021 11.82807106
3 6 1.171e+08 4.45e+07
As a appears in Table 1, the lower agitation energies for the argon lines are relatively high, >11.8 eV for Ar I.This refers to the emission of argon lines adoption on the presence of electrons in the plasma. An exception is that some Ar lines can also outrage efficiently from the Ar "metastable levels". Evidently, the energy required for excitation is less than that required for ionization because the electron of a stir atom does not remove completely from this atom. For example, the stirring energy of argon atoms is 11.8 eV while the ionization energy is 14.6 eV. Besides, the stirring energy should be greater than or equal to the energy of the electronic case in order for the excitation to occur (7, 11).
Figure 3. represents the variation of intensity for (750.37 nm) line and (434.5 nm) line respectively as a function of the RF Sputtering power at 3 × 10⁻² torr. It is clear that intensity of Ar I increases from (47.7 to 74.5) with the increasing rf power. This is mainly due to the strong impact of the electron density on the ionization process: higher power means higher electron density which results in more ionized atoms. On the other hand, there are a large number of single-ionized argon lines (Ar II) emitted from the argon spectrum for each discharge technique. The intensity of the Ar II lines reflects relative population among different energy levels of Argon ion, thus dependent on discharge Conditions: Gas pressure, discharge current and/or Input power rf. These results are in agreement with the results of (9, 12).
Figure 3. Variation of ArI (750.37 nm) and ArII (434.5nm) lines intensity with RF power at 3×10⁻² torr.
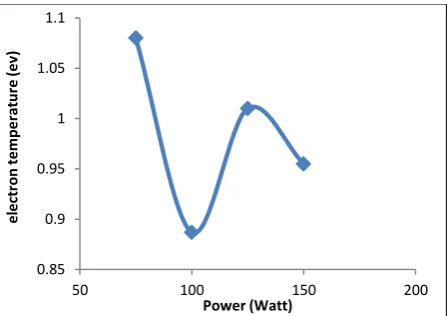
Figure 4. shows the temperature variation is lower from (1.08 to 0.88 eV) and high to 1.01 eV at 125 watt as a function of increasing energy. However, the decrease with the increase in energy that is expected to be the temperature of most electrons is more superior, which is observed to decrease with excess energy due to the transition α - γ The amplitude of the radio frequency with the wireless
usually two types of energy at the rate of discharge of radio frequencies capacitive; alpha and alpha modes. An indication of the α pattern in low voltage, in this pattern, the electrons in the plasma are initially questioned in order to stimulate excitation stimulation in the plasma. In increasing the great powers RF that meets in our experimental conditions, the. The mode is displayed. In this pattern, electrons are sent from electrode surfaces that play an important role in total ionization and excitation in the plasma. Therefore, with increased energy, strong secondary electrons will be sent from electrodes that improve ionization, which may increase in Te. The deviation in plasma temperature
causes a nonlinear change in the energy of the ions with increased power. In the figure below shows that the average ion energy reaches maximum RF power at about 75W (11, 13, 14).
Figure 4. Effect of RF power on the electron temperature (eV).
Figure 5. indicates the variation of electron density (ne) with RF power. This Figure shows that
the electron density excess from(3.03 to 5.98 cm-3) with increasing RF power. In turn, the increasing in RF power leads to excess the number of electrons emitted from the cathode, hence the increasing in the ionization processes leads to the excess density of electrons. In another way, the electron density lowered from (5.98 to 3.84 cm-3) with an excess of RF power. This behavior may be due to the losses of electrons with increasing of RF power (9). On the other hand the electron density excess, through the particle equilibrium been ions which generated by electron influence and ions missing on the source walls, it is maybe that the (Te) is independent of the
(ne). So higher proceeds in RF power to an increase
in electron density (15).
0 10 20 30 40 50 60 70 80
50 100 150 200
Inten
si
ty
(count)
Power (Watt)
ArI ArII
0.85 0.9 0.95 1 1.05 1.1
50 100 150 200
e
le
ct
ron
te
m
pe
rat
ur
e
(e
v)
Figure 5. Effect of RF power on the electron density (cm-3)*1014.
The emission spectra of the plasma argon produce between electrodes at pressure (0.03, 0.05 and 0.007) torr are in Fig. 6. The intensity of the lines excess the invader pressure excess, where the intensity of the lines, found to be relative to pα, where α is constant, which differs between 0.2 – 0.5, adopting on the wavelength (6). Considering Ar I line of wavelength 750.37 nm and ArII line with wavelength 434.5 nm by using NIST we get show the Table (1).
Figure 6. The emission spectra for plasma argon at different working pressures.
The change of the intensity of the special line as a function of working pressure is shown in Fig.7. The marked improvement in emission lines employed at 750.37 nm and 434.5 nm at ArI and ArII, individually. The observe that the intensified at the pressure 0.03 torr the intensity of (ArI) because of Ar emission intensity and energy of Ar ion. Then, the energetic Ar ions can increase the sputtering of from the target, which results in an increase the Ar sent out intensity. Energetic (Ar) ions can haunt an increasing in the secondary electrons sent out from the target, this effect which increase in the plasma intensity.
Figure 7. Effects of varying working pressure on Intensity.
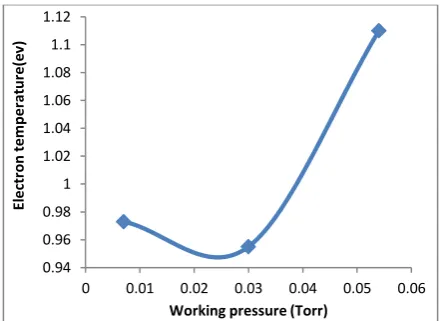
Figure 8. shows the electron temperature (Te) decreased with increase working pressure, from (0.007 to 0.03) torr, increasing pressure leads to a reduced average of the free path for electron collisions, so that electrons ionize to the atoms will be, then more frequently to give a higher plasma density, where electrons may easily lose their energy resulting in a reduced electron temperature, on other hand at pressure values increase the "Paschen minimum", stubborn collisions become more dominant resulting in a decreasing of plasma electron temperature. These results are in agreement with results of previous Study (16).
As it is observed that Te will increase linearly with
increase pressure by increased electron impact. The Te was a measure to a little decrease from 0.97 to
0.95 eV and increasing to 1.11 eV with different working pressure. higher Te with pressure is
probably because of less electron scattering and as a result, less energy will be lost. The significantly decreased "electron temperature" decrease the ionization efficiency significantly. These results are in agreement with the results of reference (17).
Figure 8. Effects of varying working pressure on Te (eV).
2 2.5 3 3.5 4 4.5 5 5.5 6 6.5
50 100 150 200
e
le
ct
ron
de
ns
it
y
(cm
-3
)
*1014
Power(Watt)
0 10 20 30 40 50 60 70 80
0 0.01 0.02 0.03 0.04 0.05 0.06
Inten
si
ty
(count)
Working Pressure (Torr)
ArI ArII
0.94 0.96 0.98 1 1.02 1.04 1.06 1.08 1.1 1.12
0 0.01 0.02 0.03 0.04 0.05 0.06
El
e
ct
ron
te
m
pe
rat
ur
e
(e
v)
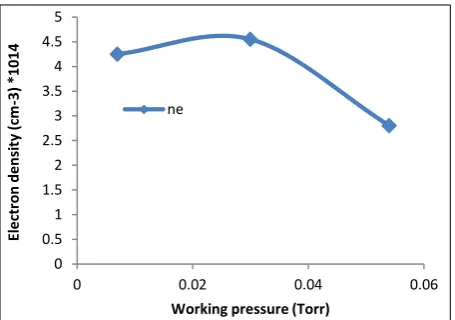
Figure 9. shows the variation in operating pressure, which causes a difference in the collision rate without a change in plasma density. This occurs because the external discharge power is insufficient. So that more pairs can be produced and higher intensity at high pressure. The increase comes after changes, with a 150W power value, the maximum energy value of 0.03 torr due to an increase in energy consumption at low-density values of 0.05 Torr. The maximum density (4.55 cm3) at (0.03 torr) is higher than the rest pressures.
Figure 9. Effects of varying working pressure on ne (cm
-3 ).
Conclusions:
In this study, the influence of working pressure and RF power on the plasma characterization is investigated for sputtering the V2O5 target. The
optical emission spectroscopy (OES) device is used as a diagnostics device to plasma parameter in RF discharge. The results show that the increasing of RF power and pressure will increasing of lines intensity. As well as, the results show variation electron temperature low and up gradually increase with increasing of pressure and RF power. as will electron density decreases and increase with increasing RF power and pressure.
Conflicts of Interest: None.
References
1. Vašina P. Plasma diagnostics focused on new
magnetron sputtering devices for thin film deposition. PhD [dissertation]. University in Brno, Department of Physical Electronics; 2005.
2. Koirala SP, Abu-Safe HH, Mensah SL, Naseem HA, Gordon MH. Langmuir probe and optical emission studies in a radio frequency (rf) magnetron plasma used for the deposition of hydrogenated amorphous silicon. Surf. Coating Technol. 2008;203(5-7):602-5.
3. Khalaf MK, Al-Taay HF, Ali DS. Effect of radio frequency magnetron sputtering power on structural
4. Granqvist CG, Green SV, Li SY, Mlyuka NR, Niklasson GA, Avendaño E. Chromogenics for
Sustainable Energy: Some Advances in
Thermochromics and Electrochromics. Some
Advances in Thermochromics and Electrochromics,” Adv. Sci. Technol. 2010;7(5): 55-64.
5. Ottaviano L, Pennisi A, Simone F, Salvi AM. RF sputtered electrochromic V2O5 films. Opt. Mater.
2004;27(2):307-13.
6. Garamoon AA, Samir A, Elakshar FF, Nosair A, Kotp EF. Spectroscopic study of argon DC glow discharge. IEEE Trans. plasma Sci.. 2007;35(1):1.
7. Khan FU, Rehman NU, Naseer S, Naveed MA, Qayyum A, Khattak NA, Zakaullah M. Reply to comment on “Diagnostics of 13.56 MHz RF sustained Ar–N2 plasma by optical emission
spectroscopy” by N. Sadeghi and FJ Gordillo-Vazquez. Eur. Phys. J. Appl. Phys. 2009;47(1).
8. Naz MY, Ghaffar A, Rehman NU, Shahid SA, Shukrullah S. Characterization of an In-house Built 50 Hz Single Dielectric Barrier Discharge System Having Asymmetric Electrodes. Int. J. Eng. Technol. 2012;12(05):53-60.
9. Hassouba M, Dawood N. A Comparative
Spectroscopic Study on Emission Characteristics of DC and RF Discharges Plasma using Different Gases.
Life Sci. J. 2014;11(9):656-66.
10. National Institute of Standards and Technology (NIST) atomic spectra database, (ver.5.1). Available at http://www.nist.gov/pml/data/asd.cfm, last updated: November 2, 2015.
11. Kechkar S, Swift P, Kelly S, Kumar S, Daniels S, Turner M. Investigation of the electron kinetics in O2
capacitively coupled plasma with the use of a Langmuir probe. Plasma Sources Sci. Technol. 2017; 26(6):065009.
12. Belkind A, Zhu W, Lopez J, Becker K. Time-resolved optical emission spectroscopy during pulsed dc magnetron sputter deposition of Ti and TiO2 thin
films. Plasma Sources Sci. Technol. 2006 Apr 24;15(2):S17.
13. Susana E, Felizardo E, Henriques J, Tatarova E , Dias F.M, Ferreira C.M. Experimental investigation of vacuum ultraviolet emissions in microwave argon plasmas: dependence on microwave power and discharge pressure. Inst. Plasmas Nucl. Fusion, Inst. Super. Técnico, Tech. Univ. Lisbon, 2015; 1049-001. 14. Wang D, Liu W, Wu Y, Hang L, Yu H, Jin N.
Characteristics of plasma source for the plasma polishing of super smooth optics. Phys. Procedia. 2011; 1(19):412-5.
15. Barbisan M, Zaniol B, Cavenago M, Pasqualotto R, Serianni G, Zanini M. Electron density and temperature in NIO1 RF source operated in oxygen and argon. In AIP Conference Proceedings 2017; 18 (69): 030031.
16. Azooz AA, Cakir S, Bleej DA. Plasma parameters in 40 MHz Argon discharge. Results Phys. 2015; 1(5):85-91.
17. Meng L. Plasma diagnostics and ITO film deposition by RF-assisted closed-field dual magnetron system.
0 0.5 1 1.5 2 2.5 3 3.5 4 4.5 5
0 0.02 0.04 0.06
El
e
ct
ron
de
ns
it
y
(cm
-3
)
*1014
Working pressure (Torr)
لا
صيخشت
لا
فيط
ي
ل
ذيذرتلا يف مويدانافلا ديسكوا سماخ ةدامل امزلابل
عم ةيويدارلا تاددرتلاب ينورتنكاملا
ريغت
طغضلاو ليغشتلا ةقاط
ناملس فلخ ميهاربإ
1
*
فلخ سامخ دمحم
2
نسح دلاخ ميدن
3
مساج ىسيع ءانه
4
1
.قارعلا ,دادغب ,تاظفاحملا نوؤش ةيريدم ,ايجولونكتلاو مولعلا ةرازو
2
.قارعلا ,دادغب ,ةيقيبطتلا ءايزيفلا زكرم ,داوملا ثوحب ةيريدم ,ايجولونكتلاو مولعلا ةرازو
3
قارعلا ,تيركت ,ءايزيفلا مسق ,ةفرصلا مولعلل ةيبرتلا ةيلك ,تيركت ةعماج .
4
ةيلك ,تيركت ةعماج ا
ءايزيفلا مسق ,مولعل قارعلا ,تيركت ,
.
: ةصلاخلا
فدهلا مادختساب ينورتنكاملا ذيذرتلا امزلابل ةيساسلأا صئاصخلا نم ققحتلا مت ,ثجبلا اذه يف V2O5مادختساب امزلابلا جاتنإ مت .
امزلابلا يف روذجلاو تارذلا نم يئوضلا ثاعبنلاا ةدش سايق مت .نوكرلاا زاغو ةيويدارلا تاددرتلاب ةقاط زهجمبب ينورتنكاملا ذيذرتلا يقم مادختساب (تانايب ةدعاق نم ةيرايعم طوطخ عم ةقباطتم طامنلأا عيمج يف ترهظ يتلا ممقلا تناكو ,يرصبلا يئوضلا فيطلا سا
NIST )
غيرفتلا فورظ يف امزلابلا صئاصخ ةسارد تمت .نورتكللإا ةرارح ةجرد و تانورتكللإا ةفاثك باسحل امزلابلا تاملعم ريدقتل مدختستو لا تاددرتلا ةقاط .ةفلتخملا نم حوارتت ةيويدار
75 ىلإ 150 (زاغلا طغضو طاو 0.03
, 0.05 و 0.007 طوطخ ةفاثك نأ اندجو .روت )
نم تداز نورتكللإا ةرارح ةجرد نأ و . ذيذرتلا ةقاط ةدايز عم دادزت تاثاعبنلاا )
0.95 ىلإ 1.11 زاغ طغض داز امدنع تلوف نورتكلا )
نم غيرفتلا 0.03
ىلإ 0.05 رخأ ةهج نم.روت نم نورتكللإا ةرارح ةجرد تداز ى
( 0.9 ىلإ 1.01 ذيذرتلا ةقاط ةدايز عم تلوف نورتكلا )
نم 100 ىلإ 125 نم نورتكللإا ةفاثك ضفخنت امنيب , طاو (5.4 – 4.5) x1014 cm-3
نورتكللإا ةفاثك اظيا .ذيذرتلا ةقاط ةدايز عم
نم ضفخنت x1014 cm-3
( 2.80 4.25 غضلا ةدايز عم ) تناك نورتكللإا ةفاثكل ةميق ىصقا نكلو , ط
3
cm -x1014 5.9 طغض دنع 0.03
. روت
لا تاملك لا : ةيحاتفم