Page 509
EVOLUTION OF FIELDS OF STUDIES AT LIFE SCIENCES UNIVERSITIES IN POLAND AS A CONSEQUENCE OF ECONOMIC TRANSFORMATION
(ON THE EXAMPLE OF WARSAW UNIVERSITY OF LIFE SCIENCES) Bogdan Klepacki, Marek Szyndel, Katarzyna Kowalska
Warsaw University of Life Sciences, ul. Nowoursynowska 166, 02-787 Warszawa, Poland
Abstract
In the early 90s of XX century Central and Eastern Europe gone through collapse of the socialist system (planned economy), the liberation of many countries from the domination of the Soviet Union and the socio-economic transformation. It affected every aspect of social and economic life, including science and higher education. This study recognizes the trends in education at the level of higher education in Poland in life sciences universities. The study presents statistics data regarding the life sciences universities in Poland, as well as a case study analysis of the situation of the Warsaw University of Life Sciences (WULS). Study recognized development of Polish higher education on the socio-economic transformation, especially in terms of the number of universities, students, faculties, etc.
Key words: natural universities, fields of study, education
1. CHANGES MADE AFTER THE TRANSFORMATION, THE CURRENT STATE AND PROSPECTS FOR POLISH HIGHER EDUCATION IN TERMS OF NUMBERS
The situation of higher education in Poland is decisively influenced by three major trends occurring since the 90s: massification of studies, the emergence of private universities, appearance of fees in public universities, as well as the extension of the autonomy of universities and increase of independence of academic society. Figure 1 shows changes in the number and structure of students in Poland.
Figure 1. Number of full-time and part-time students, Polish public and private universities in years 1989-2014
0 500 1000 1500 2000 2500
1989 1990 1991 1992 1993 1994 1995 1996 1997 1998 1999 2000 2001 2002 2003 2004 2005 2006 2007 2008 2009 2010 2011 2012 2013 2014
Th
o
u
san
d
s
Years
full-time programmes students on public Universities part-time programmes students on public Universities full-time programmes students on non-public Universities part-time programmes students on non-public Universities
Page 510
After the socio-economic transformation Poland has experienced rapid development of higher education, which was reflected in the creation of new institutions, private universities. While in the end of the 80s the number reached about 300 thousand of students, the majority of full-time students, the peak-period (2004 - 2010) reached two million. During this period was observed a rapid growth of the number of private universities (Figure 2).
Figure 2. Public and private universities [%]
Source: Central Statistical Office
Dynamics of changes in the number of students and universities in Poland after the transition to a market economy has reached a level not seen in the world. Mainly caused by:
1. In the '80s significant deficiencies in personnel compared to the economy and society needs, high demand for highly-educated cadres.
2. Appeared (rather rare in socialism) fairly strong correlation between the level of education of the employee and his salary.
3. Possession of a university diploma became a condition for career advancement.
4. Leading private universities has become a profitable business, even in small towns, which also was part of the prestige improvement.
5. Closeness of the Universities and relatively low tuition fees encouraged people to start their education.
6. Reducing the requirements level for candidates (generally there was no entrance exams to private universities), as well as for the students’ examination during their study (the greatest number of students the greatest university income from tuition fees).
Page 511
Figure 3. The number of births in Poland in the years 1980-2009 and the projected number of high school graduates 2028
Source: Central Statistical Office
In Poland, like in other countries of Central and Eastern Europe, since the middle 80s can be observed a decreasing number of births. This process, with varying intensity, took place for two decades, since 2004 there has been a break from this trend and the number of births increased slightly. The effects of "demographic disaster" will influence universities after 19 - 20 years, when recently born children finish secondary school and take college education. This time shift is indicated in the graph as a straight line (growing) and years listed on it are a year of maturity exam. With this statement it shows that the bottom of the crisis will appear in 2020 - 2025. In fact, due to the strong emigration, the number of candidates in those years may continue to decrease. This means that the number of students, and thus also the university, at least in the decade will drop.
2. WORLD TENDS IN THE CHANGING NUMBER OF STUDENTS
Page 512
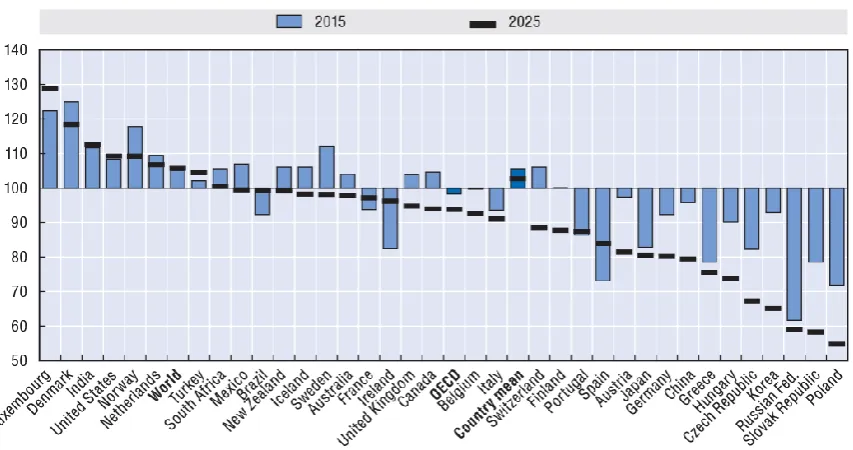
Figure 4. Population projections for the 18-24 age group in 2015 and 2025 (2005=100)
Source: United Nations, median projections (2006 revision)
Changes in the number of students in the analysed countries will be (according to forecasts) varied. Their increase can be expected in the richer countries (Denmark, the Netherlands, Norway, USA etc.), rapidly developing countries (Turkey, recently also Brazil) or with a large population in general, but even a small number of students (India). Opposite situation is expected in countries with weak pace of economic development (Portugal, Greece, Spain, Russia), as well as experiencing demographic problems (Hungary, Slovakia) or already having a lot of students (South Korea, Poland).
It should be pointed out that in the world a number of exchange students is increasing, or receiving education outside their home country. In 2006 there were 2.9 million of which three quarters were studying in only seven countries, primarily English-speaking. There is also increasing number of international exchange programs for students and academic staff.
3. CHANGES IN THE NUMBER OF STUDENTS IN LIFE SCIENCES AND
AGRICULTURAL UNIVERSITIES
Page 513
Figure 5. Change in the number of students in 2010 and 2013
Source: Own calculations based on data from selected universities
After a period of great growth in the number of students seen a regular decline can be observed, this trend applies to all universities. However, there are some differences, depending on the location of the university. The relatively smaller decline can be note in large urban areas or large cities. In the worst situation are universities located in smaller towns, and also located far away from strong academic centres.
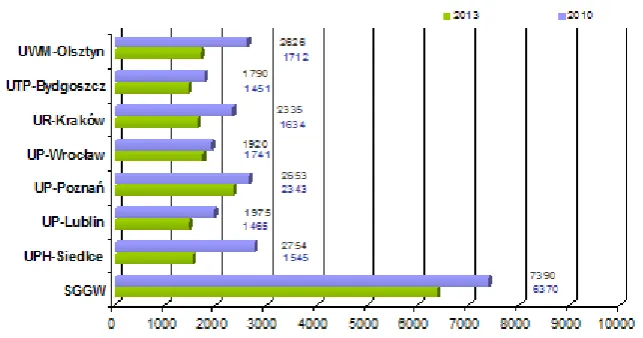
The number of full-time students is decreasing, but the pace of change in most universities is not too fast. Quite different is situation of part-time students, which is presented in Figure 6.
Fig. 6. Change in the number of students in 2010 and 2013
Page 514
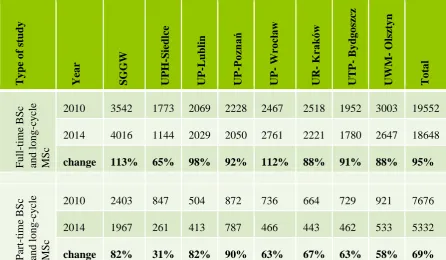
Reduced number of part-time students was more significant than in full-time studies. It was 20 - 30%, although in extreme cases, the numbers decreased to 55% of the initial period, almost by half. In subsequent years, should be expected a further decrease in the number of part-time students and the closing of study programmes. Global number of students somehow alleviate the problem. In Table 1 is presented the number of students enrolled to various universities.
Table 1. Revision of students enrolled for first year of study in 2010 and 2014 (full-time and part-time BSc and long-cycle MSc)
Ty
pe o
f stud
y
Year SGGW UPH
-Siedl ce UP -Lubl in UP -Po znań UP - Wrocła w UR - K rakó w UTP - Byd go szc z UWM - Ol szt yn Tota l Fu ll -time BSc and lo ng -cycle MS c
2010 3542 1773 2069 2228 2467 2518 1952 3003 19552
2014 4016 1144 2029 2050 2761 2221 1780 2647 18648
change 113% 65% 98% 92% 112% 88% 91% 88% 95%
Part -time BS c and lo ng -cycle MS c
2010 2403 847 504 872 736 664 729 921 7676
2014 1967 261 413 787 466 443 462 533 5332
change 82% 31% 82% 90% 63% 67% 63% 58% 69% Source: Own calculations based on data from selected universities.
Page 515
Figure 7. Change in the number of students majoring in "agriculture" in selected life sciences universities in the years 2010-2013
0 500 1000 1500 2000 2500 3000 3500 4000
2010 Full-time BSc 2013 Full-time BSc 2010 Full-time MSc 2013 Full-time MSc
SGGW UPH-Siedlce UP-Lublin UP-Poznań UP-Wrocław UR-Kraków UTP-Bydgoszcz UWM-Olsztyn
Source: Own calculations based on data from selected universities.
In just three years the number of students of the "agriculture" fell on average by 40%, and in some universities even several times (up to 3 times). Similarly, for the other aforementioned fields. So dramatic situation did not reveal, however, in each direction, as an example we present a "forestry" (Figure 8).
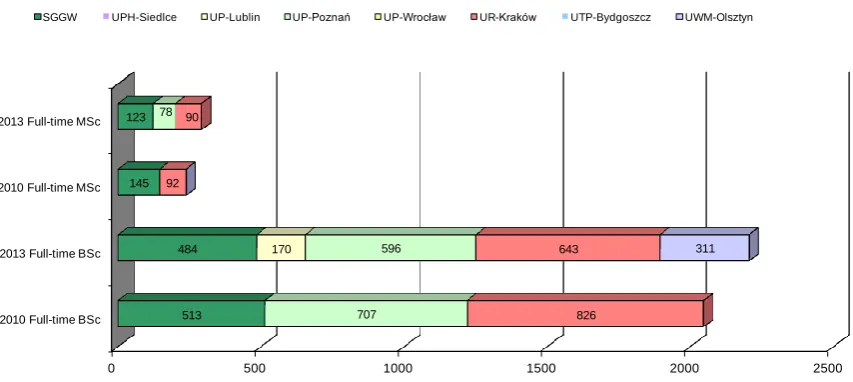
Figure 8. Change in the number of students majoring in "forestry" in selected universities in the years 2010-2013
0 500 1000 1500 2000 2500
2010 Full-time BSc 2013 Full-time BSc 2010 Full-time MSc 2013 Full-time MSc
513 484 145 123
170
707 596 78
826 643 92
90
311
SGGW UPH-Siedlce UP-Lublin UP-Poznań UP-Wrocław UR-Kraków UTP-Bydgoszcz UWM-Olsztyn
Source: Own calculations based on data from selected universities.
Page 516
4. ADAPTATIONS OF AGRICULTURAL UNIVERSITIES TO THE SOCIO-ECONOMIC TRENDS IN THE FIELD OF EDUCATION
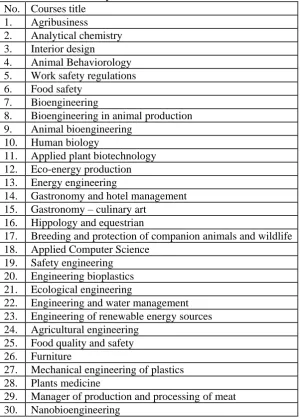
In response to the declining interest of candidates in study programs universities started to created new programs. An overview of such programs are presented in Table 2. Universities created very different programs of study, probably by the ideas and observations of authors, not necessarily as a result of labour market needs. Universities created programs already known (eg., "Human Nutrition", "agribusiness", "biotechnology", "veterinary medicine"), or closely related to the needs of the market ("gastronomy and hotel management ", "Furniture", “Renewable energy and waste management "), but also quite exotic, for example " Breeding and protection of companion animals and wildlife”," Plant medicine ","Animal Behaviorology "or" Herbs and plant therapies ". For postgraduate (MSc) created such fields as "Interior design", "Hippology and equestrian ", or "plant protection and phytosanitary inspection". It can be concluded that the last few years were characterized by a wealth of initiatives and ideas for creating new fields of study, search for market niches and at the same time catchy ideas aimed at attracting candidates. In the last five years eight life sciences universities created up to 39 new fields of study. They were both directions, which can be considered synthetic (eg. "Agribusiness", "energy", "agricultural engineering", "human nutrition"), as well as very specialized, specific, such as "Plant medicine", " zoo-therapy "or" zoos and domesticated animals. "
Table 2. The new courses of study introduced in selected schools and agricultural science in the academic years 2010/2011 - 2014/2015
No. Courses title 1. Agribusiness
2. Analytical chemistry 3. Interior design
4. Animal Behaviorology 5. Work safety regulations 6. Food safety
7. Bioengineering
8. Bioengineering in animal production 9. Animal bioengineering
10. Human biology
11. Applied plant biotechnology 12. Eco-energy production 13. Energy engineering
14. Gastronomy and hotel management 15. Gastronomy – culinary art
16. Hippology and equestrian
17. Breeding and protection of companion animals and wildlife 18. Applied Computer Science
19. Safety engineering 20. Engineering bioplastics 21. Ecological engineering
22. Engineering and water management 23. Engineering of renewable energy sources 24. Agricultural engineering
25. Food quality and safety 26. Furniture
27. Mechanical engineering of plastics 28. Plants medicine
Page 517
31. Plant protection and phytosanitary inspection 32. Renewable energy sources and waste management 33. Zoos and domesticated animals
34. Furniture designing
35. Management of the natural environment 36. Herbs and plant therapies
37. Zoo-therapy 38. Human Nutrition
39. Human Nutrition and Food assessment
Source: Own calculations based on data from selected universities.
5. CHANGES IN EDUCATION IN THE WARSAW UNIVERSITY OF LIFE SCIENCES IN
THE YEARS 2008 - 2016
Years 2008 - 2015 had showed a clear drop in the number of high school graduates, thus decreased the number of candidates for universities. This process was reflected in all the universities in the country, however in varying amounts. In general, the effects of decreasing the number of candidates affected universities from smaller towns, not public, or with a short history. Changes in the number of candidates of Warsaw University of Life Sciences are presented in Figure 9.
Figure 9. The number of candidates for the various levels and forms of education in 2008/2009 - 2015/2016
Source: Own research on the basis of: Report of the Rector of the University of Life Sciences of University activity for the years 2008 - 2015. Warsaw University of Life Sciences, Warsaw.
Page 518
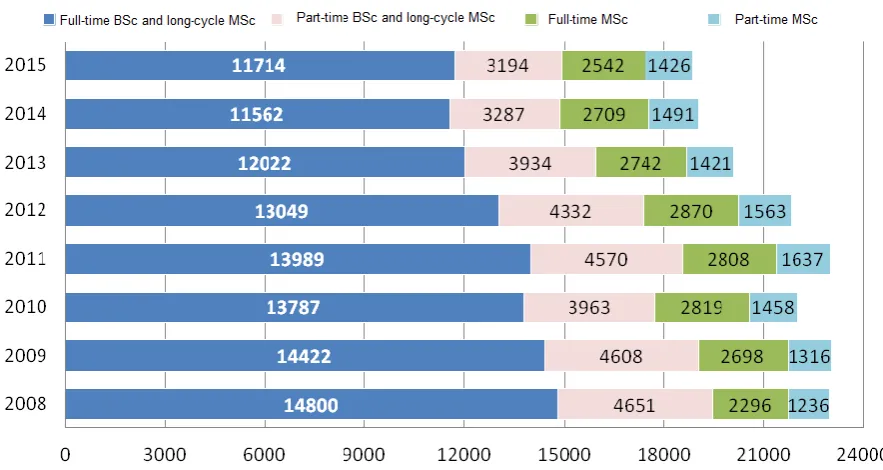
In the years 2008 - 2015 Warsaw University of Life Sciences enrolled about 9,000 students per year (Figure 10). The number of enrolled students in the extreme decreased only by 1.3%, of which there has been an increase in the number of full-time students in total by 8.9%, while the decrease in part-time by 16.4%.
Fig. 10. The number of enrolled at various levels and forms of education in the years 2008/2009 - 2015/2016
Source: Own research on the basis of: Report of the Rector of the University of Life Sciences of University activity for the years 2008 - 2015. Warsaw University of Life Sciences, Warsaw.
Page 519
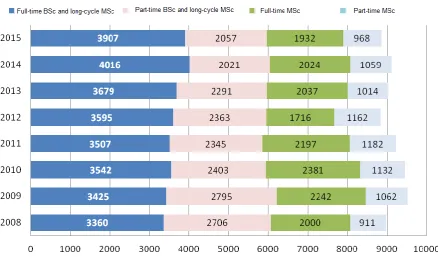
Figure 11. Number of students of Warsaw University of Life Sciences in academic years: 2008/2009 -2015/2016 by levels and forms of education
Source: Own research on the basis of: Report of the Rector of the University of Life Sciences of University activity for the years 2008 - 2015. Warsaw University of Life Sciences, Warsaw.
It can be generally stated that the Warsaw University of Life Sciences in recent years has maintained its attractiveness and the number of students. One of the reasons for this is varied and constantly updated educational offer (Figure 12).
Figure 12. The number of degree courses offered by Warsaw University of Life Sciences in academic years 2008/2009 - 2016/2017
0 20 40 60 80 100 120
27 27 28 28 32 34 35 37 37
24 24 25 25 26
27 29 29 30
22 22 26 26
28 28 28
29 29
17 17
22 22
24 24 24
23 24
Full-time BSc and long-cycle MSc Part-time BSc and long-cycle MSc
Full -time MSc Part -time MSc
Page 520
In 2008, the University offered 27 full-time fields of study, and eight years later already 10 more (appointed 11 new directions and one was closed). University also expanded the offer for the remaining study levels and forms of education. Established such programs as renewable energy technologies, food safety, animal and protection of companion animals and wildlife, engineering, environmental, furniture etc. extended the offer of studies previously performed on the BSc degree to Msc degree (eg. Logistics) or from full-time to part-time.
SUMMARY AND CONCLUSIONS
The transformation that has taken place in Poland and in other countries of Central and Eastern Europe at the turn of the 80s and 90s of the twentieth century, caused great social changes, as well as economic. They have hit all areas of life, including the functioning of higher education and its within the agricultural universities and science. Analysis of changes and adjustments allows to draw a number of conclusions.
1. Higher education after the socio-economic transformation was one of the most dynamically developing areas of life in Poland. The number of students in a few years has increased more than 4 times, a number of private universities has increased, the importance of paid studies also increased, including part-time. After several years the situation has changed radically, due to demographic changes (negative population growth in the country, the emigration of young people) decreases the number of high school graduates, which directly affects the number of university candidates.
2. Life Sciences Universities as one of the first began to feel the effects of demographic change. The number of candidates decreased, especially in the direction of "traditional", such as "agriculture", "animal husbandry", "horticulture" or "mechanization of agriculture." Most crisis felt universities located in smaller towns, and with a short distance from the big cities.
3. Problems with deficient candidates universities are trying to break through the creation of a new study offer, both already tested in other institutions, as well as in the form of innovative, often highly specialized programs. However, often the directions are too "sophisticated", brings only briefly sustained success, especially if aren’t based on the good achievements of researchers, and their creators are guided by current trends, even fashion.
4. Despite demographic problems universities can alleviate the difficulties in recruiting candidates (example of Warsaw University of Life Sciences). Key to the operation involve an increase in the quality and attractiveness of study (and diploma) and the extension of the scope of offered fields, not connected with agriculture and nature, but in professions whose representatives are needed on the labour market. The incentive for candidates are opportunities of foreign internship.
5. One of the possibilities to improve the competitive position of the university is the internationalization of studies, the introduction of English language courses, as well as the activation of recruiting abroad. In the case of Polish universities candidates may be coming from neighbouring countries, especially from Eastern Europe, from Belarus, Russia, Ukraine and Kazakhstan. In the case of elite studies, conducted at a global level (such as veterinary medicine at the WULS), efforts to gain candidate even from highly developed countries are possible to take.
Page 521 REFERENCES
Polish Central Statistical Office; Analytics regarding Higher Education in Poland,
Higher Education to 2030, Vol. 1: Demography, OECD, Paris 2008,
Tertiary Education for the Knowledge Society, Vol. 1, OECD, Paris 2008,
Higher Education to 2030, Vol. 2: Globalisation, OECD, Paris 2009
Education at a Glance 2009, OECD, Paris 2009

![Figure 2. Public and private universities [%]](https://thumb-us.123doks.com/thumbv2/123dok_us/100995.1510476/2.595.82.516.194.394/figure-public-and-private-universities.webp)