IMPROVING THE PASSENGER FEEDBACK PROCESS IN AIRLINE
INDUSTRY
Nikola Vojtek1, Bojan Smudja2 1,2 Holiday Pirates, Belgrade, Serbia
Received 22 April 2019; accepted 15 May 2019
Abstract: This paper analyses feedback process in airline industry, focus on currently available tools and use findings from both literature review and survey to propose recommendations for improvement. Airlines are using gathered information to align their commercial strategies and improve services and operations. Considering existing feedback mechanisms, the question arises how to improve the overall feedback process in order to obtain more relevant insights from the passengers. Research in this paper was conducted in two phases. In phase one, current feedback processes and tools were analyzed and findings are presented in a form of a literature review. In phase two, survey was commenced in the period Oct 2018 - Feb 2019 and a 200 responses were gathered. Literature review indicated that airlines need to have a reliable way of collecting and analyzing feedback, and that passengers are expecting transparent behavior of airline, personalized and high quality service. Main points of the survey results analysis indicated that frequency of travel is not associated with whether the passenger will leave feedback or not and that membership in loyalty programs is associated with whether the passenger will leave feedback or not.
Keywords: feedback processes, feedback tools, airline industry, flight experience, passenger rewards, flight service quality.
1 Corresponding author: n.vojtek@piratetech.rs
1. Introduction
The airline industry is characterized with the unpredictability (Hannigan et al., 2015) and changing environment (Mantecchini et al.,
2013), and a lot of evidence could be found showing how nowadays challenges in this industry are even more impacting airlines operations (Scotti and Volta, 2017). Due to the changes in the fuel prices (Lim and Hong, 2014), increases of operational (Zuidberg, 2014) and other costs, airlines are forced to align their pricing and commercial strategies (Bitzan and Peoples, 2016) and to improve their operations. This is significantly
impacting the flight service provided to the passengers, thus, their feedback about the flight experience is very important. There are numerous different feedback tools available for the airlines and passengers to use, from which two issues are detected and evaluated in this paper - how can airlines motivate passengers to share feedback and review? And how could other passengers have confidence in published and available feedbacks (from other passengers) that could be found on various portals?
data and passengers require a transparent and reliable way of providing and accessing feedback. Once feedback is collected, airlines could use it to improve the quality of the flight service and to retain more passengers (Aksoy et al., 2003). Due to the aggressiveness of the competition, as deeply examined in (Sengur and Ustaomer, 2019), the complexity of flight service is increasing and there are a lot of areas in which passenger could be disappointed. One good example, that had a huge impact on airline business thanks to the social networks, could be found in CNN article written by Zdanowicz and Grinberg (2018). The passenger denied to involuntary off-board the overbooked United Airlines flight and was forcibly removed. This disturbing scene also upset other passengers, and video of this was captured and shared via social media and had a lot of views really quickly. The final outcome was that the airline CEO apologized in public and offered compensation to the passenger. Other hardly measurable consequences were related to the global business and operations of the airline.
For passenger to give a review, it will definitely depend on the way how the overall feedback process is structured, but also it could depend on the motivation. Leaving feedback could also depend on the travel characteristics of passenger, such as frequency of flying, enrollment in loyalty program(s), budget and other flying decision factors. Thus, aim of this paper is to analyze feedback processes in airline industry and to evaluate currently available tools. Furthermore, second aim is to examine passengers travel characteristics and review habits. This is achieved through two phases analysis. Literature review of the feedback processes and tools was performed and following that, survey was conducted in the
period Oct 2018 - Feb 2019 from which 200 responses are gathered and analyzed. Based on both literature and survey responses analysis, recommendations for the feedback process improvement are formulated. This paper is structured as follows. In the section 2, literature review about feedback process and available feedback tools is provided. In section 3, analysis of the passengers’ travel characteristics and review habits is explained. In section 4, results of the analysis are presented, including survey results presentation, hypothesis review and statistical tests. In section 5 findings from literature review and survey are consolidated and discussed, and recommendations are proposed. Concluding findings are presented in the final section 6.
2. Literature Review
research was conducted by Ubogu (2013) but considering passenger preferences related towards airports. Although this was not focused on airline and in-flight service, the approach was the same, and it is worth mentioning that the analysis indicated three major variables considered by passengers when choosing airports - the location of the airport in the region, access time to airport and frequency of flight. Results obtained by Chow (2015) are showing the existence of the strong relationship between on-time performance and customer complaints. Another research (Rhoades and Waguespack Jr, 2008) is highlighting the importance of airlines to provide reliable and timely service, while government decisions and infrastructure needs should also be included as significant factors. This was from the airline perspective, and when it comes to the passengers, the way how they perceive quality is influencing on their loyalty to airlines. This behavior was noticed and captured even in earlier years in the study conducted by Ostrowski, O’Brien and Gordon (1993). In research paper, authors are emphasizing and pointing out on a significant relationship between carrier brand and customer loyalty. Furthermore, the importance of airline being in alliance, should not be neglected, when talking about airline benefits and variety of services offered to passengers. This was highlighted by the travelers participating in the survey that could be found in (Weber, 2005).
To make sure that the passenger feedback about the flight service is received, airlines established and are using different feedback processes, including gathering, analyzing and using data. For gathering feedback and reviews from passengers, various tools are used, which are described in the next paragraph of this section. For analyzing data, identification of service dimensions and their
in travel industry receive from social media engagement. It is evident that nowadays even one bad review could have a tremendous impact on airline business and operations. Presence of social networks and publicly available platforms made easy for passengers to leave review and to gather feedback from other passengers. Platforms as TripAdvisor are user centric and are focused on providing easiness of publishing review and accessing it. Most of them are providing free access to travelers, meaning not only to post the review, but also to read written experience from other passengers. Platforms are achieving revenue mostly by affiliate programs. Every passenger review is rewarded by increase in his or her tier level on the platform, which is a form of prestige on social networks. Second type of tool is following software as a service model and used by airlines to collect information. Good examples could be customer experience management services that many airlines are using. This service can collect stated and behavioral data from multiple channels including reservation system, applications, surveys and etc. Based on this, companies are gaining insight about what passengers preferences are even without passengers explicitly telling them. One of the main sources of information are loyalty programs. They provide benefits to companies in obtaining passenger preferences and are motivating passengers to provide as much relevant information like: preferred seat, class of travel, budget, frequency of travel, specific time periods and etc. Main rewards, as supported in the research conducted by Mimouni-Chaabane and Volle (2010), are monetary savings, exploration, entertainment, recognition, and social benefits. Among these, most popular are earned extra miles, which could be used for discounts on future travels or getting free ancillary service (extra baggage, priority boarding, lounge access and
etc.). In contrast to the previously mentioned social platforms, this is a paid service and fees that airlines are paying are calculated based on the number of passenger boarded.
3. Analysis
3.1. Aim and Hypothesis
First aim of this paper was covered by the previously conducted literature review. Second aim was to examine passengers travel characteristics and review habits. In terms of travel characteristics, the idea was to capture the frequency of travel, main decision drivers of passengers when choosing an airline and membership in loyalty program(s). Within review habits, it was considered if and how often passengers are leaving feedback and reading reviews from other passengers, what would be their expectations in terms of feedback process itself and benefits (rewards for leaving feedback). To evaluate and point out the directions for the improvements, survey was conducted. Survey comprised of different questions with the aim of testing 3 major hypothesis and their sub-hypothesis: H1. Leaving feedback about the f light experience depend on the frequency of travel. h1.1: People who fly more often are more likely to provide and read a review about the flight experience;
h1.2: People who fly more often use price and time of departure as main decision drivers when choosing an airline.
H2. Leaving feedback about the f light experience depend on the enrollment in loyalty program(s).
h2.2: Members of loyalty program(s) use ancillaries/services and number of connections as main decision drivers when choosing an airline.
H3. Feedback process (anonymous and unbiased service) motivates people to provide review about the flight experience. h3.1: People who are providing reviews expect some sort of reward;
h3.2: People who are providing and reading reviews think that unbiased service would be beneficial;
h3.3: People who fly more often think that unbiased service would be beneficial; h3.4: Members of loyalty program(s) expects mostly loyalty miles as rewards.
3.2. Methodology and Data Collection
Conducted survey comprised of 6 multiple answer questions concerning passengers
travel characteristics, behavior and review habits. Survey was shared through social networks and email clients. It was conducted in the period Oct 2018 - Feb 2019 from which 200 responses are gathered and analyzed using MS excel and SPSS software. The aim was to capture broader audience and gather responses from participants with different demographic characteristics. MS excel was used for the presentation of the preliminary survey results and SPSS for the further statistical tests.
4. Results
4.1. Survey Results Presentation
In this subsection, preliminary survey results are presented. Figures 1 and 2 are showing respectively the frequency of travel and main decision drivers of respondents for choosing an airline.
Fig. 1.
Fig. 2.
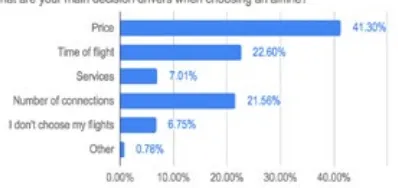
Main Decision Drivers for Choosing an Airline
According to the Figure 1, approximately half of the survey respondents (54%) travel by plane few times per year, and only 8.5% of them once or more times per month. As shown on the Figure 2, three main decision drivers for choosing an airline are price
(41.30%), time of flight (22.6%) and number of connections (21.56%). Next, Figures 3 and 4 are respectively showing reading and posting review habits of the respondents and their membership in any loyalty or frequent flyer programs.
Fig. 3.
Reading and Posting Review Habits
Fig. 4.
Figure 3 is showing that more than half of the respondents (57.5%) are not reading or posting reviews about flight experiences, and the rest of them have those habits rarely (30%) and often (12.5%). Majority of them are not members of any loyalty programs
(70%), and only 13% of the respondents have enrolled in multiple programs. Finally, Figure 5 and 6 are showing the respondents comments and expectations in regards to the unbiased and anonymous feedback process and rewards.
Fig. 5.
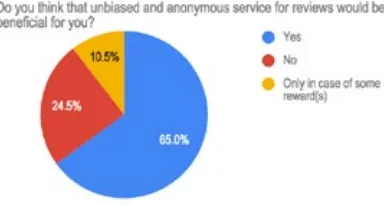
Unbiased and Anonymous Service for Reviews
Fig. 6.
Rewards Expectations for Providing Feedback
As shown on Figure 5, majority of the survey respondents (65%) agree that the unbiased and anonymous service for reviews will be beneficial for passengers and in addition to them, 10.5% of respondents are saying that review service will be beneficial only in case of some rewards. When it comes to the rewards expectations, answers presented on the Figure 6 are indicating loyalty miles (34%) and better tier for discounts on future purchases (31%) as mostly expected rewards.
4.2. Hypothesis Review
With sub-hypothesis 1.2 we are examining if there are differences in travel preferences of two groups of passengers, people who fly often (few times per year and once or
more times per month) and people who fly rarely (rarely and once per year). The results related to the first hypothesis are compiled and showed on Figures 7 and 8.
Fig. 7.
Leaving Feedback vs. Frequency of Travel (for Sub-Hypothesis 1.1)
Fig. 8.
Decision Drivers vs. Frequency of Travel (for Sub-Hypothesis 1.2)
First point in this hypothesis review, considers if people who f ly more often (few times per year or once or more times per month) are more likely to provide and read a review about the flight experience. As shown on the Figure 7, only the group of people who are flying once per year are providing and reading reviews significantly more than others (55% in total). Thus, we could say that not necessarily people who fly more often are more likely to provide and read reviews. When it comes to the
decision drivers, people who fly more often use price (103 times chosen by respondents who fly more often) and time of departure (61) as main decision drivers. In addition to this, it is worth mentioning that number of connections is also very important decision driver (54).
this with two sub-hypotheses: (h.2.1) Members of loyalty program(s) are more likely to provide a review about the flight experience; (h2.2) Members of loyalty program(s) use ancillaries/services and number of connections as main decision drivers when choosing an airline. With
sub-hypothesis 2.2 we are examining if there are differences in travel preferences of two groups of passengers, members of loyalty program(s) and passengers who are not members. The results related to the second hypothesis are compiled and showed on Figure 9 and 10.
Fig. 9.
Leaving Feedback vs. Enrolment in Loyalty Program(s) (for Sub-Hypothesis 2.1)
Fig. 10.
Decision Drivers vs. Enrolment in Loyalty Program(s) (for Sub-Hypothesis 2.2)
Second point in this subsection considers if members of loyalty program(s) are more likely to provide and read a review about the flight experience. As shown on the Figure 9, this statement could be true, since we have approximately 47% of the members of only one program and approximately 64% of the members of multiple programs saying that they leave and read feedbacks about flight experience. When it comes to the decision
drivers, as shown on the Figure 10, the price is still the most important factor for both members of loyalty program(s) and passengers who are not members.
four sub-hypotheses: (h3.1) People who are providing reviews expect some sort of reward; (h3.2) People who are providing and reading reviews think that unbiased service would be beneficial; (h3.3) People who fly more often think that unbiased
service would be beneficial; (h3.4) Members of loyalty program(s) expects mostly loyalty miles as rewards. The results related to the third hypothesis and sub-hypotheses are compiled and showed on Figure 11, 12, 13 and 14 respectively.
Fig. 11.
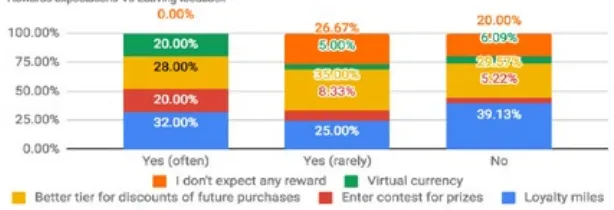
Rewards Expectation vs. Leaving Feedback (for Sub-Hypothesis 3.1)
Fig. 12.
Unbiased and Anonymous Service vs. Leaving Feedback (for Sub-Hypothesis 3.2)
Fig. 13.
Fig. 14.
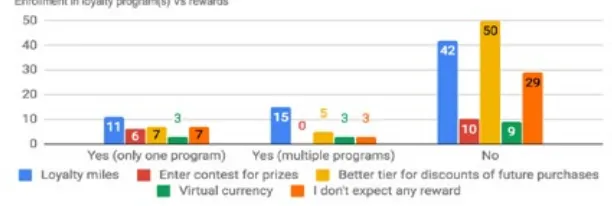
Enrolment in Loyalty Programs vs. Rewards (for Sub-Hypothesis 3.4)
Starting point for the third hypothesis is that people who are providing reviews expect some sort of reward. According to the Figure 11, people who often provide and read reviews are expecting some reward, and only 26.67% of people who rarely provide and read reviews are not expecting any kind of reward. As shown on the Figure 12, most of people who are providing reviews often (84%) and rarely (76.67%) think that unbiased and anonymous service for leaving feedback would be beneficial. When it comes to the frequency of travel, as shown on Figure 13, people who fly once or more times per month doesn’t think that unbiased and anonymous service will be beneficial. And at the end, presented on Figure 14, members of loyalty programs expect mostly loyalty miles as rewards (26 respondents who are members), but people who are not enrolled in any programs expect better tier for discounts in future purchases (50 respondents who are not members). It is worth mentioning, for this last question, that there could be a slightly overlapping. Meaning that loyalty miles could and are also used in some airline programs to offer passengers discounts for future purchases.
4.3. Statistical Tests
Looking at the responses solely from the previous sub-section, it could not be decided whether to accept or reject hypotheses. Research that captured similar topic in the same airline industry was commenced by Arif, Gupta and Williams (2013). Authors collected data from travelers regarding three different airports in UAE and used chi-square test to explore the dependencies and differences in the responses. Following that, for the purpose of this analysis, statistical chi-square tests were conducted to examine the dependencies between next variables: For first hypothesis (Leaving feedback about the flight experience depend on the frequency of travel):
H0: Leaving feedback about the f light experience is not associated with the frequency of travel;
H0: Enrollment in loyalty program(s) is not associated with leaving feedback;
H1: Enrollment in loyalty program(s) is associated with leaving feedback.
For third hypothesis (Feedback process (anonymous and unbiased service) motivates people to provide review about the flight experience) we conducted two tests: Comparing to the f lying frequency of passengers:
H0: Feedback process is not associated with flying frequency of passengers;
H1: Feedback process is associated with flying frequency of passengers.
Comparing to the enrollment in loyalty program(s):
H0: Feedback process is not associated with the enrollment in loyalty program(s); H1: Feedback process is associated with the enrollment in loyalty program(s).
Results of the chi-square tests are given in the following Tables 1, 2, 3 and 4 for the hypothesis respectively.
Table 1
Chi-square Tests Results for First, Second and Third Hypothesis
Hypothesis Pearson Chi-Square value df Asymp. Sig. (2-sided)
First hypothesis 7.281 6 0.296
Second hypothesis 6.901 2 0.032
Third hypothesis (flying frequency) 22.211 3 0.000
Third hypothesis (loyalty programs) 0.218 1 0.641
Chosen significance level for the conducted statistical tests is α = 0.05. For the first hypothesis, p value is greater than significance level (0.296 > 0.05), and we do not reject the null hypothesis. Conclusion for the first hypothesis is that there is not enough evidence to suggest an association between leaving feedback about the flight experience and frequency of travel. For the second hypothesis, p value is less than significance level (0.032 < 0.05), and we reject the null hypothesis. Conclusion for the second hypothesis is that statistical association was found between enrollment in loyalty program(s) and leaving feedback. For the third hypothesis, we had two tests. For the first test, considering flying frequency of passengers, p value is less than significance level (0 < 0.05). We are rejecting the null hypothesis and concluding that statistical association was found between feedback
process and flying frequency of passengers. For the second test, considering enrollment in loyalty program(s), p value is greater than significance level (0.641 > 0.05). We are not rejecting the null hypothesis, and concluding that there is not enough evidence to suggest an association between feedback process and enrollment in loyalty program(s).
5. Findings Consolidation and Discussion
are using various channels for collecting fight experience data from passengers and applying different frameworks to obtain insights about passengers’ preferences. Simple solutions for data analysis are not sufficient for airlines, and in order to gain quality and useful results, more complex frameworks are used, as it could be seen in (Hussain et. al, 2015). Literature analysis also indicated two channels for gathering feedback - publicly available platform and software as a service model used by airlines. First channel is open for passengers and second is closed system for airline internal use. Main benefits of utilizing feedback mechanism from both passenger and airline sides are monetary savings, exploration and recognition.
Survey was conducted with the aim to examine passengers travel characteristics and review habits, to evaluate and point out the directions for the improvements. The overall conclusion is that:
• Frequency of travel is not associated with whether the passenger will leave feedback or not, but it is associated with the feedback process that passengers are expecting. Passengers are expecting unbiased and anonymous feedback and review service;
• Membership in loyalty programs is associated with whether the passenger will leave feedback or not, but is not associated with the feedback process that passengers are expecting.
Based on the all f indings nex t t wo recommendations were formulated:
• Data gathering: It is very important that passengers have total confidence in
reviews, thus we would suggest using new approaches for designing unbiased, anonymous and permission based service (e.g. blockchain technology);
• Data processing: Complex framework for data processing is required. Our suggestion is to go with the combined approach, meaning to employ both statistical and computational intelligence techniques (e.g. with logical aggregation it will be possible to distinguish passengers based on both preferences they have and not have in common).
6. Conclusion
in some of the stages when designing the passenger feedback process. Airlines should apply new approaches for designing unbiased, anonymous and permission based service (e.g. blockchain technology) and should use both statistical and computational intelligence techniques for data processing framework. Directions for further analysis will be to invest more efforts in obtaining more responses, making sure that broader audience with captured demographic characteristics remains.
References
Aksoy, S.; Atilgan, E.; Akinci, S. 2003. Airline services marketing by domestic and foreign firms: differences from the customers’ viewpoint, Journal of Air Transport Management 9(6): 343-351. doi: https://doi.org/10.1016/
S0969-6997(03)00034-6.
An, M.; Noh, Y. 2009. Airline customer satisfaction and loyalty: impact of in-flight service quality, Service Business 3(3): 293–307. doi: https://doi.org/10.1007/
s11628-009-0068-4.
Arif, M.; Gupta, A.; Williams, A. 2013. Customer service in the aviation industry - An exploratory analysis of UAE airports, Journal of Air Transport Management 32: 1-7. doi: https://doi.org/10.1016/j.jairtraman.2013.05.001.
Baker, D. A. 2013. Service Quality and Customer Satisfaction in the Airline Industry: A Comparison between Legacy Airlines and Low-Cost Airlines, American Journal of Tourism Research 2(1): 67-77. doi:
https://doi.org/10.11634/216837861403317.
Basfirinci, C.; Mitra, A. 2015. A cross cultural investigation of airlines service quality through integration of Servqual and the Kano model, Journal of Air Transport Management 42: 239-248. doi: https://doi.
org/10.1016/j.jairtraman.2014.11.005.
Bitzan, J.; Peoples, J. 2016. A comparative analysis of cost change for low-cost, full-service, and other carriers in the US airline industry, Research in Transportation Economics 56: 25-41. doi: https://doi.org/10.1016/j.
retrec.2016.07.003.
Brochado, A.; Rita, P.; Oliveira, C.; Oliveira, F. 2019. Airline passengers’ perceptions of service quality: themes in online reviews, International Journal of Contemporary Hospitality Management 31(2): 855-873. doi: https://doi.org/10.1108/IJCHM-09-2017-0572.
Chou, C-C.; Liu, L-J.; Huang, S-F.; Yih, J-M.; Han, T-C. 2011. An evaluation of airline service quality using the fuzzy weighted SERVQUAL method, Applied Soft Computing 11(2): 2117-2128. doi: https://
doi.org/10.1016/j.asoc.2010.07.010.
Chow, C.K.W. 2015. On-time performance, passenger expectations and satisfaction in the Chinese airline industry, Journal of Air Transport Management 47: 39-47. doi: https://doi.org/10.1016/j.jairtraman.2015.04.003.
Hannigan, T.J.; Hamilton III, R.D; Mudambi, R. 2015. Competition and competitiveness in the US airline industry, Competitiveness Review 25(2): 134-155. doi:
https://doi.org/10.1108/CR-11-2014-0036.
Hudson, S.; Thal, K. 2013. The Impact of Social Media on the Consumer Decision Process: Implications for Tourism Marketing, Journal of Travel & Tourism Marketing 30(1-2): 156-160. doi: 10.1080/10548408.2013.751276.
Hussain, R.; Hasser, A. A.; Hussain, Y. K. 2015. Service quality and customer satisfaction of a UAE-based airline: An empirical investigation, Journal of Air Transport Management 42: 167-175. doi: https://doi.org/10.1016/j.
jairtraman.2014.10.001.
Mantecchini, L.; Gualandi, N.; Paganelli, F. 2013. Integration and Concentration Of European Air Transport Market, International Journal for Traffic and Transport Engineering 3(2): 204 – 219. doi: 10.7708/ ijtte.2013.3(2).08.
Mimouni-Chaabane, A.; Volle, P. 2010. Perceived benefits of loyalty programs: Scale development and implications for relational strategies, Journal of Business Research 63(1): 32-37. doi: https://doi.org/10.1016/j.
jbusres.2009.01.008.Ostrowski, P. L.; O’Brien, T. V.;
Gordon, G. L. 1993. Service Quality and Customer Loyalty in the Commercial Airline Industry, Journal of Travel Research 32(2): 16–24. doi: https://doi.
org/10.1177/004728759303200203.
Rhoades, D. L.; Waguespack Jr, B. 2008. Twenty years of service quality performance in the US airline industry, Managing Service Quality: An International Journal 18(1): 20-33. doi: https://doi.org/10.1108/09604520810842821.
Scotti, D.; Volta, N. 2017. Profitability change in the global airline industry, Transportation Research Part E: Logistics and Transportation Review 102: 1-12. doi: https://
doi.org/10.1016/j.tre.2017.03.009.
Sengur, F.; Ustaomer, T. C. 2019. Competitiveness Level of The Airline Industry: A Scale Development Study, International Journal for Traffic and Transport Engineering 9(1): 68 - 80. doi: 10.7708/ijtte.2019.9(1).06.
Tripadvisor. 2019. Airlines review section. Available from Internet: <https://www.tripadvisor.com/Airlines>.
Ubogu, A. E. 2013. Determinants Of Passengers’ Choice: A Case Study of Mallam Aminu Kano International Airport (Nigeria), International Journal for Traffic and Transport Engineering 3(3): 230 – 242. doi: 10.7708/ ijtte.2013.3(3).01.
Weber, K. 2005. Travelers’ Perceptions of Airline A lliance Benefits and Performance, Journal of Travel Research 43(3): 257–265. doi: https://doi. org/10.1177/0047287504272029.
Zdanowicz, C.; Grinberg, E. 2018. Passenger dragged off overbooked United flight. CNN, Travel section. Available from Internet: <https://edition.cnn.
com/2017/04/10/travel/passenger-removed-united-flight-trnd/index.html> (Accessed on 28 Feb 2019).
Zuidberg, J. 2014. Identifying airline cost economies: An econometric analysis of the factors affecting aircraft operating costs, Journal of Air Transport Management 40: 86-95. doi: https://doi.org/10.1016/j.