a
efirat@cu.edu.tr, akansu@nigde.edu.tr
Active control of flow around a square prism by slot jet injection
E. Fırat1, a
, Y.E. Akansu2 and M. Hacıalioğulları2
1Department of Mechanical Engineering, Çukurova University, TR 01330, Adana, Turkey 2Department of Mechanical Engineering, Niğde University, TR 51200, Niğde, Turkey
Abstract. The main aim of the experimental study is to determine both the most effective injection surface and rate in order to ensure minimum drag and fluctuating forces on a square prism subjected to crossflow. All predetermined jet injection surfaces i.e. front, side, and rear, tested separately for injection ratios of IR = 0, 1, 1.5, 2 at Reynolds number of Re = 16,000. Surface pressures were measured by differential pressure transducer whereas instantaneous velocity measurements were performed by using multichannel Constant Temperature Anemometer (CTA). It was concluded that jet injection, especially from the rear surface, brought noticeable improvements to the flow characteristics of a square prism. For rear jet configuration with IR = 1.5, the mean drag coefficient ( ) was reduced to 79.4% and level on side surfaces was reduced to 20% of that of the
single square prism. In addition, instantaneous flow visualization photographs and Strouhal number (St) distribution across the injection ratio were also presented to identify the flow patterns and underlying mechanism of drag and fluctuating force reduction of square prism with rear jet configuration.
1 Introduction
Square prism is the one of the most well-known shape in bluff body aerodynamics owing to the fixed separation points. Therefore many studies have been driven both by academic interest and by a broad range of practical circumferences involving flows such as around square prisms (flows around buildings, bridge decks, towers, vortex flowmeters, etc.). In this study, it was intended to improve some aerodynamic characteristics (mean drag and fluctuating pressure coefficients) simultaneously, by controlling the flow around the square prism via active means.
Flow control methods are indispensable tools in order to produce desired effects in flow field that concern to us and may be roughly separated into two categories as active and passive, based on energy expenditure [1]. In active flow control, an external energy input into the flow system is required (injection of micro bubbles or small solid particles, wall motion, surface heating or cooling, etc.). In contrary, passive flow control involves geometrical modifications in flow system without any auxiliary energy (control rod or plate, passive vortex generators, surface waviness, surface roughness etc.). Many active and passive flow control methods were employed for one main purpose such as only drag reduction [2-6] or only vortex-induced vibration (VIV) suppression [7, 8], etc. But less attention paid to both reducing mean drag and fluctuating forces
concurrently on bluff bodies. It must be remembered that the desired improvement in a specific parameter at a specific point may not yield a desired improvement even yield unwanted effects in another significant parameter.
In this respect, Zhou et al. [9] studied the effects of an upstream control plate on reduction of fluid forces acting on a square cylinder in two-dimensional channel with a blockage ratio of 12.5% at Reynolds number of 250. In the numerical study, lattice-Boltzmann discretization scheme was used in order to simulate fluid flow in channel with control plate and square cylinder for different values of control plate height and positions. It was expressed that, if control plate high enough, it is possible to obtain even negative drag on square cylinder. In addition to that, the presence of upstream control plate was well suppressed the amplitude of fluctuating lift on square cylinder. The maximum reductions in total drag coefficient and amplitude of fluctuating lift of square cylinder were obtained at plate height of h / D = 0.8 and plate position on
s / D = 2.5 as about 55% and 99%, respectively, when compared with singe square cylinder. Lam et al. [10] investigated the effects of surface waviness of wavy cylinders on mean drag and fluctuating lift reduction. In the experiments, Reynolds numbers based on nominal cylinder diameter and freestream velocity, varied from about 20,000 to 50,000, the freestream turbulence intensity was less than 0.2%, and maximum blockage was about 4%. Three different wavy test models were examined in
C
Owned by the authors, published by EDP Sciences, 2013
This is an Open Access article distributed under the terms of the Creative Commons Attribution License 2 0 , which . permits unrestricted use, distributi
experiments and from the results, it was expressed that the mean drag coefficients of the wavy cylinders are less than that of a corresponding circular cylinder; a drag reduction of up to 20% was obtained. Besides that, it was also showed that the root-mean-square (RMS) lift coefficient of wavy cylinder with a suitable spanwise waviness is capable of reducing the fluctuating lift. It was stated that, the variations of RMS lift coefficient across the tested Reynolds number range were reduced to levels of 0.05-0.2 from 0.4-0.6. Jukes and Choi [11] investigated into the dynamic changes in lift and drag when the modifications to the near-wake flowfield are carried out by means of pulsed surface plasma at Reynolds number of 15,000. Plasma actuators were located at the top and bottom of the cylinder close to natural separation points. It was expressed that as plasma actuators were activated in pulsed mode, it was possible to reduce the drag and RMS lift coefficients by up to 32% and 72%, respectively. The drag and RMS lift coefficients were only reduced by 23% and 44% when the plasma was fired continuously. On the other hand, drag was increased 7.5% and RMS lift coefficient was increased by 87% when the plasma was formed at a frequency close to the natural vortex shedding frequency.
As seen from the summarized papers, both effects of mean and fluctuating forces on bodies were examined to obtain optimum conditions for the various flow control methods. The paper was organised as follows. Section 2 explains the details of experimental apparatus and test model. Section 3 comprises of 2 steps. First step includes mean and fluctuating pressure measurement experiments for the determination of the most effective injection surface and rate for simultaneous drag reduction and VIV suppression. The latter step includes the further investigations about the underlying mechanism of the most effective jet configuration. Finally, concluding remarks are presented in Section 4.
2 Details of Experiments
2.1 Experimental apparatus
The block diagram of experimental setup was presented in figure 1. The experiments were conducted by a Eiffel type wind tunnel that has a closed test section of 405 mm 405 mm in cross-section and is about 1000 mm long. The test section was made of Plexiglas to apply optical measurement techniques (such as Particle Imaging Velocimetry) and to allow the flow visualizations. A Pitot-static tube connected to an electronic micromanometer (MonoAir 500 model), manufactured by Schiltknecht Messtechnik AG, was installed into the test section in order to monitor the freestream velocity. The micromanometer that has an accuracy of ± 0.5 Pa was also used to calibrate both the pressure transducer and hot-wire probes. The freestream speed range of wind tunnel is 3-30 m / s and can be arranged to desired value by means of a frequency controller. The freestream turbulence intensity measured along the vertical symmetry axis of the test section was about 0.8% and 0.4%, respectively, for the minimum and maximum speed of wind tunnel. The tunnel contraction
ratio i.e. the ratio between the largest and smallest cross-section areas in the contraction cone is 9 to 1. Moreover, the walls of test section were expanded with a divergence angle of 0.3˚ from inlet to outlet in order to ensure constant static pressure along the test section.
In experimental setup, an air compressor is used to supply the air into the 500 l tank. In here, the tank is necessary so as to provide permanent jet flow for relatively long time from the slot of test model. The air which compressed into an air tank flows throughout the pressure regulator/filter, mass flow controller, heat exchanger, and plenum chamber in the test model respectively. Then the air in plenum flows out of test model as a slot jet. The flow injection rate was adjusted by using an Aalborg GFC67 model mass flow controller with a range of 0–500 l / min and the heat exchanger was used to bring slot jet temperature to the freestream flow temperature.
For measurements of surface pressures on the square prism, totally 29 pressure taps of 0.8 mm in diameter were instrumented on its surfaces at mid-span. These pressure taps were distributed at unequal spacing on each surface. Eight pressure taps was instrumented on the surface with slot and seven for each of the other surfaces. The pressures were measured by using Omega 163PC01D75 model differential pressure transducer with a pressure range of 622 Pa. The transducer was connected to the pressure taps by a pressure scanivalve (employed to facilitate the pressure measurements) in reference to the freestream static pressure. The maximum response time of the pressure transducer was about 1 ms. Even though the connection of pressure transducer and pressure taps by piping reduced the overall dynamic response, frequency response of the transducer sufficed for the dynamic range of interest in the present study. The pressure data were recorded 16 s with a sampling rate of 500 Hz thus 8196 data were obtained for each pressure measurement.
Instantaneous velocity measurements at two different points in test section was conducted by using Dantec 54N81 model multichannel constant temperature anemometer with 55P16 and 55P11 models single wire Dantec probes. The 55P16 model probe was fixed at the position of 5 H upward and 6 H upstream from the centre of the prism (considered as origin) and used to obtain freestream velocity. The 55P11 model probe was located at the position of 5.5 H downstream and 2.5 H upward from the centre by using Dantec Dynamics 41T32 model two dimensional traverse mechanism and used to obtain Strouhal numbers by analysis of instantaneous velocity measurements. The 2D traverse mechanism provided fully computer controlled movement to the desired coordinate with a resolution of 6.25 µm. The velocity data were recorded 4 s with a sampling rate of 2 kHz thus 8196 data were obtained for each velocity measurement.
Wind
Tunnel
Fig. 1. Block diagram of experimental setup
Fig. 2. Schematic diagram of half part of test section. The test model in the test section has rear jet.
Fig. 3. Cross-section of test model with slot details on the right side for the front jet configuration Valve Air
Tank
Air Filters Regulators
Mass Flow Controller Valve
Heat Exchanger
Fan Hot-Wire
Probe II Test
Model Hot-Wire
Probe I Pitot-Static
Tube
Pressure Scanivalve Pressure
Transducer A/D Data
Acquisition Card
Connection Board A/D Data
Acquisition Software
Compressor
DC Power Supply Micromanometer
Multichannel CTA Traverse
Controller
2D Traverse System
Dantec Dynamics MiniCTA software in conjunction with National Instruments NI PCI-6220 16-bit data acquisition card was used to record the both velocity and pressure measurements. Statistical analysis of acquired data was also carried out by MiniCTA software.
2.2 Test model
A square prism with 38 mm 38 mm cross-section spanned along the width of the test section and centred on the mid-height of the test section was used in experiments. As seen from the figure 3, AB is the windward face normal to the flow, BC and DA are the side faces parallel to the flow, and CD is the rear face. The test model consists of brass main part and Plexiglas part with slot on it. Plexiglas part including slot (1 mm 298 mm, height width) that has 3 mm thickness was manufactured by VersaLaser VLS2.30 laser cutting machine. Brass part was manufactured by universal lathe and milling machines as sharp edges. There are totally 29 pressure taps are being on test model and they were made by small drilling machine. In order to obtain spanwise uniformity on velocity of injection jet, two overlapped chrome screens with a grid size of 120 meshes (number of openings per inch) were located inside of the slot (figure 3). The velocity of the injection flow was found to be uniform with a maximum deviation of ± 7% for the whole span of the injection slot. Two end plates are located at a distance of 50 mm from the side walls of test section to minimize three dimensional end effects.
The blockage and aspect ratios for the given configuration are 9.38% and 7.84, respectively. It is inevitable that the blockage ratio higher than 1% requiring appreciable correction to measured results [12] but no blockage corrections were made in the present study. On the other hand, it was expressed that a reasonable representation of two-dimensional flow can be achieved for models with an aspect ratio greater than about 6 between walls or end plates [12]. In present study, the value of aspect ratio is greater than that value.
3 Results and Discussion
3.1 Square prism with front jet
Some important information about test model and measurements will be given before starting the section. The corner codes i.e. A, B, C, D are same for all jet configurations. The effectiveness of IR = 0.5 on mean and fluctuating force reduction was not found remarkable therefore extracted from the calculations. Moreover, the anti-symmetric distribution of mean and fluctuating pressure coefficients in side surfaces of square prism with front jet were mainly attributed to the unstable interaction of incoming flow with jet (figure 4). This can be seen clearly from the numerical study of Kim [13]. Of course non-equal spacing of pressure taps and slot as a passive flow control mechanism on front surface also played a simple role on anti-symmetric distributions.
The total drag and lift coefficients were calculated by the following formulas:
In here, and represent the mean drag and lift
coefficients of the square prism based on momentum of jet,
θ represents the angle between the normal vector of related surface and negative drag direction in anti-clockwise direction, ds represents the integration length per pressure taps over the located surface, ρ represents the density of air, ṁ represents the mass flow rate of jet, represents the frontal projection area of the prism, represents the mean jet velocity, and represents the freestream velocity. The effects of friction drag and lift coefficients on total coefficients were neglected because of the weak contributions. In addition to that, for square prism the pressure drag ( ) may be divided in two contributions,
respectively, given by the front (FS) and rear (RS) surfaces of the body. Similarly, pressure lift ( ) may be divided in two contributions, respectively, given by the bottom (BS) and top (TS) surfaces of the body.
-2.5 -2.0 -1.5 -1.0 -0.5 0.0 0.5 1.0
A
D
C
B
A
C
PIR=0 IR=1 IR=1.5 IR=2
0.0 0.1 0.2 0.3 0.4 0.5
A
D
C
B
A
C
PRM
S
IR=0 IR=1 IR=1.5 IR=2
The root-mean-square (or standard deviation) value of the pressure coefficient computed from the following formula:
As one can seen from the figure 4, parabolic distribution on the front surface was started to distort as IR
was increased. This is due to the fact that, high pressure region on the centre of front surface (arising from stagnation point) was detached and moved upstream by aid of jet. Front jet also helped to increase the pressure level on rear surface with increasing IR. The recovered pressure coefficient ( ) was defined as the difference between the mean of measured values from a specific surface for the controlled and uncontrolled cases. For IR = 2, was reached to maximum value and was about 0.25 at rear surface (CD). It can be noted that, pressure recovery obtained at the rear surface will play an important role in reducing the drag. For the IR = 2 case, the change in from 2.45 (uncontrolled case) to 2.19 corresponds to 10.6% reduction in the pressure drag. But the momentum of jet created a propulsion in drag direction, thus increased the total drag coefficient ( ) from 2.19 to 2.41. In the
case of IR = 1, despite was reduced to 2.33, the jet
momentum increased the total drag to 2.38. The obtained value is still lesser than that of uncontrolled case but when the power consumption was taken into account, it is obvious that the front jet is not a reasonable method to reduce drag. On the other hand, the mean lift coefficient of this symmetric configuration was is not equal to the zero due to the reasons as explained before. From the figure 4, front jet can not affect the level on AB surface regardless of injection rate but BC, CD, and DA surfaces. The maximum reductions in levels on BC, CD, and DA surfaces were obtained at IR = 2 as 23.3%, 27.8%, and 15.9%, respectively.
3.2 Square prism with side jet
It is apparent from the figure 5 that, side jet is not having a remarkable influence on distribution on front surface. The mean pressure level was slightly increased up to IR = 1.5 on BC, CD, and DA surfaces. This is because of the filling ability of side jet in the vicinity of top surface without any interference to forming shear layers from the B corner. As injection ratio increased from IR = 1.5 to IR = 2, the levels at rear and bottom surfaces were dropped below that of uncontrolled case. But the level on top surface was kept increasing despite distribution line was splitted into two parts. The splitting is probably a consequence of the fact that the jet now has enough momentum to separate the flow region just over the top surface of square prism into two smaller regions and cancel the flow connection between them. Moreover, the pressure lift force changed the direction from positive to negative and was fallen down to = -0.114 from = 0.055 as
injection ratio reached to IR = 2. The was increased
approximately five times i.e. from -0.066 to -0.33, as IR
reached to 2. Besides that the was started to increase
from 2.26 (IR = 1.5) to 2.34 (IR = 2) at the same time. Those changes were associated with the existence of new flow structure that side jet started to influence the forming shear layers and possibly led to a thickened wake behind the square body. For IR = 1.5 and 2, the side jet has a small effect on depressing the fluctuating pressures on side surfaces but totally incapable of depressing the pressure fluctuations on the front and rear surfaces. Furthermore, increased flow rate from the jet was aggravated the amplitude of pressure fluctuations on front and rear surfaces.
-2.5 -2.0 -1.5 -1.0 -0.5 0.0 0.5 1.0
A
D
C
B
A
C
PIR=0 IR=1 IR=1.5 IR=2
0.0 0.1 0.2 0.3 0.4 0.5
A
D
C
B
A
C
PRM
S
IR=0 IR=1 IR=1.5 IR=2
Fig. 5. Mean and RMS values of fluctuating pressure coefficients over the square prim with side jet for different IRs
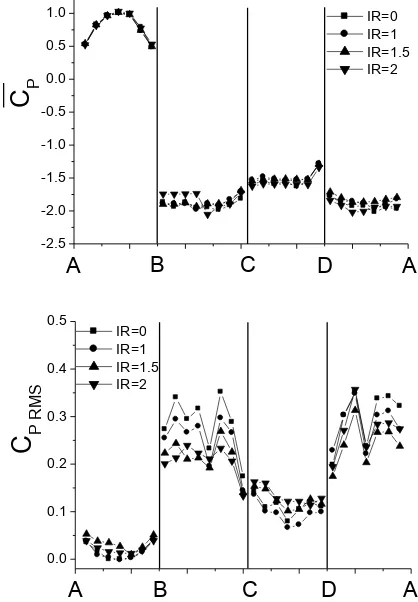
3.3 Square prism with rear jet
The advantages of rear jet over the others are that it may directly contact with the near wake region and propulsion effect of jet acts in negative drag direction, thus help to reduce mean drag coefficient. The parabolic shape of distribution on front surface was not distorted in just the same way as side jet configuration. Small increases in the levels of rear and side surfaces were observed at IR = 1 (figure 6). Just as the injection ratio reached to IR = 1.5, a sudden jump in the levels of BC, CD, and DA surfaces was detected. The pressure recovery obtained on rear surface and propulsion of jet were brought about a 20.6% reduction in . But further increase in IR was created a
reverse effect on drag i.e. the was raised from 1.89 (IR
-2.5 -2.0 -1.5 -1.0 -0.5 0.0 0.5 1.0
A
D
C
B
A
C
PIR=0 IR=1 IR=1.5 IR=2
0.0 0.1 0.2 0.3 0.4 0.5
A
D
C
B
A
C
PRM
S
IR=0 IR=1 IR=1.5 IR=2
Fig. 6. Mean and RMS values of fluctuating pressure coefficients over the square prim with rear jet for different IRs
The sudden jump is also observed on CP RMS distribution on
side surfaces. In the cases of IR = 0 and IR = 1, the noticeable side forces act on square prism owing to the alternately shedding vortices on each side of square prism. Similarly, as injection ratio reached to 1.5, significant decreases in the amplitude of fluctuating pressure coefficient was recorded. The reductions in level on side surfaces were obtained as about 80% at IR = 1.5 and 75% at IR = 2. The rapid changes in flow characteristics may be a consequence of changes in flow structure. In order to reveal this, flow visualization was carried out just before and after the IR = 1.5. It is quite clear from the figure 7 that the vortex formation length was enlarged at the IR = 1.7. The physics of this event can be explained as follows: As the injection ratio reached to IR = 1.5, jet issuing from the slot on rear surface penetrated the recirculation region just behind the prism and prevented the movement of shear layers to opposite side of the horizontal centerline of square prism such like a splitter plate [14-17]. On the other hand, figure 8 prove that the new flow mode still is not dominant on flow structure around square prism i.e. transition mode prevail on it. Double rows depicted in the figure means that the transition pattern reflected the properties of both flow pattern – A and the next pattern. The Strouhal number (St) distribution started to scatter after IR = 1.5. Besides that, the effects of next flow pattern on within the flow pattern - A was firstly sensed at IR = 1.5. Therefore, it was accepted in the IR range of transition flow pattern. For the St
measurements, two sequential velocity-time history data were obtained for each predetermined IR value and analyzed by fast Fourier transform (FFT). In figure 8, first peak represents the St obtained from the highest peak in the
frequency spectrum. Others i.e. second and third peak represents the relatively higher peaks that close to the first one in height.
IR = 1.1
IR = 1.7
Fig. 7. Flow visualization in the near wake region of square prism with rear jet before and after the injection ratio of IR =
1.5
0.0 0.5 1.0 1.5 2.0 0.04
0.06 0.08 0.10 0.12 0.14 0.16 0.18 0.20 0.22 0.24 0.26 0.28
St
IR
1st peak 2nd peak 3rd peak
Fig. 8. Variation of St measured at x / D = 5.5 and y / D = 2.5 with respect to injection ratio and flow pattern identification for
the rear jet configuration
4 Concluding remarks
The effects of jet injection from a single slot opened on the surface of square prism into crossflow were investigated experimentally at Re = 16,000, with a focus on the concurrent reduction of drag and VIV. Three different jet injection surfaces i.e. front, side, and rear were tested so as to determine the most effective one. The
Flow Pattern - A
lower values of injection ratio i.e. IR = 0, 1, 1.5, and 2 were emphasized in order to manipulate the flow field with lesser power consumption.
It is clear that front jet reduced the high pressure level on the front surface and increased the pressure level on rear surface as IR increased, thus greatly decreased the pressure drag ( ). Increasing IR also reduced the level on side surfaces when compared to single
square prism. But, due to the disadvantage of jet propulsion direction, the was brought forth an increase in total drag coefficient ( ) with increasing IR. In other
words, prevented a remarkable decrease in total drag
coefficient ( ).
It was decided that side jet is not a plausible method for drag reduction because maximum reduction in
was recorded as 2.6% (IR = 1). Similarly, fluctuating pressure coefficients can not be depressed efficiently. The maximum reduction in level on side surfaces i.e.
16.5% was obtained at IR = 2.
General talking, neither front nor side jets provided satisfactory performance in terms of concurrent reduction of drag and fluctuating side forces. However, in contrast to front and side jet, the unwanted effects of flow on bodies reduced successfully. In the rear jet configuration, the mean drag coefficient ( ) was reduced to 79.4% and level on side surfaces was reduced to 20% of that of
the single square prism at IR = 1.5.
Acknowledgement
The authors would like to acknowledge the financial supports of the Scientific and Technological Research Council of Turkey under the contract number of 105M241.
References
1. M. Gad-el-Hak, Flow control: Passive, active, and reactive flow management, Cambridge University Press, New York, 2000
2. A. Prasad, C.H.K. Williamson, J. Wind Eng. Ind. Aerod. 69-71, 155-167 (1997)
3. T. Igarashi, N. Terachi, J. Wind Eng. Ind. Aero. 90,
359-376 (2002)
4. K.T. Hyun, C.H. Chun, Exp. Fluids, 35, 541-552 (2003)
5. D. Geropp, H.-J. Odenthal, Exp. Fluids, 28, 74-85 (2000)
6. [6] J.-Y. Hwang, K.-S. Yang, J. Wind Eng. Ind. Aero.
95, 551-564 (2007)
7. H. Baek, G.E. Karniadakis, J. Fluid Struct. 25, 848-866 (2009)
8. T. Zhou, S.F. Mohd. Razali, Z. Hao, L. Cheng, J. Fluid Struct. 27, 903-917 (2011)
9. L. Zhou, M. Cheng, K.C. Hung, J. Fluid Struct. 21, 151-167 (2005)
10. K. Lam, F.H. Wang, J.Y. Li, R.M.C. So, J. Fluid Struct. 19, 321-334 (2004)
11. T.N. Jukes, K.-S. Choi, Phys. Fluids, 21, 084103 (2009)
12. Engineering Sciences Data Unit (ESDU), London, Item No. 80024, 1980
13. D.-H. Kim, K.-S. Yang, J.-S. Eom, JSME Int. J. Ser. B, 46, 316-325 (2003)
14. S. Ozono, Phys. Fluids, 11, 2928-2934 (1999)
15. H. Hangan, J. Kim, J. Wind Eng. Ind. Aerod. 91, 1847-1857 (2003)
16. Y.E. Akansu, E. Fırat, Exp. Therm. Fluid Sci. 34, 906-914 (2010)