University of Pennsylvania University of Pennsylvania
ScholarlyCommons
ScholarlyCommons
Publicly Accessible Penn Dissertations
2019
Linking Functional Brain Networks To Psychopathology And
Linking Functional Brain Networks To Psychopathology And
Beyond
Beyond
Huchuan Xia
University of Pennsylvania, cedrichxia@gmail.com
Follow this and additional works at: https://repository.upenn.edu/edissertations
Part of the Behavioral Neurobiology Commons, and the Biostatistics Commons
Recommended Citation Recommended Citation
Xia, Huchuan, "Linking Functional Brain Networks To Psychopathology And Beyond" (2019). Publicly Accessible Penn Dissertations. 3540.
Linking Functional Brain Networks To Psychopathology And Beyond Linking Functional Brain Networks To Psychopathology And Beyond
Abstract Abstract
Neurobiological abnormalities associated with neuropsychiatric disorders do not map well to existing diagnostic categories. High co-morbidity suggests dimensional circuit-level abnormalities that cross diagnoses. As neuropsychiatric disorders are increasingly reconceptualized as disorders of brain development, deviations from normative brain network reconfiguration during development are
hypothesized to underlie many illness that arise in young adulthood. In this dissertation, we first applied recent advances in machine learning to a large imaging dataset of youth (n=999) to delineate brain-guided dimensions of psychopathology across clinical diagnostic boundaries. Specifically, using sparse Canonical Correlation Analysis, an unsupervised learning method that seeks to capture sources of variation common to two high-dimensional datasets, we discovered four linked dimensions of psychopathology and connectivity in functional brain networks, namely, mood, psychosis, fear, and externalizing behavior. While each dimension exhibited an unique pattern of functional brain connectivity, loss of network segregation between the default mode and executive networks emerged as a shared connectopathy common across four dimensions of psychopathology.
Building upon this work, in the second part of the dissertation, we designed, implemented, and deployed a new penalized statistical learning approach, Multi-Scale Network Regression (MSNR), to study brain network connectivity and a wide variety of phenotypes, beyond psychopathology. MSNR explicitly respects both edge- and community-level information by assuming a low rank and sparse structure, both encouraging less complex and more interpretably modeling. Capitalizing on a large neuroimaging cohort (n=1,051), we demonstrated that MSNR recapitulated interpretably and statistically significant
associations between functional connectivity patterns with brain development, sex differences, and motion-related artifacts. Compared to common single-scale approaches, MSNR achieved a balance between prediction performance and model complexity, with improved interpretability.
Together, integrating recent advances in multiple disciplines across machine learning, network science, developmental neuroscience, and psychiatry, this body of work fits into the broader context of
computational psychiatry, where there is intense interest in the quest of delineating brain network patterns associated with psychopathology, among a diverse range of phenotypes.
Degree Type Degree Type Dissertation Degree Name Degree Name
Doctor of Philosophy (PhD) Graduate Group
Graduate Group Neuroscience First Advisor First Advisor
Theodore D. Satterthwaite Second Advisor
Second Advisor Danielle S. Bassett Keywords
Subject Categories Subject Categories
LINKING FUNCTIONAL BRAIN NETWORKS TO PSYCHOPATHOLOGY AND BEYOND
Huchuan Xia
A DISSERTATION
in
Neuroscience
Presented to the Faculties of the University of Pennsylvania
in
Partial Fulfillment of the Requirements for the
Degree of Doctor of Philosophy
2019
Supervisor of Dissertation Co-Supervisor of Dissertation
______________________________ ____________________
Theodore D. Satterthwaite, M.D., M.A. Danielle S. Bassett, Ph.D.
Assistant Professor of Psychiatry Associate Professor of Bioengineering,
Electrical & Systems Engineering, Psychiatry, Physics and Astronomy, and Neurology
Graduate Group Chairperson
__________________
Joshua I. Gold, Ph.D.
Professor of Neuroscience
Dissertation Committee
Geoffrey K. Aguirre, M.D., Ph.D., Professor of Neurology
Frances E. Jensen, M.D., Professor of Neurology
LINKING FUNCTIONAL BRAIN NETWORKS TO PSYCHOPATHOLOGY AND BEYOND
COPYRIGHT
2019
HUCHUAN XIA
This work is licensed under the Creative Commons Attribution- NonCommercial-ShareAlike 3.0 License
To view a copy of this license, visit
This dissertation is dedicated to
my parents, who courageously green-lighted and selflessly supported my idea of coming to America for higher education;
my three living grandparents, who always silently cheered me on, even when I didn’t call them as much as I should have;
and the loving memory of my grandmother and my aunt, who passed away during my graduate studies. Both teachers at an elementary school in rural
ACKNOWLEDGMENT
I am incredibly grateful to my adviser, Ted Satterthwaite, who is among
the most outstanding scientists, effective teachers, and compassionate mentors I
have ever worked with. As an aspiring physician-scientist who is working towards
a career in translational psychiatry, I see Ted as my most influential role model. I
owe much debt for the progress in my research and achievement to Ted’s
selflessness in giving his time and advice, and allowing plenty of room for
flexibility and individual development. I also have enormous gratitude for my
co-adviser, Dani Bassett, whose wisdom, insights, and genuine warmth have
benefited me so much throughout my thesis work. Furthermore, I would like to
express my sincere gratitude to Zongming Ma, whose crucial collaboration made
much of this dissertation possible. I am very much thankful to the members of my
thesis committee, including Geoffrey Aguirre, Francis Jensen, Lyle Ungar, and
Taki Shinohara, for always making the time to offer me their invaluable feedback
and constructive input. Finally, I would like to thank everyone at the Brain
Behavior Laboratory for providing me enrichment in and outside of the lab, the
Neuroscience Graduate Group, particularly Josh Gold, Yale Cohen, and
Christine Clay, for helping me navigate administrative challenges, the Medical
Scientist Training Program Office for always keeping me on track, Deutsche
Forschungsgemeinschaft for making my dream of studying abroad possible, and
the Blavatnik Family Foundation for financially supporting my last year of
ABSTRACT
LINKING FUNCTIONAL BRAIN NETWORKS
TO PSYCHOPATHOLOGY AND BEYOND
Huchuan Xia
Theodore D. Satterthwaite, M.D.,M.A., Danielle S. Bassett, Ph.D.
Neurobiological abnormalities associated with neuropsychiatric disorders
do not map well to existing diagnostic categories. High co-morbidity suggests
dimensional circuit-level abnormalities that cross diagnoses. As neuropsychiatric
disorders are increasingly reconceptualized as disorders of brain development,
deviations from normative brain network reconfiguration during development are
hypothesized to underlie many illness that arise in young adulthood. In this
dissertation, we first applied recent advances in machine learning to a large
imaging dataset of youth (n=999) to delineate brain-guided dimensions of
psychopathology across clinical diagnostic boundaries. Specifically, using sparse
Canonical Correlation Analysis, an unsupervised learning method that seeks to
capture sources of variation common to two high-dimensional datasets, we
discovered four linked dimensions of psychopathology and connectivity in
functional brain networks, namely, mood, psychosis, fear, and externalizing
behavior. While each dimension exhibited an unique pattern of functional brain
connectivity, loss of network segregation between the default mode and
executive networks emerged as a shared connectopathy common across four
Building upon this work, in the second part of the dissertation, we
designed, implemented, and deployed a new penalized statistical learning
approach, Multi-Scale Network Regression (MSNR), to study brain network
connectivity and a wide variety of phenotypes, beyond psychopathology. MSNR
explicitly respects both edge- and community-level information by assuming a
low rank and sparse structure, both encouraging less complex and more
interpretably modeling. Capitalizing on a large neuroimaging cohort (n=1,051),
we demonstrated that MSNR recapitulated interpretably and statistically
significant associations between functional connectivity patterns with brain
development, sex differences, and motion-related artifacts. Compared to
common single-scale approaches, MSNR achieved a balance between prediction
performance and model complexity, with improved interpretability.
Together, integrating recent advances in multiple disciplines across
machine learning, network science, developmental neuroscience, and psychiatry,
this body of work fits into the broader context of computational psychiatry, where
there is intense interest in the quest of delineating brain network patterns
TABLE OF CONTENTS
ACKNOWLEDGMENT ... iv
ABSTRACT ... v
LIST OF TABLES ... ix
LIST OF ILLUSTRATIONS ... x
CHAPTER 1: General Introduction ... 1
CHAPTER 2: Linked dimensions of pscyhopathology and connectivity in functional brain networks ... 24
Abstract ... 25
Methods ... 31
Results ... 46
Discussion ... 56
Tables ... 67
Figures ... 68
Supplementary Information ... 81
References ... 111
CHAPTER 3: Multi-scale network regression for brain-phenotype associations ... 122
Abstract ... 123
Introduction ... 124
Statistical Methodology ... 128
Results ... 143
Discussion ... 147
Supplementary Information ... 151
Figures ... 155
References ... 165
CHAPTER 4: General discussion ... 177
LIST OF TABLES
Table 2-1: Philadelphia neurodevelopmental cohort (PNC).
Supplementary Table 2-1: Clinical psychopathology levels in the PNC.
Supplementary Table 2-2: Correlations of loadings between
covariate-regressed and non-covariate-regressed features.
LIST OF ILLUSTRATIONS
Figure 2-1: Participants demographics.
Figure 2-2: Schematic of sparse canonical correlation analysis (sCCA).
Figure 2-3: sCCA reveals multivariate patterns of linked dimensions of
psychopathology and connectivity.
Figure 2-4: Connectivity-informed dimensions of psychopathology cross clinical
diagnostic categories.
Figure 2-5: Patterns of within- and between-network connectivity contribute to
linked psychopathological dimensions.
Figure 2-6: Loss of segregation between default mode and executive networks is
shared across dimensions.
Figure 2-7: Developmental effects and sex differences are concentrated in
specific dimensions.
Figure 2-8: Linked dimensions of psychopathology were replicated in an
independent sample.
Supplementary Figure 2-1: Sample construction.
Supplementary Figure 2-2: In-scanner motion of subjects.
Supplementary Figure 2-3: Pre-processed data without global signal regression
(GSR).
Supplementary Figure 2-4: Comparison of GSR effects in low and high motion
Supplementary Figure 2-5: Connectivity feature selection using median
absolute deviation (MAD).
Supplementary Figure 2-6: Grid search for regularization parameters.
Supplementary Figure 2-7: Permutation testing to assess significance of linked
dimensions.
Supplementary Figure 2-8: Patterns of canonical variates were robust to
methodological choices.
Supplementary Figure 2-9: Resampling procedure to identify stable features
contributing to each linked dimension.
Supplementary Figure 2-10: Network module analysis.
Supplementary Figure 2-11: Canonical variates in the replication sample accord
with findings in the discovery sample.
Supplementary Figure 2-12: Correlations between canonical variates and
previous factor analysis model.
Figure 3-1: A schematic for Multi-Scale Network Regression.
Figure 3-2: A schematic for MSNR model training and evaluation.
Figure 3-3: Benchmarking MSNR against common single-scale approaches.
Figure 3-4: Tuning parameter selection and model evaluation of MSNR in a
real-world large neuroimaging dataset.
Figure 3-5: MSNR describes meaningful individual differences in brain
Figure 3-6: MSNR achieves a balance between out-of-sample prediction
performance and model interpretability compared to common single-scale
mass-univariate approaches.
CHAPTER 1
Heterogeneity and Comorbidity in Neuropsychiatric Illness
It is increasingly clear that psychiatric diagnostic labels do not “carve
nature at its joint.” (Singh & Rose, 2009) In other words, clinical boundaries do
not map cleanly onto the underlying neurobiology of mental disorders (B. T. R.
Insel & Cuthbert, 2015). Two phenomena highlight such mismatch between
existing diagnostic categories and distinct neurobiological abnormalities: 1) the
marked levels of heterogeneity within an individual diagnosis (Hodgkinson et al.,
1987), and 2) co-morbidity across diagnoses (Jacobi et al., 2004). Accordingly,
studies have demonstrated different “subtypes” within discrete psychiatric
disorders, potentially explaining such heterogeneity (Clementz et al., 2016;
Drysdale et al., 2016). Similarly, research has also reported common structural,
functional, and genetic abnormalities across psychiatric syndromes, potentially
explaining such co-morbidity (Goodkind et al., 2015; Lee et al., 2013; McTeague
et al., 2017). This large body of literature gives prominence to the lack of direct
correspondence between clinical diagnostic categories and the underlying
pathophysiology.
Neurodevelopmental Model of Psychopathology
Another important observation regarding psychopathology is the fact that
many major neuropsychiatric disorders first begin in adolescence, with as much
Giedd, 2008). This early age of onset, together with insufficient therapeutic
interventions, contributes to the tremendous lifetime burden of psychiatric illness,
which routinely ranks as having the greatest impact on quality of life worldwide
(Whiteford et al., 2013). Not coincidentally, throughout adolescence and early
adulthood, the brain undergoes dramatic and complex changes (Cao, Huang,
Peng, Dong, & He, 2016; Giedd & Rapoport, 2010; Tomáš Paus, 2005). These
evidence indicates that abnormal brain maturation during critical phases of
development may be associated with psychopathology (Bassett, Xia, &
Satterthwaite, 2018; Rapoport, Giedd, & Gogtay, 2012). Despite the growing
appreciation that abnormal neurodevelopment is involved in many psychiatric
disorders, much is still unknown about how specific abnormalities of brain
development are associated with psychopathology.
These contexts have strongly motivated the goal to identify common
circuit-level abnormalities, especially in the developing brain, that may give rise
to the heterogeneous psychiatric symptoms across clinical diagnostic categories
(Cuthbert & Insel, 2013). Broadly, this is supported by an initiative championed
by the Research Domain Criteria (RDoC) of the National Institute of Mental
Health (T. Insel et al., 2010). RDoC seeks to construct a biologically-grounded
research framework for investigating psychiatric diseases. Critically, RDoC aims
to “explore dimensions of functioning that span the full range of human behavior
from normal to abnormal”, by integrating multimodal data, including genetic,
Network Neuroscience of Neurodevelopment and Disease
Network neuroscience is a powerful approach to study the myriad brain
systems implicated in psychopathology (Bassett & Sporns, 2017; Bassett et al.,
2018). Research in the past two decades in this emerging field has found
converging patterns of normal neurodevelopment, using both functional
connectivity (e.g. temporal correlation of blood-oxygen-level-dependent, or
BOLD, signals) (Gu et al., 2015; Power, Fair, Schlaggar, & Petersen, 2010;
Satterthwaite et al., 2013), and structural connectivity (e.g. estimation of white
matter tract based fractional anisotropy) networks (Baum et al., 2016). A
commonly studied network feature is the connectivity within- and between-
community of the network, also called network modules (Sporns & Betzel, 2016).
A network community is a collection of brain regions that are highly connected to
each other, but form sparse connections with regions outside of the community.
In other words, network community is internally dense, and externally sparse.
During normative development, within-community connectivity tend to strengthen
with age; whereas between-community connectivity tend to weaken with age
(Baum et al., 2016; Power et al., 2010; Satterthwaite et al., 2013). This pattern of
network reconfiguration suggests that the developing brain becomes more
segregated and specialized during this critical period of plasticity. Given the
neurodevelopmental model of psychopathology, this widely replicated network
network could underlie much vulnerability to psychopathology (Bassett et al.,
2018; Casey et al., 2014).
Indeed, prior studies using human imaging data and animal models have
found brain network patterns do not neatly respect the clinical categories defined
in the Diagnostic and Statistical Manual. For example, abnormalities of within-
and between-community connectivity of the default mode network and executive
networks have been implicated in a diverse range of psychopathology, including
both internalizing symptoms (e.g., mood and anxiety) (Berman et al., 2011;
Greicius, Supekar, Menon, & Dougherty, 2009; Skudlarski et al., 2010;
Whitfield-Gabrieli et al., 2009) and externalizing symptoms (e.g., attention deficit and
misconduct behaviors) (Castellanos et al., 2008; Skudlarski et al., 2010; Uddin et
al., 2010; von Rhein et al., 2016). In animal studies, local and long-range
synchrony of neuronal activity, such as local field potential activity in the !-band, has been shown to exhibit common abnormal patterns in animal models of a
wide range of neuropsychiatric disorders (Adhikari, Topiwala, & Gordon, 2010;
Grayson et al., 2016; Hultman et al., 2016; Sigurdsson, Stark, Karayiorgou,
Gogos, & Gordon, 2010; Uhlhaas & Singer, 2010).
Despite the increasing recognition that brain network abnormalities do not
map cleanly to current clinical categories, existing studies taking a
trans-diagnostic approach have been limited in several respects. First, most were
parse heterogeneity across the multiplicity of diagnoses (Satterthwaite et al.,
2015). Second, dimensions of psychopathology derived from traditional factor
analyses only examined the clinical symptomatology. While such approach,
including our prior work (Calkins et al., 2015; A N Kaczkurkin et al., 2017;
Antonia N. Kaczkurkin et al., 2016; Shanmugan et al., 2016), exploited a diverse
range of psychiatric symptoms, the lack of guidance by brain features limited its
impact to delineate the underlying neurobiology. Third, the vast majority of past
research efforts have focused on adults, unable to answer the prevailing
hypothesis of psychopathology as disorders of brain development (T. R. Insel,
2014). Finally, existing work that were able to study the critical window of brain
development unfortunately suffered from small sample size, with dozens of
participants. Modern multivariate analysis often requires much larger sample
sizes to have the power to link high-dimensional brain patterns to complex
behavioral and clinical measures (Bzdok & Yeo, 2017).
Multi-Scale Brain networks
Without a doubt, investigating how complex brain connectivity patterns are
associated with neuropsychiatric illness has been an active area of research in
the neuroscience community (Bassett & Sporns, 2017; Bzdok et al., 2016;
Rubinov & Sporns, 2009). More broadly, the availability of large, open
neuroimaging datasets as well as modern analytical tools and computational
across many domains, including development and aging, cognition, and
neuropsychiatric illness (Biswal et al., 2010; Jernigan et al., 2016; Schumann et
al., 2010; Van Essen et al., 2012).
However, most of these studies used general purpose statistical tools,
without explicitly taking advantage of or taking into account of features that are
unique to brain connectivity networks. This gap between the abundance of brain
network data and shortage of appropriate analytical tools remains largely unfilled
today. The ongoing quest to extract meaningful brain-phenotype relationships
using connectomic data demands a network-specific approach (Craddock,
Tungaraza, & Milham, 2015; Varoquaux & Craddock, 2013).
In modern network neuroscience, brain networks are represented by
nodes, which denote the anatomical brain regions, and edges, which represent
the connections between any pair of nodes (Rubinov & Sporns, 2009). As a
stereotypical network can be made up of hundreds of nodes, and in turn, tens of
thousands edges, one can investigate the properties of the network at different
scales. At the micro-scale, one can investigate the individual edges (Craddock et
al., 2015). At the meso-scale, assemble of edges form communities or modules,
which are internal sparse and external dense structures that are thought to form
the basis for specialized sub-units of information processing (Betzel, Medaglia, &
Bassett, 2018). Finally, at the macro-level, networks can be studied using global
efficiency, characteristic path length, and clustering coefficient (Rubinov &
Sporns, 2009).
Histological tracing and brain imaging studies have extensively
documented these scales of network architecture in the nervous systems of
humans and other species. This large body of work includes C. elegans (Sohn,
Choi, Ahn, Lee, & Jeong, 2011), Drosophila (Shih et al., 2015), mouse (Wang,
Sporns, & Burkhalter, 2012), rat (Bota, Sporns, & Swanson, 2015), cat (de Reus
& van den Heuvel, 2013), and macaque (Modha & Singh, 2010). Additionally,
prior work has also demonstrated that brain network architecture present on
these different scales are associated with development, aging, learning, memory,
cognition, neurological, and psychiatric illness (Bassett et al., 2018; Betzel et al.,
2014; Braun et al., 2016; Bressler & Menon, 2010; Crossley et al., 2013; Fornito,
Zalesky, & Breakspear, 2015; Grillon et al., 2013; Gu et al., 2015; Kernbach et
al., 2018; Park & Friston, 2013; Power et al., 2010; Xia et al., 2018; Yu et al.,
2019).
Single-Scale Approaches to Study Brain-Phenotype Relationships
Common strategies for studying brain connectivity and phenotype
relationship consider brain network features one individual scale at a time, either
with edge, community, or global statistics alone. For example, researchers have
macro-scale measure, in their functional brain networks compared to healthy controls
(Lynall et al., 2010). While this approach has shown to be powerful in a great
number of studies at demonstrating network abnormalities in neurological and
psychiatric disorders, global network measures at the macro-scale inevitably fail
to capture a large amount of information about complex brain systems at smaller
scales.
Alternatively, on the micro-scale, there exist strategies that focus on
group-level comparisons of individual edges. It takes in the form of mass
univariate analysis, where a statistical test, such as a linear model, is applied to
every edge (Craddock et al., 2015; Varoquaux & Craddock, 2013). While this
procedure is methodologically easy to implement, a few drawbacks make it less
practical. Chief among these caveats is the need to correct for a larger number of
multiple comparisons, which ultimately dampens power for discovering potentially
weak relationships between individual edge and phenotypes (Storey, 2002). In
the process of reducing type I error, this approach can be very conservative and
result in high type II error rates. To achieve balance between detection power
and false discovery, alternative edge-based methods have been developed, such
as the network based statistic (Zalesky, Fornito, & Bullmore, 2010) and
multivariate distance matrix regression (Zapala & Schork, 2012). While these
methods largely address the need for accounting for multiple comparison testing
on each edge through family wise error rate correction procedures similar to
exclusively on the microscale of edges while ignoring innate data structures in
the brain network, producing edge-level results that are difficult to interpret. With
a select attention on each element of the adjacency matrix without appreciation
of information present at a larger scale, edge-only approaches cannot see the
forest for the trees.
Another equally problematic caveat of the edge-based approach is that it
requires first vectorizing the connectivity matrix. This manipulation of the data
structure transforms the original symmetric adjacency matrices into a wide
feature table, where each column represents the edge strength across subjects.
This unavoidably disrupts structures in the data, most notably block structures
that represent meso-scale network features. To explicitly respect this
community-level network information, one could calculate the within- and between-
community connectivity as dependent variables in the linear models similar to the
mass univariate analysis using edges (Betzel et al., 2014; Crossley et al., 2013;
Gu et al., 2015). However, analogous to a high-order smoothing operation,
extracting the mean connectivity of community pairs mixes disparate signals and
also misses microscale information. While optimized for interpretability and low
dimensionality in an attempt to improve signal to noise ratio, the
community-based approach could be throwing the baby (signal) out with the bathwater
All told, single-scale approaches to study connectome-phenotype
relationship, whether on a microscale (edge) or mesoscale (community), present
with their own unique set of challenges of statistical power and interpretability.
Thus, a regression method that integrates information across multiple scales with
proper constraints could potentially achieve the best from both worlds. Indeed,
recent theoretical and experimental studies have described many complex
systems, including the financial system (Fenn et al., 2011), protein structure
(Delmotte, Tate, Yaliraki, & Barahona, 2011), physical particles (Bassett, Owens,
Porter, Manning, & Daniels, 2015), and the brain (Bassett & Siebenhühner, 2013;
Betzel & Bassett, 2017) from a multi-scale perspective. However, this body of
literature mostly concerns itself with network characterization and multi-scale
community detection, rather than how to extract relationship between brain
network and phenotypes in a multi-scale manner.
In this dissertation, the overall arching goal is to study complex
connectivity patterns in functional brain networks that are linked to a diverse
range of measurement, in particular, psychopathology. In both studies that follow,
we applied advanced machine learning techniques to delineate multivariate
patterns of functional connectivity.
In Chapter 2, we set out to map out linked dimensions of psychopathology
that are highly associated with patterns of functional connectivity. Specifically, to
we applied sparse canonical correlational analysis (sCCA) (Witten, Tibshirani, &
Hastie, 2009) to the Philadelphia Neurodevelopmental Cohort (PNC)
(Satterthwaite et al., 2014), a large cohort of youth with multimodal imaging and
item-wise psychiatric symptoms. We discovered four linked dimensions of
psychopathology and brain connectivity patterns, namely mood, psychosis, fear,
and externalizing behavior. These brain-guided psychopathological dimensions
cross traditional categorical boundaries while concurring with clinical experience.
Each dimension exhibited unique brain connectivity patterns; however, across all
psychopathology, loss of normative segregation between the default mode and
executive networks emerged as a common feature of connectivity dysfunction.
In Chapter 3, we introduce a new regression method specifically designed
to analyze the associations between high-dimensional connectomic data and
phenotypes of interest, which we refer to as Multi-Scale Network Regression
(MSNR). Specifically, we designed a penalized multivariate approach to explicitly
exploit both edge and community level information to extract brain-phenotype
relationships. By constraining a low rank and sparse structure on edges and
community level information, respectively, MSNR encourages less complex and
more interpretable modeling while achieves higher out-of-sample prediction
performance and statistical significance via permutation tests. We applied MSNR
to PNC and found that MSNR recapitulated known functional brain connectivity
patterns in association with age, sex, and in-scanner motion. In a head-to-head
community connectivity alone, MSNR achieved a balance between out-of-sample
References
Adhikari, A., Topiwala, M. A., & Gordon, J. A. (2010). Synchronized Activity between the Ventral Hippocampus and the Medial Prefrontal Cortex during Anxiety. Neuron, 65(2), 257–269.
https://doi.org/10.1016/j.neuron.2009.12.002
Bassett, D. S., Owens, E. T., Porter, M. A., Manning, M. L., & Daniels, K. E. (2015). Extraction of force-chain network architecture in granular materials using community detection. Soft Matter, 11(14), 2731–2744.
https://doi.org/10.1039/C4SM01821D
Bassett, D. S., & Siebenhühner, F. (2013). Multiscale Network
Organization in the Human Brain. In Multiscale Analysis and Nonlinear Dynamics (pp. 179–204). Weinheim, Germany: Wiley-VCH Verlag GmbH & Co. KGaA. https://doi.org/10.1002/9783527671632.ch07
Bassett, D. S., & Sporns, O. (2017). Network neuroscience. Nature Neuroscience, 20(3), 353–364. https://doi.org/10.1038/nn.4502.Network
Bassett, D. S., Xia, C. H., & Satterthwaite, T. D. (2018). Understanding the Emergence of Neuropsychiatric Disorders With Network Neuroscience. Biological Psychiatry: Cognitive Neuroscience and Neuroimaging, 3(9), 742–753.
https://doi.org/10.1016/J.BPSC.2018.03.015
Baum, G. L., Ciric, R., Roalf, D. R., Betzel, R. F., Moore, T. M., Shinohara, R. T., … Satterthwaite, T. D. (2016). Modular Segregation of Structural Brain Networks Supports the Development of Executive Function in Youth.
Berman, M. G., Peltier, S., Nee, D. E., Kross, E., Deldin, P. J., & Jonides, J. (2011). Depression, rumination and the default network. Social Cognitive and Affective Neuroscience, 6(5), 548–555. https://doi.org/10.1093/scan/nsq080
Betzel, R. F., & Bassett, D. S. (2017). Multi-scale brain networks.
NeuroImage, 160, 73–83. https://doi.org/10.1016/J.NEUROIMAGE.2016.11.006
Changes in structural and functional connectivity among resting-state networks across the human lifespan. NeuroImage, 102, 345–357.
https://doi.org/10.1016/J.NEUROIMAGE.2014.07.067
Betzel, R. F., Medaglia, J. D., & Bassett, D. S. (2018). Diversity of meso-scale architecture in human and non-human connectomes. Nature
Communications, 9(1), 346. https://doi.org/10.1038/s41467-017-02681-z
Biswal, B. B., Mennes, M., Zuo, X.-N., Gohel, S., Kelly, C., Smith, S. M., … Milham, M. P. (2010). Toward discovery science of human brain function. Proceedings of the National Academy of Sciences of the United States of America, 107(10), 4734–4739. https://doi.org/10.1073/pnas.0911855107
Bota, M., Sporns, O., & Swanson, L. W. (2015). Architecture of the cerebral cortical association connectome underlying cognition. Proceedings of the National Academy of Sciences, 112(16), E2093–E2101.
https://doi.org/10.1073/pnas.1504394112
Braun, U., Schäfer, A., Bassett, D. S., Rausch, F., Schweiger, J. I., Bilek, E., … Tost, H. (2016). Dynamic brain network reconfiguration as a potential schizophrenia genetic risk mechanism modulated by NMDA receptor function. Proceedings of the National Academy of Sciences of the United States of America, 113(44), 12568–12573. https://doi.org/10.1073/pnas.1608819113
Bressler, S. L., & Menon, V. (2010). Large-scale brain networks in
cognition: emerging methods and principles. Trends in Cognitive Sciences, 14(6), 277–290. https://doi.org/10.1016/J.TICS.2010.04.004
Bzdok, D., Varoquaux, G., Grisel, O., Eickenberg, M., Poupon, C., & Thirion, B. (2016). Formal Models of the Network Co-occurrence Underlying Mental Operations. PLOS Computational Biology, 12(6), e1004994.
https://doi.org/10.1371/journal.pcbi.1004994
Bzdok, D., & Yeo, B. T. T. (2017). Inference in the age of big data: Future perspectives on neuroscience. NeuroImage, 155, 549–564.
https://doi.org/10.1016/j.neuroimage.2017.04.061
Cohort : constructing a deep phenotyping collaborative. Journal of Child
Psychology and Psychiatry, 12, 1356–1369. https://doi.org/10.1111/jcpp.12416
Cao, M., Huang, H., Peng, Y., Dong, Q., & He, Y. (2016). Toward
Developmental Connectomics of the Human Brain. Frontiers in Neuroanatomy, 10(March), 25. https://doi.org/10.3389/fnana.2016.00025
Casey, B. J., Oliveri, M. E., & Insel, T. (2014). A neurodevelopmental perspective on the research domain criteria (RDoC) framework. Biological Psychiatry, 76(5), 350–353. https://doi.org/10.1016/j.biopsych.2014.01.006
Castellanos, F. X., Margulies, D. S., Kelly, C., Uddin, L. Q., Ghaffari, M., Kirsch, A., … Milham, M. P. (2008). Cingulate-Precuneus Interactions: A New Locus of Dysfunction in Adult Attention-Deficit/Hyperactivity Disorder. Biological Psychiatry, 63(3), 332–337. https://doi.org/10.1016/j.biopsych.2007.06.025
Clementz, B. A., Sweeney, J. A., Hamm, J. P., Ivleva, E. I., Ethridge, L. E., Pearlson, G. D., … Tamminga, C. A. (2016). Identification of distinct psychosis biotypes using brain-based biomarkers. American Journal of Psychiatry, 173(4), 373–384. https://doi.org/10.1176/appi.ajp.2015.14091200
Craddock, R. C., Tungaraza, R. L., & Milham, M. P. (2015). Connectomics and new approaches for analyzing human brain functional connectivity.
GigaScience, 4(1), 13. https://doi.org/10.1186/s13742-015-0045-x
Crossley, N. A., Mechelli, A., Vertes, P. E., Winton-Brown, T. T., Patel, A. X., Ginestet, C. E., … Bullmore, E. T. (2013). Cognitive relevance of the
community structure of the human brain functional coactivation network. Proceedings of the National Academy of Sciences, 110(28), 11583–11588. https://doi.org/10.1073/pnas.1220826110
Cuthbert, B. N., & Insel, T. R. (2013). Toward the future of psychiatric diagnosis: the seven pillars of RDoC. BMC Medicine, 11(1), 126.
https://doi.org/10.1186/1741-7015-11-126
de Reus, M. A., & van den Heuvel, M. P. (2013). Rich Club Organization and Intermodule Communication in the Cat Connectome. Journal of
Delmotte, A., Tate, E. W., Yaliraki, S. N., & Barahona, M. (2011). Protein multi-scale organization through graph partitioning and robustness analysis: application to the myosin–myosin light chain interaction. Physical Biology, 8(5), 055010. https://doi.org/10.1088/1478-3975/8/5/055010
Drysdale, A. T., Grosenick, L., Downar, J., Dunlop, K., Mansouri, F., Meng, Y., … Liston, C. (2016). Resting-state connectivity biomarkers define neurophysiological subtypes of depression. Nature Medicine, 23(1), 28–38. https://doi.org/10.1038/nm.4246
Fenn, D. J., Porter, M. A., Williams, S., McDonald, M., Johnson, N. F., & Jones, N. S. (2011). Temporal evolution of financial-market correlations. Physical Review E, 84(2), 026109. https://doi.org/10.1103/PhysRevE.84.026109
Fornito, A., Zalesky, A., & Breakspear, M. (2015). The connectomics of brain disorders. Nature Reviews Neuroscience, 16(3), 159–172.
https://doi.org/10.1038/nrn3901
Giedd, J. N., & Rapoport, J. L. (2010). Structural MRI of Pediatric Brain Development: What Have We Learned and Where Are We Going? Neuron, 67(5), 728–734. https://doi.org/10.1016/j.neuron.2010.08.040
Goodkind, M., Eickhoff, S. B., Oathes, D. J., Jiang, Y., Chang, A., Jones-hagata, L. B., … Etkin, A. (2015). Identification of a common neurobiological substrate for mental illness. JAMA Psychiatry, 5797(4), 305–315.
https://doi.org/10.1001/jamapsychiatry.2014.2206
Grayson, D. S., Bliss-Moreau, E., Machado, C. J., Bennett, J., Shen, K., Grant, K. A., … Amaral, D. G. (2016). The Rhesus Monkey Connectome Predicts Disrupted Functional Networks Resulting from Pharmacogenetic Inactivation of the Amygdala. Neuron, 91(2), 453–466.
https://doi.org/10.1016/j.neuron.2016.06.005
Greicius, M. D., Supekar, K., Menon, V., & Dougherty, R. F. (2009). Resting-state functional connectivity reflects structural connectivity in the default mode network. Cerebral Cortex, 19(1), 72–78.
https://doi.org/10.1093/cercor/bhn059
Devauchelle, A.-D., Krebs, M.-O., … Huron, C. (2013). Hyperfrontality and hypoconnectivity during refreshing in schizophrenia. Psychiatry Research: Neuroimaging, 211(3), 226–233.
https://doi.org/10.1016/J.PSCYCHRESNS.2012.09.001
Gu, S., Satterthwaite, T. D., Medaglia, J. D., Yang, M., Gur, R. E. R. C. R. E., Gur, R. E. R. C. R. E., & Bassett, D. S. (2015). Emergence of system roles in normative neurodevelopment. Proceedings of the National Academy of Sciences, 112(44), 201502829. https://doi.org/10.1073/pnas.1502829112
Hodgkinson, S., Sherrington, R., Gurling, H., Marchbanks, R., Reeders, S., Mallet, J., … Brynjolfsson, J. (1987). Molecular genetic evidence for
heterogeneity in manic depression. Nature, 325(6107), 805–806. https://doi.org/10.1038/325805a0
Hultman, R., Mague, S. D., Li, Q., Katz, B. M., Michel, N., Lin, L., … Hastie, T. (2016). Dysregulation of Prefrontal Cortex-Mediated Slow-Evolving Limbic Dynamics Drives Stress-Induced Emotional Pathology. Neuron, 0(0), 257–269. https://doi.org/10.1016/j.neuron.2016.05.038
Insel, B. T. R., & Cuthbert, B. N. (2015). Brain diorders? Precisely. Science, 348(6234), 499–500.
Insel, T., Cuthbert, B., Garvey, M., Heinssen, R., Pine, D. S., Quinn, K., … Wang, P. (2010). Research Domain Criteria (RDoC): Toward a new classification framework for research on mental disorders. American Journal of Psychiatry, 167(7), 748–751. https://doi.org/10.1176/appi.ajp.2010.09091379
Insel, T. R. (2014). Mental disorders in childhood: shifting the focus from behavioral symptoms to neurodevelopmental trajectories. JAMA : The Journal of the American Medical Association, 311(17), 1727–1728.
https://doi.org/10.1001/jama.2014.1193
Jacobi, F., Wittchen, H.-U., Hölting, C., Höfler, M., Pfister, H., Müller, N., & Lieb, R. (2004). Prevalence, co-morbidity and correlates of mental disorders in the general population: results from the German Health Interview and
Jernigan, T. L., Brown, T. T., Hagler, D. J., Akshoomoff, N., Bartsch, H., Newman, E., … Pediatric Imaging, Neurocognition and Genetics Study. (2016). The Pediatric Imaging, Neurocognition, and Genetics (PING) Data Repository. NeuroImage, 124(Pt B), 1149–1154.
https://doi.org/10.1016/j.neuroimage.2015.04.057
Kaczkurkin, A N, Moore, T. M., Calkins, M. E., Ciric, R., Detre, J. A., Elliott, M. A., … Satterthwaite, T. D. (2017). Common and dissociable regional cerebral blood flow differences associate with dimensions of psychopathology across categorical diagnoses. Molecular Psychiatry.
https://doi.org/10.1038/mp.2017.174
Kaczkurkin, Antonia N., Moore, T. M., Ruparel, K., Ciric, R., Calkins, M. E., Shinohara, R. T., … Satterthwaite, T. D. (2016). Elevated Amygdala
Perfusion Mediates Developmental Sex Differences in Trait Anxiety. Biological Psychiatry, 80(10), 775–785. https://doi.org/10.1016/j.biopsych.2016.04.021
Kernbach, J. M., Satterthwaite, T. D., Bassett, D. S., Smallwood, J., Margulies, D., Krall, S., … Bzdok, D. (2018). Shared endo-phenotypes of default mode dysfunction in attention deficit/hyperactivity disorder and autism spectrum disorder. Translational Psychiatry, 8(1), 133. https://doi.org/10.1038/s41398-018-0179-6
Lee, S. H., Ripke, S., Neale, B. M., Faraone, S. V, Purcell, S. M., Perlis, R. H., … Wray, N. R. (2013). Genetic relationship between five psychiatric disorders estimated from genome-wide SNPs. Nature Genetics, 45(9), 984–994.
https://doi.org/10.1038/ng.2711
Lynall, M.-E., Bassett, D. S., Kerwin, R., McKenna, P. J., Kitzbichler, M., Muller, U., & Bullmore, E. (2010). Functional connectivity and brain networks in schizophrenia. The Journal of Neuroscience, 30(28), 9477–9487.
https://doi.org/10.1523/jneurosci.0333-10.2010
McTeague, L. M., Huemer, J., Carreon, D. M., Jiang, Y., Eickhoff, S. B., & Etkin, A. (2017). Identification of Common Neural Circuit Disruptions in Cognitive Control Across Psychiatric Disorders. American Journal of Psychiatry, 174(7), 676–685. https://doi.org/10.1176/appi.ajp.2017.16040400
long-distance pathways in the macaque brain. Proceedings of the National Academy of Sciences, 107(30), 13485–13490. https://doi.org/10.1073/pnas.1008054107
Park, H. J., & Friston, K. (2013). Structural and functional brain networks: from connections to cognition. Science, 342(November), 579–588.
https://doi.org/10.1126/science.1238411
Paus, Tomáš. (2005). Mapping brain maturation and cognitive
development during adolescence. Trends in Cognitive Sciences, 9(2), 60–68. https://doi.org/10.1016/j.tics.2004.12.008
Paus, Tomás, Keshavan, M., & Giedd, J. N. (2008). Why do many psychiatric disorders emerge during adolescence? Nature Reviews. Neuroscience, 9(12), 947–957. https://doi.org/10.1038/nrn2513
Power, J. D., Fair, D. A., Schlaggar, B. L., & Petersen, S. E. (2010). The Development of Human Functional Brain Networks. Neuron, 67(5), 735–748. https://doi.org/10.1016/J.NEURON.2010.08.017
Rapoport, J. L., Giedd, J. N., & Gogtay, N. (2012). Neurodevelopmental model of schizophrenia: Update 2012. Molecular Psychiatry, 17(12), 1228–1238. https://doi.org/10.1038/mp.2012.23
Rubinov, M., & Sporns, O. (2009). Complex network measures of brain connectivity : Uses and interpretations. NeuroImage, 52(3), 1059–1069. https://doi.org/10.1016/j.neuroimage.2009.10.003
Satterthwaite, T. D., Elliott, M. A., Ruparel, K., Loughead, J., Prabhakaran, K., Calkins, M. E., … Gur, R. E. (2014). Neuroimaging of the Philadelphia
Neurodevelopmental Cohort. NeuroImage, 86(2014), 544–553. https://doi.org/10.1016/j.neuroimage.2013.07.064
Satterthwaite, T. D., Vandekar, S. N., Wolf, D. H., Bassett, D. S., Ruparel, K., Shehzad, Z., … Gur, R. E. (2015). Connectome-wide network analysis of youth with Psychosis-Spectrum symptoms. Molecular Psychiatry, 20(February), 1–8. https://doi.org/10.1038/mp.2015.66
Eickhoff, S. B., … Gur, R. C. (2013). Heterogeneous impact of motion on
fundamental patterns of developmental changes in functional connectivity during youth. NeuroImage, 83(2013), 45–57.
https://doi.org/10.1016/j.neuroimage.2013.06.045
Schumann, G., Loth, E., Banaschewski, T., Barbot, A., Barker, G., Büchel, C., … IMAGEN consortium. (2010). The IMAGEN study: reinforcement-related behaviour in normal brain function and psychopathology. Molecular Psychiatry, 15(12), 1128–1139. https://doi.org/10.1038/mp.2010.4
Shanmugan, S., Wolf, D. H., Calkins, M. E., Moore, T. M., Ruparel, K., Hopson, R. D., … Satterthwaite, T. D. (2016). Common and Dissociable Mechanisms of Executive System Dysfunction Across Psychiatric Disorders in Youth. The American Journal of Psychiatry, 173(5), 517–526.
https://doi.org/10.1176/appi.ajp.2015.15060725
Shih, C.-T., Sporns, O., Yuan, S.-L., Su, T.-S., Lin, Y.-J., Chuang, C.-C., … Chiang, A.-S. (2015). Connectomics-Based Analysis of Information Flow in the Drosophila Brain. Current Biology, 25(10), 1249–1258.
https://doi.org/10.1016/j.cub.2015.03.021
Sigurdsson, T., Stark, K. L., Karayiorgou, M., Gogos, J. A., & Gordon, J. A. (2010). Impaired hippocampal–prefrontal synchrony in a genetic mouse model of schizophrenia. Nature, 464(7289), 763–767.
https://doi.org/10.1038/nature08855
Singh, I., & Rose, N. (2009). Biomarkers in psychiatry. Nature, 460(7252), 202–207. https://doi.org/10.1038/460202a
Skudlarski, P., Jagannathan, K., Anderson, K., Stevens, M. C., Calhoun, V. D., Skudlarska, B. A., & Pearlson, G. (2010). Brain Connectivity Is Not Only Lower but Different in Schizophrenia: A Combined Anatomical and Functional Approach. Biological Psychiatry, 68(1), 61–69.
https://doi.org/10.1016/j.biopsych.2010.03.035
Sporns, O., & Betzel, R. F. (2016). Modular Brain Networks. Annual Review of Psychology, 67(1), 613–640. https://doi.org/10.1146/annurev-psych-122414-033634
Storey, J. D. (2002). A direct approach to false discovery rates. Journal of the Royal Statistical Society: Series B (Statistical Methodology), 64(3), 479–498. https://doi.org/10.1111/1467-9868.00346
Uddin, L. Q., Supekar, K., Amin, H., Rykhlevskaia, E., Nguyen, D. A., Greicius, M. D., & Menon, V. (2010). Dissociable connectivity within human angular gyrus and intraparietal sulcus: Evidence from functional and structural connectivity. Cerebral Cortex, 20(11), 2636–2646.
https://doi.org/10.1093/cercor/bhq011
Uhlhaas, P. J., & Singer, W. (2010). Abnormal neural oscillations and synchrony in schizophrenia. Nature Reviews. Neuroscience, 11(2), 100–113. https://doi.org/10.1038/nrn2774
Van Essen, D. C., Ugurbil, K., Auerbach, E., Barch, D., Behrens, T. E. J., Bucholz, R., … Yacoub, E. (2012). The Human Connectome Project: A data acquisition perspective. NeuroImage, 62(4), 2222–2231.
https://doi.org/10.1016/J.NEUROIMAGE.2012.02.018
Varoquaux, G., & Craddock, R. C. (2013). Learning and comparing functional connectomes across subjects. NeuroImage, 80, 405–415. https://doi.org/10.1016/J.NEUROIMAGE.2013.04.007
von Rhein, D., Oldehinkel, M., Beckmann, C. F., Oosterlaan, J., Heslenfeld, D., Hartman, C. A., … Mennes, M. (2016). Aberrant local striatal functional connectivity in attention-deficit/hyperactivity disorder. Journal of Child Psychology and Psychiatry, 57(6), 697–705. https://doi.org/10.1111/jcpp.12529
Wang, Q., Sporns, O., & Burkhalter, A. (2012). Network Analysis of Corticocortical Connections Reveals Ventral and Dorsal Processing Streams in Mouse Visual Cortex. Journal of Neuroscience, 32(13), 4386–4399.
https://doi.org/10.1523/JNEUROSCI.6063-11.2012
and substance use disorders: Findings from the Global Burden of Disease Study 2010. The Lancet, 382(9904), 1575–1586.
https://doi.org/10.1016/S0140-6736(13)61611-6
Whitfield-Gabrieli, S., Thermenos, H. W., Milanovic, S., Tsuang, M. T., Faraone, S. V, McCarley, R. W., … Seidman, L. J. (2009). Hyperactivity and hyperconnectivity of the default network in schizophrenia and in first-degree relatives of persons with schizophrenia. Proceedings of the National Academy of Sciences of the United States of America, 106(4), 1279–1284.
https://doi.org/10.1073/pnas.0809141106
Witten, D. M., Tibshirani, R., & Hastie, T. (2009). A penalized matrix decomposition, with applications to sparse principal components and canonical correlation analysis. Biostatistics, 10(3), 515–534.
https://doi.org/10.1093/biostatistics/kxp008
Xia, C. H., Ma, Z., Ciric, R., Gu, S., Betzel, R. F., Kaczkurkin, A. N., … Satterthwaite, T. D. (2018). Linked dimensions of psychopathology and
connectivity in functional brain networks. Nature Communications, 9(1), 3003. https://doi.org/10.1038/s41467-018-05317-y
Yu, M., Linn, K. A., Shinohara, R. T., Oathes, D. J., Cook, P. A., Duprat, R., … Sheline, Y. I. (2019). Childhood trauma history is linked to abnormal brain connectivity in major depression. https://doi.org/10.1073/pnas.1900801116
Zalesky, A., Fornito, A., & Bullmore, E. T. (2010). Network-based statistic: Identifying differences in brain networks. NeuroImage, 53(4), 1197–1207.
https://doi.org/10.1016/J.NEUROIMAGE.2010.06.041
CHAPTER 2
Linked Dimensions Of
Psychopathology And Connectivity
In Functional Brain Networks
This chapter has been published:
Abstract
Neurobiological abnormalities associated with psychiatric disorders do not
map well to existing diagnostic categories. High co-morbidity suggests
dimensional circuit-level abnormalities that cross diagnoses. Here we seek to
identify brain-based dimensions of psychopathology using sparse canonical
correlation analysis in a sample of 663 youths. This analysis reveals correlated
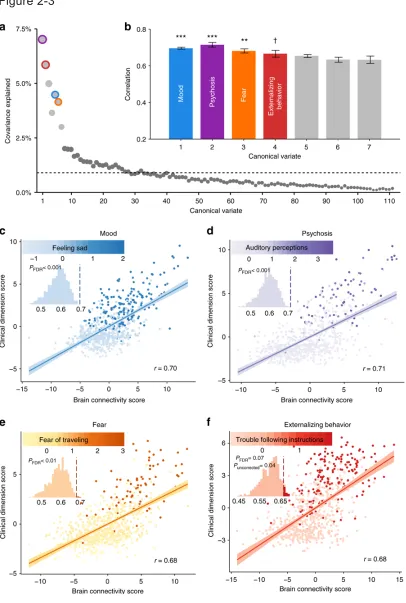
patterns of functional connectivity and psychiatric symptoms. We find that four
dimensions of psychopathology – mood, psychosis, fear, and externalizing
behavior – are associated (r = 0.68–0.71) with distinct patterns of connectivity.
Loss of network segregation between the default mode network and executive
networks emerges as a common feature across all dimensions. Connectivity
linked to mood and psychosis becomes more prominent with development, and
sex differences are present for connectivity related to mood and fear. Critically,
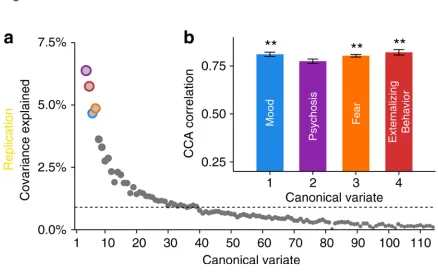
findings largely replicate in an independent dataset (n = 336). These results
delineate connectivity-guided dimensions of psychopathology that cross clinical
diagnostic categories, which could serve as a foundation for developing
Introduction
Psychiatry relies on signs and symptoms for clinical decision making,
without the use of established biomarkers to aid in diagnosis, prognosis, and
treatment selection. It is increasingly recognized that existing clinical
diagnostic categories could hinder the search for biomarkers in psychiatry
(Singh & Rose, 2009), as they are not clearly associated with distinct
neurobiological abnormalities (B. T. R. Insel & Cuthbert, 2015). The high
co-morbidity among psychiatric disorders exacerbates this problem (Jacobi et al.,
2004). Furthermore, studies have demonstrated common structural, functional,
and genetic abnormalities across psychiatric syndromes, potentially explaining
such co-morbidity (Goodkind et al., 2015; Lee, Ripke, Neale, Faraone, Purcell,
Perlis, Mowry, Wray, et al., 2013; McTeague et al., 2017). This body of
evidence underscores the lack of direct mapping between clinical diagnostic
categories and the underlying pathophysiology.
This context has motivated the development of the National Institute of
Mental Health’s Research Domain Criteria, which seek to construct a
biologically-grounded framework for psychiatric diseases (Cuthbert & Insel,
2013). In such a model, the symptoms of individual patients are conceptualized
as the result of mixed dimensional abnormalities of specific brain circuits.
While such a model system is theoretically attractive, it has been challenging
to implement in practice due to both the multiplicity of clinical symptoms and
Network neuroscience is a powerful approach for examining brain
systems implicated in psychopathology (Bassett & Sporns, 2017; Bullmore &
Sporns, 2009). One network property commonly evaluated is its community
structure, or modular architecture. A network module (also called a
sub-network or a community) is a group of densely interconnected nodes, which
may form the basis for specialized sub-units of information processing.
Converging results across data sets, methods, and laboratories provide
substantial agreement on large-scale functional brain modules such as the
somatomotor, visual, default mode, and fronto-parietal control networks
(Gordon et al., 2016; Power et al., 2011; Yeo et al., 2011). Furthermore,
multiple studies documented abnormalities within this modular topology in
psychiatric disorders (Bassett & Bullmore, 2009; Lynall et al., 2010).
Specifically, evidence suggests that many psychiatric disorders are associated
with abnormalities in network modules subserving higher-order cognitive
processes, including the default mode and fronto-parietal control networks
(Bassett, Xia, & Satterthwaite, 2018; Satterthwaite, Vandekar, et al., 2015).
In addition to such module-specific deficits, studies in mood disorders
(Kaiser, Andrews-Hanna, Wager, & Pizzagalli, 2015; Li et al., 2014), psychosis
(Alexander-Bloch et al., 2012; Lynall et al., 2010), and other disorders (Fornito,
Zalesky, & Breakspear, 2015; Rudie et al., 2013) have reported abnormal
rest. This is of particular interest as modular segregation of both functional
(Power, Fair, Schlaggar, & Petersen, 2010) and structural (Baum et al., 2017)
brain networks is refined during adolescence, a critical period when many
psychiatric disorders emerge. Such findings have led many disorders to be
considered “neurodevelopmental connectopathies.” (Paus, 2005) Describing
the developmental substrates of psychiatric disorders is a necessary step
towards early identification of at-risk youth, and might ultimately allow for
interventions that “bend the curve” of maturation to achieve improved
functional outcomes (T. R. Insel, 2014).
Despite the increasing interest in describing how abnormalities of brain
network development lead to the emergence of psychiatric disorders, existing
studies have been limited in several respects. First, most have adopted a
categorical case-control approach, or only examined a single dimension of
psychopathology (Satterthwaite, Vandekar, et al., 2015), and are therefore
unable to capture heterogeneity across diagnoses. Second, dimensional
psychopathology derived from factor analyses, including our prior work
(Calkins et al., 2015; A N Kaczkurkin et al., 2017; Antonia N. Kaczkurkin et al.,
2016; Shanmugan et al., 2016), were solely driven by covariance in the clinical
symptomatology, rather than being guided by both brain and behavior features.
Third, especially in contrast to adult studies, existing work in youth has often
techniques allow the examination of both multiple brain systems and clinical
dimensions simultaneously, such techniques usually require large samples
(Bzdok & Yeo, 2017).
In the current study, we seek to delineate functional network
abnormalities associated with a broad array of psychopathology in youth. We
have capitalized on a large sample of youth from the Philadelphia
Neurodevelopmental Cohort (PNC) (Satterthwaite et al., 2014) by applying a
recently-developed machine learning technique called sparse canonical
correlation analysis (sCCA) (Witten, Tibshirani, & Hastie, 2009). As a
multivariate method, sCCA is capable of discovering complex linear
relationships between two high-dimensional datasets (Avants et al., 2014;
Smith et al., 2015). It should be noted that the approach of the current study is
distinct from prior work discovering biotypes within categories of
psychopathology, based purely on imaging features themselves (e.g.,
functional connectivity (Drysdale et al., 2016) and gray matter density
(Clementz et al., 2016)). In contrast, we seek to link a broad range of
symptoms that are present across categories to individual differences in
functional brain networks. Such an approach has been successfully applied in
prior work on neurodegenerative diseases (Avants et al., 2014) as well as
Here, we use sCCA to delineate linked dimensions of psychopathology
and functional connectivity. As described below, we uncover dimensions of
connectivity that are highly correlated with specific, interpretable dimensions
of psychopathology. We find that each psychopathological dimension is
associated with a distinct pattern of abnormal connectivity, and that all
dimensions are characterized by decreased segregation of default mode and
executive networks (fronto-parietal and salience). These network features
linked to each dimension of psychopathology show expected developmental
changes and sex differences. Finally, our results are largely replicated in an
Methods
PARTICIPANTS
Resting-state functional magnetic resonance imaging (rs-fMRI) datasets
were acquired as part of the Philadelphia Neurodevelopmental Cohort (PNC),
a large community-based study of brain development (Satterthwaite et al.,
2014). In total, 1601 participants completed the cross-sectional neuroimaging
protocol (Table 2-1, Figure 2-1). One subject had missing clinical data. To
create two independent samples for discovery and replication analyses, we
performed a random split of the remaining 1600 participants using the CARET
package in R. Specifically, using the function createDataPartition, a
discovery sample (n = 1069) and a replication sample (n = 531) were created
that were stratified by overall psychopathology (Supplementary Figure 2-1).
The two samples were confirmed to also have similar distributions in regards to
age, sex, and race (Figure 2-1), as well as motion (Supplementary Figure
2-2). Overall psychopathology is the general factor score reported previously
from factor analysis of the clinical data alone (Calkins et al., 2015; Shanmugan
et al., 2016).
Of the discovery sample (n = 1069), 111 were excluded due to gross
radiological abnormalities or a history of medical problems that might affect
brain function. Of the remaining 958 participants, 45 were excluded for having
incomplete image coverage, or excessive motion during the functional scan,
which is defined as having an average framewise motion more than 0.20 mm
or more than 20 frames exhibiting over 0.25 mm movement (using the
Jenkinson calculation (Jenkinson, Bannister, Brady, & Smith, 2002)). These
exclusion criteria produced a final discovery sample consisting of 663 youths
(mean age 15.82, SD = 3.32; 293 males and 370 females). Applying the same
exclusion criteria to the replication sample produced 336 participants (mean
age 15.65, SD = 3.32; 155 males and 181 females). See Table 2-1 and Figure
2-1 for detailed demographics of each sample.
PSYCHIATRIC ASSESSMENT
Psychopathology symptoms were evaluated using a structured
screening interview (GOASSESS), which has been described in detail
elsewhere (Calkins et al., 2015). To allow rapid training and standardization
across a large number of assessors, GOASSESS was designed to be highly
structured, with screen-level symptom and episode information. The instrument
is abbreviated and modified from the epidemiologic version of the NIMH
Genetic Epidemiology Research Branch Kiddie-SADS (Merikangas et al.,
2010). The psychopathology screen in GOASSESS assessed lifetime
occurrence of major domains of psychopathology including psychosis
spectrum symptoms, mood (major depressive episode, mania), anxiety
separation anxiety), behavioral disorders (oppositional defiant, attention
deficit/hyperactivity, conduct), eating disorders (anorexia, bulimia), and suicidal
thinking and behavior (Supplementary Table 2-1). The 111 item-level
symptoms used in this study were described in prior factor analysis of the
clinical data in PNC (Shanmugan et al., 2016). For the specific items, see
Supplementary Data 2-1.
IMAGE ACQUISITION
Structural and functional subject data were acquired on a 3T Siemens
Tim Trio scanner with a 32-channel head coil (Erlangen, Germany), as
previously described (Satterthwaite et al., 2014). High-resolution structural
images were acquired in order to facilitate alignment of individual subject
images into a common space. Structural images were acquired using a
magnetization-prepared, rapid-acquisition gradient-echo (MPRAGE)
T1-weighted sequence (TR = 1810ms; TE = 3.51 ms; FoV = 180 × 240 mm;
resolution 0.9375 × 0.9375 × 1 mm). Approximately 6 minutes of task-free
functional data were acquired for each subject using a blood oxygen
level-dependent (BOLD-weighted) sequence (TR = 3000 ms; TE = 32 ms;
FoV = 192 × 192 mm; resolution 3 mm isotropic; 124 volumes). Prior to
scanning, in order to acclimate subjects to the MRI environment and to help
subjects learn to remain still during the actual scanning session, a mock
head coil. Mock scanning was accompanied by acoustic recordings of the
noise produced by gradient coils for each scanning pulse sequence. During
these sessions, feedback regarding head movement was provided using the
MoTrack motion tracking system (Psychology Software Tools, Inc.,
Sharpsburg, PA). Motion feedback was only given during the mock scanning
session. In order to further minimize motion, prior to data acquisition subjects’
heads were stabilized in the head coil using one foam pad over each ear and a
third over the top of the head. During the resting-state scan, a fixation cross
was displayed as images were acquired. Subjects were instructed to stay
awake, keep their eyes open, fixate on the displayed crosshair, and remain
still.
STRUCTURAL PREPROCESSING
A study-specific template was generated from a sample of 120 PNC
subjects balanced across sex, race, and age bins using the
buildtemplateparallel procedure in ANTS (Avants, Tustison, Song, et al., 2011).
Study-specific tissue priors were created using a multi-atlas segmentation
procedure (Wang et al., 2014). Subject anatomical images were independently
rated by three highly trained image analysts. Any image that did not pass
manual inspection was removed from the analysis. Each subject’s
high-resolution structural image was processed using the ANTS Cortical Thickness
2010), each structural image was diffeomorphically registered to the
study-specific PNC template using the top-performing SYN deformation provided by
ANTS (Klein et al., 2009). Study-specific tissue priors were used to guide brain
extraction and segmentation of the subject’s structural image (Avants,
Tustison, Wu, Cook, & Gee, 2011).
FUNCTIONAL PREPROCESSING
Task-free functional images were processed using one of the
top-performing pipelines for removal of motion-related artifact (Ciric et al., 2017).
Preprocessing steps included (1) correction for distortions induced by magnetic
field inhomogeneities using FSL’s FUGUE utility, (2) removal of the 4 initial
volumes of each acquisition, (3) realignment of all volumes to a selected
reference volume using MCFLIRT (Jenkinson et al., 2002), (4) removal of and
interpolation over intensity outliers in each voxel’s time series using AFNI’s
3Ddespike utility, (5) demeaning and removal of any linear or quadratic
trends, and (6) co-registration of functional data to the high-resolution
structural image using boundary-based registration (Greve & Fischl, 2009).
The artefactual variance in the data was modelled using a total of 36
parameters, including the six framewise estimates of motion, the mean signal
extracted from eroded white matter and cerebrospinal fluid compartments, the
mean signal extracted from the entire brain, the derivatives of each of these
derivatives. Importantly, our findings are robust to the methodological choice of
regressing out global signal (Supplementary Figure 2-3 and Supplementary
Figure 2-4). Both the BOLD-weighted time series and the artefactual model
time series were temporally filtered using a first-order Butterworth filter with a
passband between 0.01 and 0.08 Hz (Hallquist, Hwang, & Luna, 2013).
NETWORK CONSTRUCTION
We built a functional connectivity network using the residual timeseries
(following de-noising) of all parcels of a common parcellation (Power et al.,
2011). The parcellation used in the main analysis consists of 264 spherical
nodes of 20 mm diameter distributed across the brain (Power et al., 2011). The
a priori communities for this set of nodes were originally delineated using the
Infomap algorithm (Rosvall & Bergstrom, 2008) and were replicated in an
independent sample. This parcellation was particularly suitable for our analysis
as it has been previously used for studying developmental changes in
connectivity and network modularity (Power et al., 2010) and has been used as
part of several studies in this dataset in the past (Chai et al., 2017; Ciric et al.,
2017; Gu et al., 2015). As part of the supplementary analysis to demonstrate
the robustness of the results independent of parcellation choices
(Supplementary Figure 2-8), we also constructed networks based on an
alternative parcellation developed by Gordon et al. (2016). This set of nodes
parcels. The functional connectivity between any pair of brain regions was
operationalized as the Pearson correlation coefficient between the mean
activation timeseries extracted from those regions. For each parcellation,
an n × n weighted adjacency matrix encoding the connectome was thus
obtained, where n represents the total number of nodes (or parcels) in that
parcellation. Community boundaries were defined a priori for each parcellation
scheme.
To ensure that potential confounders did not drive the canonical
correlations, we regressed out relevant covariates out of the input matrices.
Specifically, using the glm and residual.glm functions in R, we regressed
age, sex, race, and in-scanner motion out of the connectivity data, and
regressed age, sex, and race out of the clinical data. Importantly, we found that
the canonical variates derived from regressed and non-regressed datasets
were comparable, with highly correlated feature weights (Supplementary
Table 2-2).
DIMENSIONALITY REDUCTION
Each correlation matrix comprised 34,980 unique connectivity features.
We reasoned that since sCCA seeks to capture sources of variation common
to both datasets, connectivity features that are most predictive of psychiatric
symptoms would be those with high variance across participants. Therefore, to