A STUDY ON DIFFERENT APPROACHES OF
OUTLIER DETECTION IN DATA MINING
Mugdha Sharma
1, Ankit Goyal
21
Assistant Professor, MCA, Rukmini Devi Institute of Advanced Studies, (India)
2
PGDM Student, Marketing, FORE School of Management, (India)
ABSTRACT
Data mining is a process of extracting knowledge from large databases. Knowledge is appreciated as ultimate power now a days and considered as very important factor for the success of any organization because it has impacted the role of people working in that organization. Outlier detection is an important task in data mining and it has got many real time applications. The majority of real-time data contains certain unwanted or unrelated values, generally termed as “outliers”. The segregation of outlier improves the quality of data, and
thereby the accuracy rate is increased. The outlier is either individual or groups that depend upon the data and applications. Outlier occurs due to various reasons such as automatic faults, behavioral changes in the system, human error, irrelevant data and instrument faults. This paper presents an overview of outlier concepts, taxonomy, approaches and review of outlier detection algorithms and techniques.
Keywords
:Cluster-based outlier, Collective outlier, Contextual outlier, Density-based outlier,
Depth-based outlier, Distribution-based outlier
I
INTRODUCTION
Data mining is a process of mining high quality hidden and valuable information from the data. The availability and accessibility of data are increased in the internet. Many organizations grant permission to freely access their data which are available on the internet (e.g. World Bank, USDA, etc.) by downloading for research purpose. Before using this data for research, the outlier and the anomalous must be removed. Suppose the data is small, inspection can then be done manually. When the quality of data is too large, then an automated procedure is needed to perform this task. The main aim of detecting outlier is to improve the quality of data.
The outlier shall be appropriate to the variability of measurement, or it happens to experimental error or may be barred from the dataset. Outliers can occur in any distribution, but they are measurement errors or population has a heavy-tailed distribution.
effective for further analyses. Some of the outlier detection applications are: Intrusion Detection System, Credit Card Fraud, Interesting Sensor Measures,Medical Analysis [3], etc. This paper briefly analyses the outlier detection concepts, approaches and review of techniques for various applications.
The paper is structured as follows. Section 2 covers the related work done by various researchers. Then section 3 analyses the problems of outlier detection, Section 4 presents the taxonomy of outlier detection method, Section 5 enumerates the different types of outliers, Section 6 deals with the approaches of outlier detection. After which the Conclusion is provided in section 7.
II
RELATED
WORK
This section analyses the existing work of outlier detection by various researchers over different types of data. According to Moore and McCabe (1999) “an outlier is an observation that lies outside the overall pattern of a distribution”. Chen et al. (2002) are of the view that “Outliers are those data records that do not follow any
pattern in an application”.
Various outlier detection methods are proposed by great number of researchers. Rohan Baxter et al. [16] presented the comparison of outlier detection & linkage between data mining method and statistical outlier detection methods. They performed various techniques on statistical based dataset and network related dataset and found that Hadi technique performs well for both, large and complex datasets. They also proved that Donoho- Stahel technique will not be able to handle large datasets. Graham Williams et al. [5] proposed a comparative study of Replicator Neural Networks (RNN) for Outlier Detection in Data Mining. They proposed that RNN works well for both large and small datasets and MML works well for scattered outlier. S. D. Pachgade and S. S. Dhande [14] described a hybrid clustering based method which worked better than distance based method. So it helps in better outlier detection due to reduction in size and computational time.
Manish Gupta et al. [11] explained the outlier detection for temporal data. They presented a comprehensive and structured overview with the large temporal dataset. Fabrizio et al. [4] illustrated the detecting and predicting of the outliers based on unsupervised distance based method. Their proposed method based on the notion of outlier detection solving set and subset used to predict any unseen objects being considered as outliers. R. Andrew Weekley et al. [1] proposed an algorithm which can identify optimal clusters with both delay space and time domain. Similarly, Bo Liu et al. [2] also worked on improving the tradeoff between detection rate and false rate. This paper presents a study on application of outlier detection and its various approaches.
III
PROBLEMS
IN
OUTLIER
DETECTION
Outlier detection will identify the patterns of data which is deviating from the normal behavior. It is not very easy to define normal behavior or normal region. The difficulties are enlisted below:
1) Enclose with possible normal behavior in the region,
2) The rough boundary between normal and outlier behaviour is the same, time outlier observation is also very close with behavior of normal and vice-versa,
3) The outlier observations must be made as a normal observation, when outlier results from malicious actions, 4) A different notion of outlier is used in different application domain that leads to applying techniques which are developed for each domain,
6) Detecting outlier and noise is difficult and it is also hard to differentiate between noise and outlier.
Owing to exceeding challenges, the outlier detection problem is not very easy to solve. Even the existing outlier detection techniques will solve the specific problem formulation, which will take into account the various factors such as the nature of the data, type of outlier belongs, data labels and output of outlier detection [9].
IV TAXONOMY
OF
OUTLIER
DETECTION
METHOD
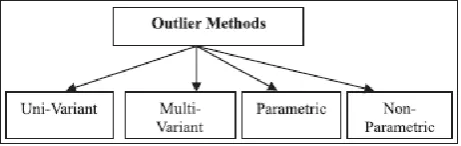
The Outlier Detection Method is classified into various methods which are charted in the following fig. 1.
Figure 1: Taxonomy of outlier methods.
Uni-Variant Method means looking for single variables or parameter.
Multi-Variant Method will look for more than one parameter or one variable [6].
Parametric (Statistical) Method assumes a known primary distribution of the observations or is based on statistical evaluation of unknown distribution parameters. This method results in outlier, when the observation deviates from the model assumptions. This method will not suit high-dimensional datasets and arbitrary dataset, and need prior knowledge of underlying data distribution [19].
Non-Parametric Method works well with a lot of data which are used for modeling high dimensional data and does not know whether it belongs to underlying data distribution.
V TYPES
OF
OUTLIERS
Outlier is classified into three categories which are given below: 1. Point Outlier,
2. Contextual Outlier, and 3. Collective Outlier.
Point Outlier: Any individual data instance can be referred as anomalous with respect to the rest of the data, and then the individual instance will be considered as a point outlier. Example: fig. 2 demonstrates point outlier in a form of simple 2-dimensional data. The data has 2 normal regions. N1 and N2, as most of the observations of the data lie in these two regions. Points which are away from normal regions, i.e., o1, o2 and o3 are considered as point outlier.
Contextual Outlier: When the data instance is anomalous for a specific context, then it is known as contextual outlier (also known as conditional outlier). The notion of context is based on the structure of the dataset and those must be specified as part of the problem statement. All data instances are defined by two sets of attributes: Contextual Attributes: Helps to determine the context for each instance. For example, in time-series data, the attribute of time is contextual where it will decide the location of instance for the entire series.
Behavioral Attributes: It defines the non-textual uniqueness of an instance. For example, in spatial data, average is a behavioral attribute which describes the average rainfall of the entire world from any location. Generally, the anomalous behavior of contextual outlier is determined by using the values of behavioral attributes within a specific context. A data instance may be a contextual outlier in a given context, but the identical data instance, according to behavioral attribute, can be considered as normal in a different context. This key helps to identify contextual and behavioral attributes for contextual outlier detection. Time-series and spatial data alone can work well in contextual outlier. For example, a six feet tall adult may be a normal person, but according to kids, it will be considered as abnormal.
Collective Outlier: In a data set, if the collection instance is detected as anomalous, it is known as collective outlier. Each and every data present in the collective outlier might not be anomalous by itself, but their incidence together is considered as a collection of outlier. For example, in a school, a particular standard, say 5th, students are sitting in their class. Among them, half of the students belong to the 6th standard. These 6th
standard students are called outliers. Collective outlier can be explored in spatial data, graph data and sequence data. The crucial point to be noted is that the point outlier can occur in any data set, but collective outlier can occur only when the data instances are having relationship between them.
In addition to the above outliers, there are cluster outlier (occur in small, low variance), radial outlier (occur in a plane out from the major axis) and scattered outlier (occur randomly scattered). The proportion of outliers is known as contamination levels. In statistical literature, the proportion of the outlier can be considered upon 40%, while the data mining literature study says the contamination level can be at least an order of magnitude less than 4%. Detecting and eliminating the outlier is a preprocessing step in data cleaning.
VI
APPROACHES
FOR
OUTLIER
DETECTION
There are different approaches available to handle outlier detection. Researchers use these approaches for different applications and for different problems. One after another, the various approaches are analyzed below:
Distribution-basedMethod: This method is based on statistical techniques.When data deviate from the model, the standard distribution model will flag as outlier. The functioning of high dimensional data is complex. Before applying arbitrary dataset, prior knowledge is required, or else it becomes more expensive to determine which model is best for the dataset. This method depends on data distribution which helps to fit the data, the parameter of the distribution (known or not) and the number and expected outliers (Upper or lower).
Two main problems of this method are:
1) Unsuitable for multidimensional data set, and 2) Depends only on distribution base for fitting the data.
Depth-based Method: This method works with computational geometry and computes different layers of K–d u-shaped hulls. Based on depth, data objects are organized as hull layers in data space according to peeling depth, and outliers are found out from the data objects with shallow depth value. This method overcomes the problem of distribution method where it will be able to work with multidimensional data objects and avoids the problem of distribution for fitting the data.
Clustering Method: This method is a base method for detecting outlier. It helps to detect potential outlier from the dataset. According to clustering algorithm, data which are not located in the clusters, and those data which are away from cluster, are considered as outliers. Clustering algorithm should satisfy three important constraints:
• Determine clusters with arbitrary shape,
• Efficiency is good on large database, and
• Determine the input parameters.
Some of the clustering algorithms are developed in the context of Knowledge Discovery Database (KDD) which will help to detect outlier from data. The main objective of clustering algorithm is to detect outlier. According to clustering, the exception is known as “noise”, which is bearable or else ignored when the result is produced.
Distance-based (DB) Method: This method was originally proposed by Knorr and Ang [10]. Again, this method was enhanced by Ramaswamy et al. [13,22]. It is a non-parametric method which identifies outlier, based on distance between points and nearest neighbor in the dataset. The outlier is detected as “An object O in a dataset T is a (p, D) considered outlier only, if at least a fraction p of the objects in T lies at a distance greater that D from O”. The parameter p is threshold value, one of the constraints of normal data points. In mining, distance based outlier is index based algorithm, nested loop algorithm and cell based algorithm. Pruning and batch processing are used to improve the efficiency of outlier detection [4].
Deviation Based Method: This method does not use any distance-based or a statistical test to identify exceptional objects in the dataset. It identifies outliers by examining the main characteristics of objects as a group. Outliers are points which will not fit with the characteristics of the dataset.
Density-based Method: It was proposed by Breunig et al. [16]. It estimates the density distribution of the input space and then discovers outliers as those lying in regions with low density. This approach is very sensitive to parameters for defining neighborhood. It needs the concept of local outlier. Index based, two-way approach and the micro cluster based analysis algorithms are used for density based.
The above approaches are used to detect outlier, and process of techniques varies for each approach. Each approach has a number of techniques [2, 8]. Some techniques will work only for specific data, and also, some techniques will detect outlier for any kind of data. The size of the dataset also differs for each algorithm, i.e., there is some restriction on handling the size of the dataset. Each approach has its own merits and demerits. But all the above approaches help to detect outlier effectively.
VII
CONCLUSION
AND
FUTURE
SCOPE
One of the main works in data mining is to find out outliers. This paper concludes that most of the outlier detection research focuses on algorithm which requires background knowledge of outlier detection and also which varies from one domain to another domain. The efficiency of outlier detection heavily depends on the distribution of data and type of data. For example, the novel detection method will work only for signal processing. Likewise, there is a limitation in handling the data and size of data set. Detecting outlier is very important, because, it includes lot of important information which leads to further research in a different domain. It was observed that individual methods are not efficient for detecting outlier in particular data. In such a situation it is better to combine different approaches for outlier detection. This survey provides a brief analysis about outlier detection concepts, problems in outlier detection, types of outliers, approaches and related works of outlier detection.
REFERENCES
[1] R. Andrew Weekley, Robert K. Goodrich and Larry b. Cornman (2009), “An Algorithm for Classification and Outlier
Detection of Time-Series Data”, Journal of Atmospheric and Oceanic Technology Vol. 27, pp. 94–107.
[2] Bo Liu, Yanshan Xiao, Philip S. Yu, Zhifeng Hao and Longbing Cao (2013), “An Efficient Approach for Outlier
Detection with Imperfect Data Labels”, IEEE Transactions on Knowledge and Data Engineering, pp. 1–14.
[3] Edwin M. Knorr, Raymond T. Ng and Vladimir Tucakov (2000), “Distance-based outliers: Algorithms and applications”,
The VLDB Journal, Vol. 8, pp. 237–253.
[4] Fabrizio Angiulli, Stefano Basta and Clara Pizzuti (2006), “Distance-Based Detection and Prediction of Outliers”, IEEE
Transactions on Knowledge and Data Engineering, Vol. 18, No. 2, pp. 145–160.
[5] Graham Williams, Rohan Baxter, Hongxing He, Simon Hawkins and Lifang Gu (2002), “A Comparative Study of RNN
for Outlier Detection in Data Mining”, 2nd IEEE International Conference on Data Mining (ICDM02), ISSN
0-7695-1754-4, pp. 709–712.
[6] G. S. David, Sam Jayakumar and Bejoy John Thomas (2013), “A New Procedure of Clustering Based on Multivariate
Outlier Detection”, Journal of Data Science, pp. 69–84.
[7] Hodge, V.J. and Austin, J. (2004), “A survey of outlier detection methodologies”, Artificial Intelligence Review, pp.
85-126,
[8] Hui Xiong, Gaurav Pandey, Michael Steinbach and Vipin Kumar (2006), “Enhancing Data Analysis with Noise Removal”, IEEE Transactions on Knowledge and Data Engineering, Vol. 18, No. 3, pp. 304–319.
[9] Karanjit Singh and Dr. Shuchita Upadhyaya (2012), “Outlier Detection: Applications and Techniques”, IJCSI
International Journal of Computer Science Issues, Vol. 9, Issue 1, No. 3, ISSN (Online): 1694-0814, pp. 307–323.
[10] Markus M. Breunig, Hans-Peter Kriegel, Raymond T. Ng and J¨org Sander (2000), “LOF: Identifying density based
[11] Manish Gupta, Jing Gao, Charu C. Aggarwal and Jiawei Han (2013), “Outlier Detection for Temporal Data: A Survey”,
IEEE Transactions on Knowledge and Data Engineering, Vol. 25, No. 1, pp. 1–20.
[12] Mark Last and Abraham Kandel, “Automated Detection of Outliers in Real-World Data”, Ben-Gurion University of the
Negev, pp. 1–10.
[13] M. O. Mansu and Mohd. Noor M.d. Sap (2005), “Outlier Detection Technique in Data Mining: A Research Perspective”, Proceedings of the Postgraduate Annual Research Seminar, pp. 23–31.
[14] Ms. S. D. Pachgade and Ms. S. S. Dhande (2012), “Outlier Detection over Data Set Using Cluster-Based and
Distance-Based Approach”, International Journal of Advanced Research in Computer Science and Software Engineering,
ISSN.2277 128X, Vol. 2, No. 6, pp. 12–16.
[15] Prakash Chandore and Prashant Chatur (2013), “Outlier Detection Techniques over Streaming data in data mining: A Research Perspectives”, International Journal of Recent Technology and Engineering, ISSN.2277-3878, Vol. 2, No. 1,
pp. 157–162.
[16] Rohan Baxter, Hongxing He, Graham Williams, Simon Hawkins and Lifang Gu, “An Empirical Comparison of Outlier Detection Methods”, Mathematical and Information Sciences (CSIRO).
[17] R. B. Robinson, Chris D. Cox and K. Odom (2005), “Identifying Outliers in Correlated Water Quality Data”, Journal of
Environmental Engineering, pp. 651–657.
[18] Silvia Cateni, Valentina Colla and Marco Vannucci (2008), “Outlier Detection Methods for Industrial Applications”,
Advances in Robotics, Austria, ISBN: 78-953-7619-16-9, pp. 265–282.
[19] Spiros Papadimitriou, Hiroyuki Kitagawa, Phillip B. Gibbons and Christos Faloutsos (2002), “LOCI: Fast Outlier
Detection Using the Local Correlation Integral,” Intel Research Laboratory Technical Report No. RP-TR-02-09.
[20] Yuh-Jye Lee, Yi-Ren Yeh and Yu-Chiang Frank Wang (2013), “Anomaly Detection via Online Oversampling Principal Component Analysis”, IEEE Transactions on Knowledge and Data Engineering, Vol. 25, No. 7, pp. 1460–1470. [21] Zhiguo Li, Robert J. Baseman, Yada Zhu, Fateh A. Tipu, Noam Slonim and Lavi Shpigelman (2014), “A Unified
Framework for Outlier Detection in Trace Data Analysis”, IEEE Transactions on Semiconductor Manufacturing, Vol.
27, No. 1, pp. 95–103.