A Sensitive method for Simultaneous quantitation of Estradiol and Estrone in human plasma by Liquid
chromatography-tandem mass spectrometry with electrospray ionization
Raghunatha P1, Shital P2, Jagruti P2
1: Synchron Research Services Pvt. Ltd., 6th Floor, The Chambers, SG Highway, Bodakdev, Ahmedabad – 380054
2: Department of Pharmacology, Nirma University, Sarkhej-Gandhinagar Highway, Ahmedabad - 382 481
Summary
A rapid and sensitive, sensitive liquid chromatography-tandem mass spectrometry method was developed and validated for simultaneous quantitation of Estradiol and Estrone in human plasma. The analyte were extracted by liquid-liquid extraction with dicholormethane. Amlodipine was used as the internal standard. The chromatographic separation was performed with a mobile phase comprising formic acid and methanol in gradient mode. The mass transitions of m/z 506.13/170.66 for
3-dansyl-estradiol, m/z 504.10/170.66 for 3-dansyl
estrone were monitored using multipe reaction-monitoring (MRM) modes for quantification. The assay was linear over the concentration range of 10-1080 pg mL-1 for Estradiol and 10-1080 pg mL-1 for estrone. The
lower level of quantification in human plasma was obtained at 10.0 pg mL-1 for Estradiol and 10.0 pg mL-1 for estrone using optimum tuning parameters. Acceptable precision and accuracy were obtained for concentrations over the standard curve ranges. The validated method has been applied to analyze the Estradiol and estrone concentrations in human bioequivalence study.
Key Words: LC-MS/MS, Estradiol, Estrone, Amlodipine, Dansylation
Correspondence Address; Raghunatha Pokale,
Synchron Research Services Pvt. Ltd., 6th
Floor, The Chambers, SG Highway, Bodakdev, Ahmedabad - 380054
1. Introduction
Estrogens are among the most important hormones in the female body, which pass through distant organs, interact with multiple organ systems, and play a pivotal role in the physiologic events that occur during a woman’s life [1]. Estrogens are involved in development and maintenance of the female phenotype, germ cell maturation, and pregnancy. They are also important for many other, non-gender specific processes, including growth, nervous system maturation, bone metabolism/remodeling, and endothelial responsiveness.[2, 3]. It has been known that estrogens
play an important role in the maintenance of bone mineral density cognitive and cardiovascular functions. They are also known to impact in developing breast, uterine, or colorectal cancer. [4,5,6,7]. Sex steroid
In the present paper we report the LC-MS/MS method developed and validated for the simultaneous determination of E1 and E2 in human plasma. It was essential to establish an assay capable of quantifying estrogens at concentrations down to 15 pg/ml. At the same time, it was expected that this method would be efficient in analyzing large number of plasma samples obtained for pharmacokinetic, bioavailability or bioequivalence studies after therapeutic doses of estrogens. This method is simple, rapid, robust, sensitive and novel that makes it an attractive procedure in high-throughput bioanalysis for the simultaneous measurement of E1 and E2 [15].
2.Experimental
2.1. Chemicals
The pure substances of Estradiol, Estrone hemidhydrate were procured from the council of Europe, European Pharmacopoeia (Strasbourg, Cedex). Amlodipine besilyate procured from Sigma-Aldrich. Chemical structures are presented in Fig 1. Dansyl chloride was procured from Acros organics (New Jersey, USA). Bovine serum albumin was used as control (Sigma-Aldrich). HPLC grade methanol used for the chromatography (Sigma-Aldrich). Analytical grade sodium hydroxide, sodium hydrogen carbonate was used (Merck, India). Water was deionized using a Milli-Q system from Millipore (Bedford, MA, USA).
O H
H H
H
C H3O H
HO
H H
H
C H3O
Estradiol Estrone
N H
C l O O
O O
C
H3 N H2
C H3 M e O
Amlodipine
2.2. LC-MS/MS apparatus and conditions
The HPLC Alliance HT 2795 series (Waters, USA) is equipped with binary pump, degasser and autosampler with thermostat, thermostated column compartment and control module. The chromatography was on Genesis C18 (5-µm, 50 mm X 4.6 mm i.d.) at 40 ˚C. The mobile phase composition was a mixture of 0.1 % formic acid buffer and methanol in gradient mode, with a flow rate of 0.30 mL/min.
Mass spectrometric detection was performed on ESI triple quadrupole instrument Quattro Premier (Micromass MS technologies, Waters, USA) using multiple reaction monitoring (MRM). Data processing was performed on Quan Lynx 4.0 software package (Waters).
2.3. Sample processing
A 500-µL volume of standards, control and plasma sample was transferred to a 15-mL glass test tube. Added 4-mL aliquot of dichloromethane into each tube using multipette plus (eppendorf, USA). The sample was vortex-mixed for 4 min using Multi-Pulse Vortexer (Glas-Col, Terre Haute, USA). The upper aqueous layer was removed and the remaining organic layer was transferred to a 5-mL glass tube and evaporated to dryness using Turbo Vap LV Evaporator (Zymark, Hopkinton, MA, USA) at 50 ˚C under a stream of nitrogen. Then the residue was dissolved in 200-µL of NaHCO3 (100 mM; pH 10.5). Add
200-µL dansyl chloride solution (1mg/mL in acetone), vortexed and heated for 5 min at 60 ˚C. Added 15 µL of internal standard (2.0 µg/ml), vortexed and 25- µL aliquot was injected into chromatographic system.
2.4. Bioanalytical method validation
2.4.1. Calibration and control samples
Working solutions for calibration and quality control samples were prepared from the stock solution by an adequate dilution using water/methanol (1/1 v/v). The IS
working solution (2.0 µg/ml) was prepared by diluting its stock solution with water/methanol (1/1 v/v).
Quality control samples were prepared as a bulk, at concentration of 10.00 (lower limit of quantitation, LLOQ), 60 pg/mL (low), 540 pg/mL (medium) and 980 pg/mL (high) for E2 and concentrations of the quality control samples for E1 were 10pg/mL (lower limit of quantification, LLOQ), 60pg/mL (low), 540 pg/mL (medium) and 980 (high).
2.4.2. Calibration curve
A calibration curve of E2 and E1 were constructed from a bovine human plasma serum albumin processed without an IS, a zero sample processed with IS and eight non-zero samples covering the total range (10-1080 pg/mL), including lower limit of quantification. Eight samples of each concentration were measured. Linearity was assessed by a weighted (1/x2) least squares regression
analysis. The calibration curve had to have a correlation coefficient (r2) of 0.99 or better. The
acceptance criterion for each back-calculated standard concentration was 15% deviation from the nominal value except LLOQ, which was set at 20%.
2.4.3. Precision and accuracy
The within-batch precision and accuracy was determined by analyzing eight sets of quality control samples in a batch. The between-batch precision and accuracy was determined by analyzing eight sets of seeded quality control samples on three different batches. The quality control samples were randomized daily, processed and analyzed in position either (a) immediately following the standard curve, (b) in the middle of the batch, or (c) at the end of the batch. The acceptance criteria of within-and between-batch precision were 20% or better for LLOQ and 15% or better for the rest of concentrations and the accuracy was 100 ± 20% or better for LLOQ and 100 ± 15% or better for the rest of concentrations.
2.4.4. Recovery
2.4.5. Stability studies
The Bench top stability (at room temperature) of low and high quality control samples were determined by comparing the mean of back-calculated concentrations from the freshly thawed quality control samples with those that were kept on bench top for about 5.0 hours.
The freeze thaw stability of low and high quality control samples were tested with three freezing periods, where the first storage of 12 hr at below -20 °C was followed by two additional periods of 12 to 24 Hrs. The percent degradation was determined by comparing the mean of back-calculated concentrations from the three freeze thaw cycles with that of a freshly thawed quality control samples.
Autosampler stability was assessed by storing the low and high quality control samples in auto sampler (5°C) for 12 hours followed by re-injecting the same samples and comparing the ratio of the mean concentrations.
3.Results and discussion
In the present work LC-MS/MS was used to analyze estrogens, as it is beneficial in developing a selective and sensitive method. [M+H]+ was predominant
ion in the parent spectrum and was used as the precursor ion to obtain product ion spectra. The most sensitive mass transition was from m/z 506.13 to 170.66
for E2 and m/z 504.10 to 170.66 for E1 and m/z 509.12
to 238.23 for the IS. Thus the MRM technique was chosen for the assay development.
3.1. Method development
The functional sensitivity of the earlier LC-MS/MS multiple-reaction monitoring experiments corresponding to underivatized E1 (m/z 269/145) and E2 (m/z 271/145)
Different mobile phases consisting of water-acetonitrile or water-methanol were evaluated to improve HPLC separation and enhance sensitivity in MS. Modifiers such as formic acid and ammonium formate alone or in combination in different concentrations were added. The best signal was achieved using 0.1% formic acid buffer and methanol in gradient mode. The formic acid was found to be necessary in order to lower the pH to protonate the E1 and E2 and thus deliver good peak shape. The percentage of formic acid was optimized to maintain this peak shape whilst being consistent with good ionization and fragmentation in the mass spectrometer.
The tandem mass spectrometer allows the selective detection of substances with varying masses or fragments without chromatographic separation. The development of the chromatographic system was focused on short retention times and coelution of E2, E1 and IS, paying attention to matrix effects as well as good peak shapes. A high proportion of organic solvent (0.1% formic acid/methanol 15/85, v/v) was used to coelute E2 and E1 at retention time of 5.22 and 5.01 min respectively. Flow rate of 3.0 mL/min produced a good peak shape and brought the runtime to 6 min. The method was subjected to specificity and matrix effect to establish the ability of mass spectrometer to separate and quantify the analyte in the presence of endogenous species and co-administered medications.
3.2. Internal standard(IS)
The chromatographic conditions and ionization properties of amlodipine (m/z 509.12/238.23) was found
to match with that of the estrogens and hence was used as internal standard (external method)
3.3. Calibration curves
The calibration curve obtained as described above was suitable for generation of acceptable data for the concentration of the E2 and E1 in the samples during the validation.
Concentrations added (pg/mL)
Concentration found(mean±SEM,
n=8) pg/mL
Precision (%)
Accuracy (%)
10 11.00±0.94 5.0 100.3
20 21.00±2.79 10.1 98.24
40 41.00±4.20 9.0 94.13
120 122±9.40 3.8 113.12
420 388.95±23.85 2.5 104.44
540 543.58±33.05 5.5 67.73
960 950.67±23.81 2.4 101.13
1080 1090.13±42.80 6.4 98.52
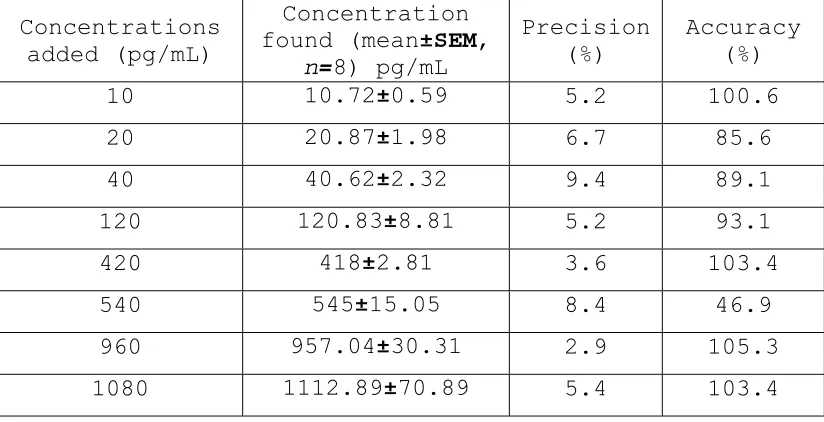
Table 1: Precision and accuracy data of back-calculated concentrations of calibration samples for Estradiol (E2) in human
plasma
Table 2: Precision and accuracy data of back-calculated concentrations of calibration samples for Estrone (E1) in human
plasma
3.4. Specificity
LC-MS/MS analysis of the blank human plasma samples showed the presence of endogenous E2 and E1 and no interference with the IS. Hence the specificity of the method was established by comparing with the spiked
Concentrations added (pg/mL)
Concentration found (mean±SEM,
n=8) pg/mL
Precision (%)
Accuracy (%)
10 10.72±0.59 5.2 100.6
20 20.87±1.98 6.7 85.6
40 40.62±2.32 9.4 89.1
120 120.83±8.81 5.2 93.1
420 418±2.81 3.6 103.4
540 545±15.05 8.4 46.9
960 957.04±30.31 2.9 105.3
bovine serum albumin (control). Representative chromatograms of extracted blank plasma (Fig. 2), demonstrating the specificity and selectivity of the method. No significant interference in the blank plasma traces was seen from endogenous substances in drug- free human plasma at the retention time of the analytes and internal standard. Fig 3 depicts a representative ion-chromatogram for the LLOQ (10 pg/mL) of the calibration curve. Excellent sensitivity was observed for 25- µL injection volume.
min
0.50 1.00 1.50 2.00 2.50
%
0 100
MRM of 3 channels,ES+ 509.13 > 170.77 3.405e+002 MV_057 Smooth(Mn,3x3)
0.85
0.41 1.44 1.66 1.95
min %
0 100
MRM of 3 channels,ES+ 506.13 > 170.66 5.370e+002 MV_057 Smooth(Mn,3x3)
0.86
0.01 1.73 2.40
2.80 min %
0 100
MRM of 3 channels,ES+ 504.1 > 170.66 2.339e+002 MV_057 Smooth(Mn,3x3)
2.36 0.99
0.18 0.33 0.85 1.15 1.48 1.73 2.05
min
0.50 1.00 1.50 2.00 2.50
%
0 100
MRM of 3 channels,ES+ 509.13 > 170.77 1.158e+005 MV_055 Smooth(Mn,3x3)
Istd;1.80;17840.66
min %
0 100
MRM of 3 channels,ES+ 506.13 > 170.66 9.055e+004 MV_055 Smooth(Mn,3x3)
Estradiol 1.81 14233.87
min %
0 100
MRM of 3 channels,ES+ 504.1 > 170.66 1.040e+005 MV_055 Smooth(Mn,3x3)
Estrone 1.88 16045.00
Fig.3. Representative Chromatogram of LLOQ in plasma containing 10 pg/mL of E1, E2 & IS
3.5. Matrix effect
The matrix effects in the LC-MS/MS method were evaluated by spiking bovine albumin serum samples with low and high QC samples. Six independent plasma lots were used with six samples from each lot. Percent nominal concentrations estimated were well within the acceptable limits. Hence the effect of matrix on estimation of drug is negligible.
3.3. Extraction recovery
The extraction recovery of E1 and E2 was 64.1 ± 5.81% on average, and the recovery ranges from 63.01 ± 2.81% to 6.105± 3.84%. With the moderate extraction recovery of E1 and E2, the assay has proved to be robust in high throughput analysis.
3.7. Lowest concentration
Within-batch precision (n=4) Between-batch precision (n=4)
Concentration
added (pg/mL) Concentration found (mean±SEM,
pg/mL
Precision
(%) Accuracy (%)
Concentration found (mean±SEM)
pg/mL
Precision
(%) Accuracy (%)
10.00 10.83±2.72 3.6 93.5 10.84±1.82 5.5 98.23
60.00 58.34±6.80 4.7 98.8 62.85±3.22 4.9 102.8
540.00 543.45±12.66 2.7 102.3 546.96±29.12 8.7 98.7
980.00 975.54±24.48 1.6 98.6 969.68±38.15 9.3 94.7
Table 3: Precision and accuracy of the LC-MS/MS method for determining Estradiol concentration in plasma samples
Table 4: Precision and accuracy of the LC-MS/MS method for determining estrone concentration in plasma sample Within-batch precision (n=4) Between-batch precision (n=4)
Concentration
added (pg/mL) Concentration found (mean±SEM,
pg/mL
Precision (%)
Accuracy (%)
Concentration found (mean±SEM)
pg/mL
Precision (%)
Accuracy (%)
10.00 10.21±26.60 9.5 91.7 10.29±1.88 9.2 106.7
60.00 63.43±16.94 8.5 92.4 62.40±3.06 8.4 96.3
540.00 533.04±30.00 5.2 107.3 527.85±43.75 6.4 98.3
3.8. Middle and upper concentrations
The middle and upper quantification levels of E1 and E2 ranged from 540 to 980 pg/mL in human plasma. For the between-batch experiment, the precision ranged from 5.3 to 6.7% and the accuracy ranged from 96.7 to 104.7% (Table 4, 5). For the within-batch experiment, the precision and accuracy for the analyte met the acceptance criteria (<±15%) and precision was below 8.6% at all concentrations tested.
3.9. Stability
The stability of the stock solutions were determined by comparing the mean of the area responses obtained from 6 replicate analysis of aqueous standard (540 pg/mL for E2 & E1) after 7.0 hours. Ratio of means of area was 97.15% for drug and 99.15% for metabolite respectively which is within the acceptance range of 90 – 110%.
The stability of the stock solution of amlodipine was determined by comparing the mean of the area responses obtained from 6 replicate analysis of aqueous standard after 9.0 hours. Ratio of means of area was 100.9 %, which is within the acceptance range of 90 – 110%.
Sample concentration (pg/mL) (n=6)
Concentration found (Mean±SEM)
(pg/mL)
Precision (%)
Accuracy (%) Bench top stability (11h)
60.00 60.41±0.65 2.6 95.47
980.00 963.65±40.25 5.7 105.2
Freeze thaw stability (after 3 cycles)
60.00 68.08±6.16 5.7 90.9
980.00 966.07±12.28 6.3 105.4
Autosampler stability (28 h)
60.00 59.05±2.06 3.7 96.8
98.00 986.23±23.69 7.9 98.6
Table 5: Stability of human plasma samples of Estradiol (E2)
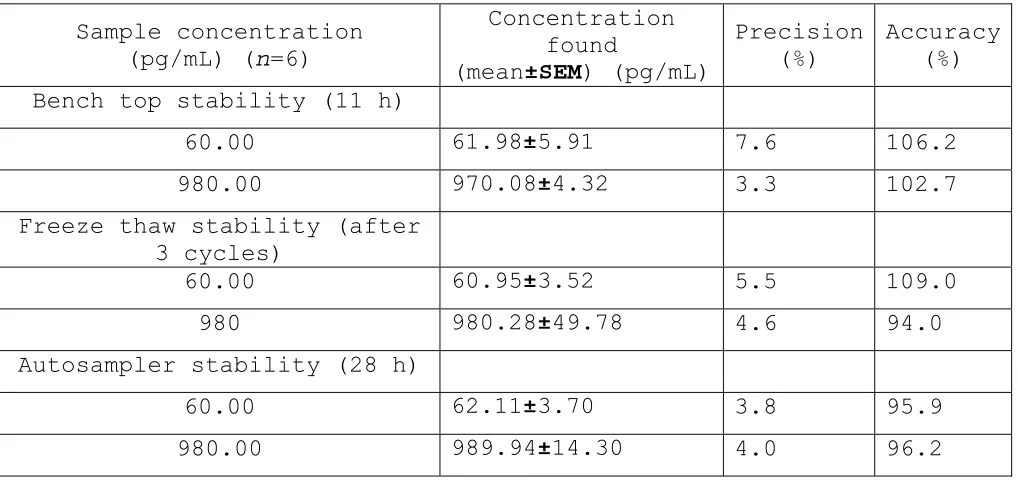
Sample concentration (pg/mL) (n=6)
Concentration found
(mean±SEM) (pg/mL)
Precision (%)
Accuracy (%) Bench top stability (11 h)
60.00 61.98±5.91 7.6 106.2
980.00 970.08±4.32 3.3 102.7
Freeze thaw stability (after 3 cycles)
60.00 60.95±3.52 5.5 109.0
980 980.28±49.78 4.6 94.0
Autosampler stability (28 h)
60.00 62.11±3.70 3.8 95.9
980.00 989.94±14.30 4.0 96.2
Table 6: Stability of human plasma samples of Estrone (E1)
96.8% and 98.6% for E2 and 95.9% & 96.2% for E1 respectively. This was within the acceptance range of 90 – 110%.
Differences in responses of spiked standards at time 0 h and after 28 h for E1 and E2 were less than 5%. The significance was defined if the percent change in response between 0 and 24 h is more than 9%. Therefore, the differences in responses were not significant, indicating the stability of E2 and E1 at room temperature upto 25 h. Further, the analyte was found to be stable after reconstitution in diluent for at least 12 h at 4 ˚C. The re-injection reproducibility was established to determine if an analytical batch could be reanalyzed in case of an unexpected delay in analyses. The same set of QC samples were repeated after the analysis with a 3 h gap between, during which the samples were stored at 4 ˚C, and in all cases the deviations were less than 15%. On similar lines, stability of the extracted dry residues was also established to be over 24 h (deviations observed <10%). In addition, the stock solutions of E1 and E2 and IS were also found to be stable for at least 3 months at 4
˚C.
The Bench top stability (at room temperature) of low and high quality control samples were determined by comparing the mean of back-calculated concentrations of E2 & E1 from the freshly thawed quality control samples with those that were kept on bench top for about 11.0 hours. The ratios of means of the concentrations for the low and high QCs were 95.47% & 105.2% for E2 and 102.7% & 100.02% for E1 respectively. This was within the acceptance range of 90 – 110%.
4. Conclusions
extraction and simultaneous quantification of estrone and estadiol make it an attractive procedure in the bioanalysis of estrogens. The validated method allows the quantitation of estrogen in the 10-1080 pg/mL range.
5. Acknowledgement
This work was supported by Dr. Shivaprakash Rathnam and other colleagues of Synchron research Services Pvt. Ltd, Ahmedabad, for their kind support in managing the study.
6. References
1.Ruggiero RJ and Likis FE. Estrogen: physiology, pharmacology, and Formulations for replacement therapy. J Midwifery Womens Health 2002;47:130–8 2.Arora S, Jain A, Chitra R. Effects of Short-Term
Hormone Replacement on Atherogenic Indices in Indian Postmenopausal Women. Indian Journal of Clinical Biochemistry 2006;21(1):41-7
3.Mhyre AJ, Dorsa DM. Estrogen Activates Rapid Signaling in the Brain: Role of Estrogen Receptor α And Estrogen Receptor β In Neurons and Glia. Neuroscience 2006;138:851–58
4.Nelson RE, Grebe SK, O’Kane DJ, and Singh RJ. Liquid Chromatography–Tandem Mass Spectrometry Assay for Simultaneous Measurement of Estradiol and Estrone in Human Plasma. Clinical chemistry 2004;50(2):373-84.
5.Yasui T, Uemura H, Tezuka M, Yamada M, Irahara M, Miura M, et al. Biological effects of hormone replacement therapy in relation to serum estradiol levels. Horm Res 2001;56:38–44.
6.Ettinger B, Pressman A, Sklarin P, Bauer DC, Cauley JA, Cummings SR. Association between low levels of serum estradiol, bone density, and fractures among elderly women: the study of osteoporotic fractures. J Clin Endocrinol Metab 1998;83:2239–43.
7.Amin S, Zhang Y, Sawin CT, Evans SR, Hannan MT, Kiel DP, et al. Association of hypogonadism and estradiol levels with bone mineral density in elderly men from the Framingham Study. Ann Intern Med 2000;133:951–63.
and other known risk factors for breast cancer in post-menopausal Chinese women. Cancer Causes and Control 2004;15: 305–11.
9.Maffei S, Mercuri A, Zucchelli GC and Vassalle C. Estrogen therapy effects on different vasoactive factors in recent postmenopausal healthy women. Int J Cardiol 2006;107:194-9
10. Effects of Conjugated Equine Estrogen in Postmenopausal Women with Hysterectomy the Women’s Health Initiative Randomized Controlled Trial. JAMA 2004;291:1701-12
11. Bidlingmaier F., Wagner-Barnack M., Butenandt 0., Knorr D. Plasma estrogens in childhood and puberty under physiologic and pathologic conditions. Pediatr Res. 1973;7:901 -7
12. Carlstrom K. Low endogenous estrogen levels- analytical problems and tissue sensitivity, Acta Obstet Gynecol Scand. 1996;Suppl 163:11-15.
13. Schairer C., Lubin J., Troisi A., Sturgeon S., Brinton L., Hoover R. Menopausal estrogen and estrogen-progestin replacement therapy and breast cancer risk, JAMA 2000;283:485-91.
14. D.C. Smith, R. Prentice, D.J. Thompson, W.L. Herrmann.
Association of exogenous estrogen and endometrial carcinoma, N Engi J Med. 293;1975:1164-7.