Diboson production
D.L.Evans1,a
On behalf of the ATLAS, CMS, CDF and DØ Collaborations
1University of California, San Diego (UCSD)
9500 Gilman Drive #0319, La Jolla, CA 92093-0319 USA
Abstract.Measurements of diboson production cross sections in pp collisions at the LHC at a centre of mass
energy √s=7 and 8 TeV, and in p¯p collisions at the Tevatron at √s=1.96 TeV are reviewed and compared
with standard model predictions. Limits on charged and neutral anomalous triple gauge couplings extracted from the selected diboson event samples are also compared.
1 Introduction
The measurement of diboson production provides an im-portant test of the standard model (SM), with any signifi-cant deviation from the measured cross sections giving an indication of new physics. In the SM, diboson production proceeds principally through the quark anti-quark annihi-lation process, shown in Figure 1. Triple gauge boson cou-plings (TGC) in the s-channel production mode are sensi-tive to new physics at a higher mass scale, which could change both the production rate and kinematics. In ad-dition, measurements of diboson production are essential for an accurate estimate of irreducible backgrounds to the newly discovered resonance [1, 2] in the diboson decay modes.
Figure 1. Diboson production in the t-channel (left) and
s-channel (right).
Several recent results have been presented at this con-ference, using p¯p collision data from the Tevatron at a cen-tre of mass energy √s=1.96 TeV, and in pp collisions at
√
s = 7 and 8 TeV at the LHC. Cross section measure-ments are described in Section 2 and limits on anomalous triple gauge couplings are compared in Section 3.
ae-mail: [email protected]
2 Cross Section Measurements
2.1 WγandZγfinal states
From the various diboson processes that can be produced at hadron colliders, the Wγ and Zγfinal states have the highest yields, next toγγproduction. The presence of ei-ther a W or Z boson improves the suppression of back-ground processes, thus allowing stringent checks of the electroweak sector to be performed in these final sates.
Events are selected in the Wγ final state by requir-ing the presence of an electron or muon (`), and missing transverse energy Emiss
T from the undetected neutrino, in
addition to a photon. To suppress the contribution from fi-nal state radiation photons, measurements are reported for
∆R(`, γ)= pdη2+dφ2>0.7. The dominant background
comes from W+jets events, where the jet is misidentified as a photon.
The ATLAS and CMS collaborations have performed measurements ofσ(pp→Wγ) at a centre of mass energy of √s=7 TeV, by using datasets corresponding to an in-tegrated luminosity of 1.02 fb−1 and 5 fb−1 respectively. The ATLAS measurement of the inclusive cross section is 4.60±0.11 (stat.)±0.64 (syst.) pb for photonpT>15 GeV
in an extended fiducial region, corresponding to the NLO SM prediction of 3.70±0.28 pb [3]. The extended fiducial region requires the lepton and neutrino transverse momen-tum, pT, to be above 25 GeV, and the lepton to be within
pseudorapidity,|η|<2.47, to emulate the experimental se-lection. The CMS collaboration has presented new results for this conference, measuring the inclusive cross section to be 37.0±0.8 (stat.)±4.0 (syst.)±0.8 (lumi.) pb, to be compared with the NLO SM prediction of 31.81±1.8 pb for photonpTabove 15 GeV[4]. The CDF and DØ
collab-orations have performed measurements ofσ(p¯p → Wγ) by analysing datasets corresponding to an integrated lu-minosity of 1 fb−1 and 4.2 fb−1 respectively. The CDF
DOI: 10.1051/
C
Owned by the authors, published by EDP Sciences, 2013 epjconf 201/ 34908002
collaboration measured 7.36±0.35 (stat.)±0.75 (syst.)±
0.43 (lumi.) pb to be compared with the NLO SM pre-diction for photons with pT above 15 GeV and|η| < 2.0
of 8.2 ± 0.6 pb [5]. The DØ collaboration measured 7.6±0.6 (stat.)±0.6 (syst.) pb to be compared with the NLO SM prediction of 7.6±0.2 pb for photons with pT
above 15 GeV [6]. These results are compared in Figure 2.
Figure 2. Summary of Wγcross section measurements
com-pared to standard model predictions.
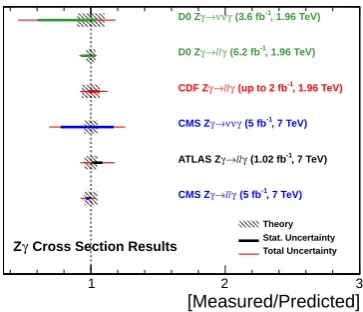
In the Zγ analyses, events are selected by requiring a same flavor, opposite sign electron or muon pair (``) with an invariant mass M`` close to the Z boson mass, in addition to a photon. The ATLAS collaboration has measured the inclusive σ(pp → Zγ) cross section of 1.29±0.05 (stat.)±0.15 (syst.) pb to be compared with the NLO SM prediction of 1.23±0.06 pb in the extended fiducial region [3]. The CMS collaboration has mea-sured an inclusive cross section of 5.33±0.08 (stat.)±
0.25 (syst.)±0.12 (lumi.) pb to be compared with the NLO SM prediction of 5.45 ±0.27 pb [4] for photon
pT >15 GeV andM`` >50 GeV. The CDF collaboration
has measured the inclusiveσ(p¯p → Zγ) cross section of 4.6±0.2 (stat.)±0.3 (syst.)±0.4 (lumi.) pb to be compared with the NLO SM prediction of 4.5±0.4 pb in the fiducial region with photonpTabove 7 GeV and a dilepton
invari-ant mass of at least 40 GeV [7]. The DØ collaboration measured 288±15 (stat.)±11 (syst.) fb to be compared to the theoretical prediction of 294±10 (PDF)+1
−2(scale) fb,
with a requirement ofM``γ >110 GeV [8]. These results are compared in Figure 3.
The first measurement of Zγproduction in theννγ fi-nal state in pp collisions at √s=7TeV has been presented by the CMS collaboration, using a dataset corresponding to an integrated luminosity of 5 fb−1. This measurement is challenging because of large backgrounds from jets misidentified as photons, and instrumental sources such as beam-gas interactions. The Zγproduction cross section is measured to be 21.3±4.2 (stat.)±4.3 (syst.)±0.5 (lumi.) fb, where the photon is required to have |η| < 1.4 and
ET > 145 GeV, in agreement with the SM prediction of
21.9±1.1 fb [9]. A previous measurement in this final
Figure 3.Summary of Zγcross section measurements compared
to standard model predictions.
state at √s = 1.96 TeV in p¯p collisions was also pre-sented. The DØ collaboration measured a cross section of 32±9(stat.+syst.±2 (lumi.) fb to be compared with the NLO SM prediction of 39±4 fb for photon pT above
90 GeV [10]. These results are also compared in Figure 3.
2.2 WWandWZfinal states
The ATLAS and CMS collaborations have measured the WW production cross section in the fully leptonic (`ν`ν) final state at √s = 7 TeV, by using datasets correspond-ing to 4.6 fb−1and 4.92 fb−1respectively. CMS has also measured the production cross section in this final state at √s=8 TeV corresponding to an integrated luminosity of 3.54 fb−1. The SM background sources to the W+W− event sample in the `ν`νfinal state include Wγ(∗), top-quark (t¯t and tW), Z/γ∗→`+`−, and diboson (WZ and ZZ)
production, as well as W+jets and QCD multijet events, where at least one of the jets is misidentified as a lepton. The Z/γ∗→`+`− background is suppressed by requiring
largeEmiss
T and dileptonpT, and the W+jets background
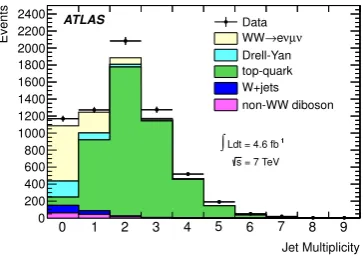
is reduced by using stringent lepton identification and iso-lation requirements. The jet multiplicity distribution in the ATLAS event sample with two leptons of different flavor is shown in Figure 4. To minimise the contribution from the top-quark background, events containing jets are rejected. This leads to a significant theoretical uncertainty in the jet veto efficiency.
The ATLAS and CMS measurements ofσ(pp→WW) at √s = 7 TeV are 51.9 ± 2.0 (stat.) ±3.9 (syst.)±
2.0 (lumi.) pb and 52.4 ± 2.0 (stat.) ± 4.5 (syst.) ±
1.2 (lumi.) pb, respectively [11] [12]. Both measure-ments are in agreement with the NLO SM prediction of 47.0 pb [13]. The CMS measurement at √s = 8 TeV is 69.9±2.8 (stat.)±5.6 (syst.)±3.1 (lumi.) pb, correspond-ing to the NLO SM prediction of 57.3+2.4
−1.6 pb [14]. The
difference between the measured and theoretical value is (22±13)% of the theoretical value.
The ATLAS, CMS, and DØ collaborations have also measured the total cross section of WW+WZ
produc-[Measured/Predicted]
1 2 3
, 1.96 TeV)
-1
(3.6 fb
γ ν ν → γ
D0 Z
, 1.96 TeV)
-1
(6.2 fb
γ ll → γ
D0 Z
, 1.96 TeV) -1 (up to 2 fb
γ ll → γ
CDF Z
, 7 TeV) -1 (5 fb
γ ν ν → γ
CMS Z
, 7 TeV)
-1
(1.02 fb
γ
ll
→ γ
ATLAS Z
, 7 TeV) -1 (5 fb
γ
ll
→ γ
CMS Z
Cross Section Results γ
Z
Theory Stat. Uncertainty Total Uncertainty
[Measured/Predicted]
1 2 3
, 1.96 TeV)
-1
(4.2 fb
γ ν l → γ
D0 W
, 1.96 TeV) -1 (1 fb
γ ν l → γ
CDF W
, 7 TeV)
-1
(1.02 fb
γ ν
l
→ γ
ATLAS W
, 7 TeV) -1 (5 fb
γ ν
l
→ γ
CMS W
Cross Section Results γ
W
Figure 4. Comparison between the ATLAS WW →eνµνdata and simulation for the jet multiplicity before the jet veto require-ment.
tion by selecting events in the semi leptonic (`νj j) de-cay mode where one W boson dede-cays leptonically and the other boson (W or Z) decays hadronically. This de-cay mode has a higher branching fraction compared to the fully leptonic mode, at the expense of introducing a larger background from W+jets events. The ATLAS and CMS measurements used datasets corresponding to an in-tegrated luminosity of 4.7 fb−1and 5 fb−1at √s=7 TeV, and the DØ measurement used a dataset corresponding to 4.3 fb−1. ATLAS measured σ(pp → (WW+WZ)) to be 72 ±9 (stat.)±15 (syst.)±13(MC stat.) pb us-ing a dataset correspondus-ing to 4.7 fb−1, consistent with
the SM expectation of 63.4 ±2.6 pb. CMS measured 68.9±8.7 (stat.)±9.7 (syst.)±1.5 (lumi.) pb [15]. The DØ collaboration measuredσ(p¯p → (WW+WZ)) to be 19.6+−33..20 pb, compared with the NLO SM prediction of 15.2±0.85 pb [16].
Measurements of WZ production in the fully leptonic (`ν``) final state have high purity after requiring three high
pTleptons, two of which are same flavor and have an
in-variant mass close to the Z boson, and largeEmiss
T from the
W decay. Because the branching ratio to this final state is smaller, these measurements are dominated by the statisti-cal uncertainty in the selected event sample. The ATLAS and CMS collaborations have performed measurements of
σ(pp → WZ) at √s =7 TeV by analysing datasets cor-responding to an integrated luminosity of 4.6 fb−1 and 1 fb−1 respectively. ATLAS measured a total cross sec-tion of 19.0+−11..43 (stat.)±0.9 (syst.)±0.4 (lumi.) pb com-pared with the NLO SM prediction of 17.6+−11..10 pb for the dilepton invariant mass range 66 < M`` < 116 GeV for Z → `` [17]. CMS measured a total cross sec-tion of 17.0 ±2.4 (stat.)±1.1 (syst.)±1.0 (lumi.) pb, which agrees well with an NLO SM prediction of 19.790±
0.088 pb [18]. The CDF and DØ measurements of
σ(p¯p → WZ) are 3.94+0.60 −0.53 (stat.)+
0.59
−0.46 (syst.) pb, and
4.50±0.61 (stat.)+−00..1625(syst.) pb for 60<M``<120 GeV,
in datasets corresponding to 7.2 fb−1and 8.6 fb−1 respec-tively [19] [20]. The CDF measurement is in good agree-ment with the NLO SM prediction of 3.50±0.21 pb, and the DØ measurement is slightly larger than, but still con-sistent with the NLO SM prediction of 3.21±0.19 pb.
Figure 5.Summary of WW and WZ cross section measurements
compared to standard model predictions.
These results are displayed graphically, compared with standard model predictions in Figure 5.
2.3 ZZfinal state
Measurements of ZZ production have been performed in the clean, but statistically limited four-lepton (`+`−`+`−) final state by the ATLAS, CMS, CDF and DØ collabora-tions. Because the branching ratio for this final state is small, the precision of the measurements can be improved by combining with higher branching ratio final states in which one of the Z bosons decays either invisibly or toτ leptons.
The ATLAS collaboration measured σ(pp → ZZ) 6.7±0.7 (stat.)−+00..43 (syst.)±0.3 (lumi.) pb, by combin-ing the four-lepton results with a measurement where of the Z bosons decays invisibly in the dilepton+EmissT fi-nal state, both using a dataset corresponding to 4.6 fb−1at
√
s=7 TeV. This result is consistent within uncertainties with the NLO SM prediction of 5.89+0.22
−0.18pb in the fiducial
region 66<M``<106 GeV [21]. The CMS collaboration
measured 6.24+0.86 −0.80 (stat.)+
0.41
−0.32 (syst.)±0.14 (lumi.) pb in
the fiducial region 60 < M`` < 120 GeV, including both four-lepton events and those where the second Z boson de-cays toτleptons. This result is consistent with the NLO SM prediction of 6.3±0.4 pb [22].
ATLAS measured 9.3+1.1
−1.0 (stat.)+ 0.4
−0.3 (syst.) ±
0.3 (lumi.) pb in the four-lepton final state by using a dataset corresponding to 5.8 fb−1 at √s = 8 TeV . This measurement is in agreement with the NLO SM prediction of 7.4±0.4 pb in the fiducial region where the leading lepton has pT > 25 GeV, the invariant mass
of both opposite-sign same-flavor lepton pairs is between 66< M`` <106 GeV and electrons (muons) are required to be in |η| < 2.47 (2.50) [23]. CMS has measured 8.4±1.0 (stat.)±0.7 (syst.)±0.4 (lumi.) pb using a dataset corresponding to 5.26 fb−1, including both four-lepton and two lepton twoτevents, to be compared with the the NLO SM prediction of 7.7±0.4 pb in the fiducial region 60<M``<120 GeV [14].
[Measured/Predicted]
1 2 3
, 1.96 TeV)
-1
(4.3 fb
jj ν l →
D0 W(W/Z)
, 1.96 TeV)
-1
(8.6 fb
ν lll' →
D0 WZ
, 1.96 TeV) -1 (7.1 fb
ν lll' →
CDF WZ
, 7 TeV) -1 (5.0 fb
jj
ν
l
→
CMS W(W/Z)
, 7 TeV)
-1
(4.7 fb
jj
ν
l
→
ATLAS W(W/Z)
, 7 TeV) -1 (1.09 fb
ν
lll'
→
CMS WZ
, 7 TeV)
-1
(4.6 fb
ν
lll'
→
ATLAS WZ
, 8 TeV) -1 (3.54 fb
ν
l
ν
l
→
CMS WW
, 7 TeV) -1 (4.92 fb
ν
l
ν
l
→
CMS WW
, 7 TeV)
-1
(4.6 fb
ν
l
ν
l
→
ATLAS WW
W(W/Z) Cross Section Results
Figure 6.Summary of ZZ cross section measurements compared to standard model predictions.
The CDF and DØ collaborations measured
σ(p¯p→ZZ) by using datasets corresponding to 6 fb−1 and up to 8.6 fb−1 respectively. Both measurements are combinations of results in the four-lepton and two lepton
+Emiss
T final states. CDF measured 1.64+ 0.44
−0.38(stat + syst)
pb, which is consistent with the NLO SM prediction of 1.4 ± 0.1 pb [24]. Equivalently, DØ measured 1.44+−00..3128(stat.)±+−00..1719 (syst.) pb [20].
The ZZ cross section measurements are summarised in comparison with the relevant theoretical predictions in Figure 6.
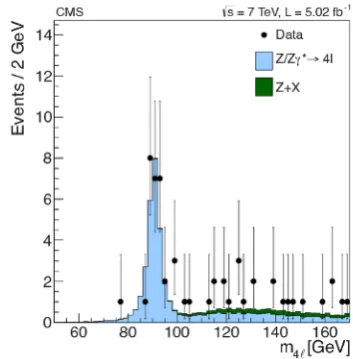
The CMS collaboration has performed the first obser-vation of Z →4`decays in pp collisions at √s =7 TeV, by analysing a dataset corresponding to an integrated lu-minosity of 5.02±0.11 fb−1. The signal, shown in
Fig-ure 7, was observed with a statistical significance of 9.7σ [25]. The measured branching fraction isB(Z → 4`) =
4.2+−00..98(stat.)±0.2(syst.)×10−6, in agreement with the SM prediction of 4.45×10⁻⁶. The measured cross sec-tion times branching fracsec-tion isσ(pp→ Z)B(Z→ 4`)= 112−+2320(stat.)−+57(syst.)+−32(lumi.), which is also in agreement with the SM prediction of 120 fb−1. These measurements
were performed with the four-lepton invariant mass re-stricted to 80 < m4` < 100 GeV and the two-lepton
in-variant mass restricted to m`` > 4 GeV for all pairs of
leptons. In addition, because the Z → 4`gives a narrow resonant peak in the four-lepton invariant mass distribu-tion, this channel can be used to calibrate the four-lepton mass scale and lowpTlepton identification efficiencies for
Higgs boson measurements in the ZZ→4`decay mode.
3 Limits on anomalous triple gauge
couplings
Diboson production is sensitive to triple gauge couplings in the s-channel production modes. Deviations of the triple gauge couplings from the SM values are referred to as anomalous triple gauge couplings (aTGC), which are pa-rameterised by adding terms to the SM Lagrangian. The presence of aTGC will modify both the production rate
Figure 7.Four-lepton invariant mass distribution for events
pass-ing all selection requirements except that onm4`. The data are
shown by points. The filled histograms represent SM
expecta-tions for pp→Z/Zγ?→4`and for reducible backgrounds. The
three final states, 4e, 4µ, and 2e2µare combined.
and kinematics from SM expectations. To prevent the total production cross section violating unitarity, a form factor is introduced to turn offthe effect of each parameter above a cut offscaleΛ. As the experimental sensitivity to aTGC increases, so does the scale at which unitarity violation would occur for permitted aTGC values.
Experimental measurements have been made by the ATLAS, CMS, CDF and DØ collaborations, leading to limits on charged and neutral aTGC. These limits are now summarised and compared.
4 Charged couplings
For the WWγvertex, the aTGC parameters are chosen to beλγand∆κγ=κγ−1, which are zero in the SM [26]. By using the photonpTspectrum in the Wγfinal state, CMS,
ATLAS,and DØ have set limits on aTGC in the WWγ ver-tex [4], [3] [6]. ATLAS and CMS have set limits by us-ing the leadus-ing lepton pT in the fully leptonic WW final
state, which is also sensitive to the WWγvertex [11] [27]. By exploiting the higher branching ratio semi leptonic fi-nal state, CMS has set stringent limits from the dijet pT
spectrum [15]. These results are summarised graphically in Figure 8. The LHC measurements are now almost the most stringent, with LEP still providing more stringent limits on∆κγ[28].
The aTGC parameters for the WWγand WWZ ver-tices are chosen to be ∆gZ
1 = g
Z
1 −1, ∆κZ = κZ −1,
∆κγ =κγ−1,λZandλγ, which are zero in the SM [29]. In
the LEP parameterisation,∆κZ = ∆gZ1−∆κγ·tan2θW[30].
Limits have been set by the ATLAS, CMS, CDF and DØ collaborations [17] [27] [19] [31]. The recent DØ results include the combination of the Wγ, WW and WZ final states to increase sensitivity. The results are compared in Figure 9. No deviation from the SM is observed.
[Measured/Predicted]
1 2 3
, 1.96 TeV)
-1
(up to 8.6 fb
ν ν ll
+
lll'l' →
D0 ZZ
, 1.96 TeV) -1 (6 fb
ν ν ll
+
lll'l' →
CDF ZZ
, 7 TeV)
-1
(4.7 fb
ν ν
ll
+
lll'l'
→
ATLAS ZZ
, 7 TeV) -1 (5.02 fb
lll'l'
→
CMS ZZ
, 8 TeV)
-1
(5.8 fb
lll'l'
→
ATLAS ZZ
, 8 TeV) -1 (5.26 fb
lll'l'
→
CMS ZZ
ZZ Cross Section Results
0 0.5
)
∞
=
Λ
, 7 TeV, -1 (5.0 fb γ CMS W ) ∞ = Λ
, 7 TeV,
-1 (1.02 fb γ ATLAS W =2TeV) Λ
, 7 TeV,
-1 (1.02 fb γ ATLAS W =2TeV) Λ
, 1.96 TeV,
-1 (4.2 fb γ D0 W ) ∞ = Λ
, 7 TeV, -1 CMS WW (36 pb
)
∞
=
Λ
, 7 TeV,
-1
ATLAS WW (4.6 fb
)
∞
=
Λ
, 7 TeV, -1 CMS W(W/Z) (5.0 fb
LEP
γ
λ
0 1 2 3
)
∞
=
Λ
, 7 TeV, -1 (5.0 fb γ CMS W ) ∞ = Λ
, 7 TeV,
-1 (1.02 fb γ ATLAS W =2TeV) Λ
, 7 TeV,
-1 (1.02 fb γ ATLAS W =2TeV) Λ
, 1.96 TeV,
-1 (4.2 fb γ D0 W ) ∞ = Λ
, 7 TeV, -1 CMS WW (36 pb
)
∞
=
Λ
, 7 TeV,
-1
ATLAS WW (4.6 fb
)
∞
=
Λ
, 7 TeV, -1 CMS W(W/Z) (5.0 fb
LEP
γ
κ ∆
Figure 8. Summary of limits on anomalous WWγtriple gauge
couplings measured in the Wγand WW final states.
0 0.5
) ∞ = Λ , 7 TeV, -1 (4.6 fb ll ν l → ATLAS WZ =2.0) Λ
, 1.96 TeV,
-1 (7.1 fb ll ν l → CDF WZ ) ∞ = Λ
, 7 TeV,
-1 (36 pb ν l ν l → CMS WW ) ∞ = Λ , 7 TeV, -1 (4.6 fb ν l ν l → ATLAS WW ) ∞ = Λ
, 7 TeV,
-1 (5.0 fb jj ν l → CMS W(W/Z) =2.0) Λ
, 1.96 TeV, -1 D0 comb. (up to 8.6 fb
Z λ
0 1 2
) ∞ = Λ , 7 TeV, -1 (4.6 fb ll ν l → ATLAS WZ =2.0) Λ
, 1.96 TeV,
-1 (7.1 fb ll ν l → CDF WZ ) ∞ = Λ
, 7 TeV,
-1 (36 pb ν l ν l → CMS WW ) ∞ = Λ , 7 TeV, -1 (4.6 fb ν l ν l → ATLAS WW ) ∞ = Λ
, 7 TeV,
-1 (5.0 fb jj ν l → CMS W(W/Z) =2.0) Λ
, 1.96 TeV, -1 D0 comb. (up to 8.6 fb
Z 1 κ ∆
0 0.5 1 1.5
) ∞ = Λ , 7 TeV, -1 (4.6 fb ll ν l → ATLAS WZ =2.0) Λ
, 1.96 TeV,
-1 (7.1 fb ll ν l → CDF WZ ) ∞ = Λ
, 7 TeV,
-1 (36 pb ν l ν l → CMS WW ) ∞ = Λ , 7 TeV, -1 (4.6 fb ν l ν l → ATLAS WW =2.0) Λ
, 1.96 TeV, -1 D0 comb. (up to 8.6 fb
Z 1
g
∆
Figure 9. Summary of limits on anomalous WWγand WWZ
triple gauge couplings measured in the Wγ, WW and WZ final
states.
4.1 Neutral couplings
The aTGC parameters for the ZVγvertex, where V=Z or
γ, are chosen to behV3 andhV4 [32]. Limits have been set by both ATLAS and CMS, CDF and DØ, by using the photon
pTspectrum in the Zγfinal state [3] [9] [7] [8]. In new
re-sults presented at this conference, the CMS collaboration are able to improve the limit by combining the results from
0 0.5 -3 10 × ) ∞ = Λ , 7 TeV,
-1 (1.02 fb γ ll ATLAS ) ∞ = Λ
, 7 TeV,
-1 (5.0 fb γ ll CMS ) ∞ = Λ
, 7 TeV,
-1 (5.0 fb γ ν ν + γ ll CMS Z 4 h -3
< 1.3) x 10
Z 4
D0 (1.3 < h -3
< 0.9) x 10
Z 4
CDF (0.9 < h
0 0.5 -3 10 × ) ∞ = Λ , 7 TeV,
-1 (1.02 fb γ ll ATLAS ) ∞ = Λ
, 7 TeV,
-1 (5.0 fb γ ll CMS ) ∞ = Λ
, 7 TeV,
-1 (5.0 fb γ ν ν + γ ll CMS γ 4 h -3
< 1.4) x 10
γ
4
D0 (1.4 < h -3
< 0.8) x 10 γ
4
CDF (0.8 < h
0 0.05 0.1
=1.5)
Λ
, 1.96 TeV,
-1
(~ 5 fb
γ ν ν + γ ll CDF =1.5) Λ
, 1.96 TeV,
-1
(up to 7.2 fb
γ ν ν + γ ll D0 ) ∞ = Λ , 7 TeV,
-1 (1.02 fb γ ll ATLAS ) ∞ = Λ
, 7 TeV,
-1 (5.0 fb γ ll CMS ) ∞ = Λ
, 7 TeV,
-1 (5.0 fb γ ν ν + γ ll CMS Z 3 h
0 0.05 0.1
=1.5)
Λ
, 1.96 TeV,
-1
(~ 5 fb
γ ν ν + γ ll CDF =1.5) Λ
, 1.96 TeV,
-1
(up to 7.2 fb
γ ν ν + γ ll D0 ) ∞ = Λ , 7 TeV,
-1 (1.02 fb γ ll ATLAS ) ∞ = Λ
, 7 TeV,
-1 (5.0 fb γ ll CMS ) ∞ = Λ
, 7 TeV,
-1 (5.0 fb γ ν ν + γ ll CMS γ 3 h
Figure 10. Summary of the limits on anomalous ZZγand Zγγ
triple gauge couplings measured in the Zγfinal state.
the``γandννγfinal states. The results, which agree with SM expectations, are summarised in Figure 10.
The aTGC parameters for ZZ production are chosen to be hV4 and f5V, which are zero in the SM [33]. This final state is unique in providing access to the ZZZ cou-pling. No evidence of aTGC is found, so limits have been set. ATLAS has improved on its previous result [34] by a factor of around five in new results presented at this con-ference, by increasing the size of the dataset used, adding the dilepton+Emiss
T final state, and by using the Z boson
pT spectrum instead of performing a single counting
ex-periment [21]. The CMS limits are set by using the four-lepton invariant mass distribution [22]. These results are compared in Figure 11.
5 Conclusion
0 0.2 0.4
)
∞
=
Λ
, 7 TeV,
-1
(1.02 fb
lll'l'
→
ATLAS ZZ
)
∞
=
Λ
, 7 TeV,
-1
(4.6 fb
ν ν
ll
+
lll'l'
→
ATLAS ZZ
)
∞
=
Λ
, 7 TeV,
-1
(5.02 fb
lll'l'
→
CMS ZZ
γ
50
f
0 0.2 0.4
)
∞
=
Λ
, 7 TeV,
-1
(1.02 fb
lll'l'
→
ATLAS ZZ
)
∞
=
Λ
, 7 TeV,
-1
(4.6 fb
ν ν
ll
+
lll'l'
→
ATLAS ZZ
)
∞
=
Λ
, 7 TeV,
-1
(5.02 fb
lll'l'
→
CMS ZZ
γ
40
f
0 0.2 0.4
)
∞
=
Λ
, 7 TeV,
-1
(1.02 fb
lll'l'
→
ATLAS ZZ
)
∞
=
Λ
, 7 TeV,
-1
(4.6 fb
ν ν
ll
+
lll'l'
→
ATLAS ZZ
)
∞
=
Λ
, 7 TeV,
-1
(5.02 fb
lll'l'
→
CMS ZZ
Z 50
f
0 0.2 0.4
)
∞
=
Λ
, 7 TeV,
-1
(1.02 fb
lll'l'
→
ATLAS ZZ
)
∞
=
Λ
, 7 TeV,
-1
(4.6 fb
ν ν
ll
+
lll'l'
→
ATLAS ZZ
)
∞
=
Λ
, 7 TeV,
-1
(5.02 fb
lll'l'
→
CMS ZZ
Z 40
f
Figure 11. Summary of the limits on anomalous ZZZ and ZZγ
triple gauge couplings measured in the Zγfinal state.
6 Acknowledgments
It is my pleasure to thank to the local committee for or-ganising and hosting this interesting conference in Kyoto, and my colleagues from the ATLAS, CMS, CDF and DØ collaborations for their hard word in producing the results presented here.
References
[1] S. Chatrchyan et al. (CMS), Phys. Lett. B716, 30 (2012),1207.7235
[2] G. Aad et al. (ATLAS), Phys. Lett. B716, 1 (2012),
1207.7214
[3] G. Aad et al. (ATLAS Collaboration), Phys.Lett.
B717, 49 (2012),1205.2531
[4] S. Chatrchyan et al. (CMS Collaboration), CMS-PAS-EWK-11-009 (2012)
[5] A. Nagano, FERMILAB-THESIS-2008-96 (2008) [6] V.M. Abazov et al. (D0 Collaboration),
Phys.Rev.Lett.107, 241803 (2011),1109.4432
[7] T. Aaltonen et al. (CDF Collaboration), Phys.Rev.
D82, 031103 (2010),1004.1140
[8] V.M. Abazov et al. (D0 Collaboration), Phys.Rev.
D85, 052001 (2012),1111.3684
[9] S. Chatrchyan et al. (CMS Collaboration), CMS-PAS-SMP-12-020 (2012)
[10] V. Abazov et al. (D0 Collaboration), Phys.Rev.Lett.
102, 201802 (2009),0902.2157
[11] G. Aad et al. (ATLAS Collaboration) (2012),
1210.2979
[12] S. Chatrchyan et al. (CMS Collaboration), CMS-PAS-SMP-12-005 (2012)
[13] J.M. Campbell, R.K. Ellis, C. Williams, JHEP 07, 018 (2011),1105.0020
[14] S. Chatrchyan et al. (CMS Collaboration) (2013),
1301.4698
[15] S. Chatrchyan et al. (CMS Collaboration) (2012),
1210.7544
[16] V.M. Abazov et al. (D0 Collaboration), Phys.Rev.Lett.108, 181803 (2012),1112.0536
[17] G. Aad et al. (ATLAS Collaboration), Eur.Phys.J.
C72, 2173 (2012),1208.1390
[18] S. Chatrchyan et al. (CMS Collaboration), CMS-PAS-EWK-11-010 (2011)
[19] T. Aaltonen et al. (CDF Collaboration), Phys.Rev.
D86, 031104 (2012),1202.6629
[20] V.M. Abazov et al. (D0 Collaboration), Phys.Rev.
D85, 112005 (2012),1201.5652
[21] G. Aad et al. (ATLAS Collaboration) (2012),
1211.6096
[22] S. Chatrchyan et al. (CMS Collaboration), JHEP
1301, 063 (2013),1211.4890
[23] G. Aad et al. (ATLAS Collaboration), ATLAS-CONF-2012-090 (2012)
[24] T. Aaltonen et al. (CDF Collaboration), Phys.Rev.Lett.108, 101801 (2012),1112.2978
[25] S. Chatrchyan et al. (CMS Collaboration), JHEP
1212, 034 (2012),1210.3844
[26] U. Baur, E.L. Berger, Phys.Rev.D41, 1476 (1990) [27] S. Chatrchyan et al. (CMS Collaboration), Phys.Lett.
B699, 25 (2011),1102.5429
[28] J. Alcaraz et al. (ALEPH Collaboration, DELPHI Collaboration, L3 Collaboration, OPAL Collabo-ration, LEP Electroweak Working Group) (2006),
hep-ex/0612034
[29] K. Hagiwara, R. Peccei, D. Zeppenfeld, K. Hikasa, Nucl.Phys.B282, 253 (1987)
[30] G. Gounaris, J. Kneur, D. Zeppenfeld, Z. Ajaltouni, A. Arhrib et al. (1996),hep-ph/9601233
[31] V.M. Abazov et al. (D0 Collaboration), Phys.Lett.
B718, 451 (2012),1208.5458
[32] U. Baur, E.L. Berger, Phys.Rev.D47, 4889 (1993) [33] U. Baur, D.L. Rainwater, Int.J.Mod.Phys.A16S1A,
315 (2001),hep-ph/0011016
[34] G. Aad et al. (ATLAS Collaboration), Phys.Rev.Lett.