105
Open Pit Optimization Processes Of Okobo Coal
Mine - Strategies For Improving The Economics
Of Mining Projects With Special Utilization Of
Minex Optimizer Programme
Nwafor, C. Gideon, Nwafor, O. MichelleABSTRACT: Open pit design and scheduling problem is a large-scale optimization problem that has attracted considerable attention during the last 45 years. With development of the mining model, a pit design tool that facilitates the best overall theoretical cash flow mining sequence through the deposit could be applied. The mine design tool is referred to in the mining industry as "Optimizer" and is based on algorithm developed by Learchs and Grossman. The development of the "know -how" to improve economics of open pit mining projects through the use of mathematical optimization techniques goes back to early 1960's. Unfortunately, up until recently, many of these "optimizing algorithms" could not be implemented due to the limited capacity of the computer hardware used i n many mining operations. During the last 15 years, advancements in the computer hardware technology along with developments in software technology all owed open pit mines to have powerful desktop computers that can solve complex optimization problems on si te. Western Goldfield Group Nigeria has implemented an optimization and scheduling of its coal mine using Minex Open Pit Optimizer Programme (MOPOP) to schedule their entire mine and production, resulting in significant process cost savings. This paper outlines open pit optimization techniques that were utilized in mine planning of Okobo Coal Reserve, Located in Enjema District o f Ankpa Local Government Area, Kogi State, Nigeria, as a strategy to improve the economics of the open pit mining projects.
————————————————————
1.0 INTRODUCTION
The current practice of planning of hard rock open pit mine begins with a geologic block model and involves determination of: 1) whether a given block in the model should be mined or not; 2) If it is to be mined when it should be mined; 3) Once it is mined then how it should be processed. The answer to each of these questions, when combined within the whole block model, define the annual progression of the pit surface and the yearly cash flows that will be coming from the mining operations during the life of mine. With development of the mining model, a pit design tool that facilitates identifying the best overall theoretical cash flow mining sequence through the deposit could be applied. The mine design tool is referred to in the mining industry as an "Optimizer" and is based on an algorithm developed in the 1960s by Learchs and Grossman. The optimizer accepts inputs related to pit wall slope, mineral recovery, recoverable coal seam thickness, mining and processing cost, waste costs, and product quality adjusted sales price. Variable haul costs, as defined by source area and haul cost to a dump site, can be input into the optimizer. The objective of the planning process for an open pit mine is usually to find optimum annual schedules that will give the highest Net Present Value (NPV) while meeting various production, blending, sequencing and pit slope constraints. The optimizer divides the mining model into blocks of a specific width, length, and height, in effect sugar cubing the mining model. A value is then calculated and assigned to each block. This is done by calculating the revenue obtained from each block, if any, adjusted for the quality and recovery. Coal below a specified thickness is treated as waste. Mining and processing costs for coal are assigned to the blocks containing coal and variable haulages costs can be applied. The net value of each coal block is then calculated. Similarly, waste block
costs are calculated. Coal blocks should have a positive value and waste blocks a negative value. The optimizer then operates on the block model to find every block or combination of blocks that will add to the value of the pit. No block or group of blocks can be added to or subtracted from the blocks identifying the maximum value pit without reducing the maximum value of the pit. Theoretically, every point along the wall of the pit defined has the same economic value and the average value of all ore within the designed pit will have a value greater than on the boundary. There can be many different solutions to the scheduling problem depending on how the decision is made for each of the blocks. Decision as to which blocks should be mined in a given year, and how they should be processed (i.e. waste, run of mine, crushed ore or mill ore etc.) defines not only the cash flows for that year but also impacts the future annual schedules. What is decided today has long term implications as to what can be done in the future and these entire decisions link together in defining the overall economics of a given project.
2.0 GEOLOGIC MODEL
106 one seam of commercial interest, referred to as Okobo
seam. It is overlaid by complex of sandstones, shale and consolidated red and brown clays comprising the majority of the overburden. The topsoil layer was recognized but not reported in the drill logs because the drilling process washed away the loose material near the surface. The top soil surface was constructed base on a number of test pits that showed about a half meter of topsoil in areas of relatively low gradients to being
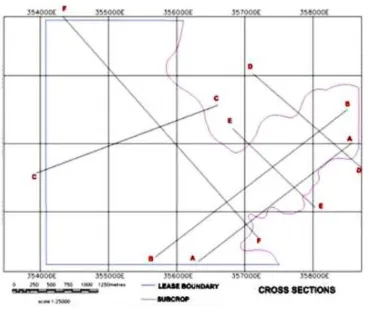
non-existent in the steeper areas. The steeper areas were interpreted as slope greater than 20 degrees. The topsoil was estimated from the depth of washed out material reported in the drill holes to thin to 0.25 meters at a break from a 6 degree slope to a steeper sloping topography. Topsoil model was created to reflect these observations. The following sections, A-A through G-G as presented below demonstrates the structural model's internal consistency of the coal deposit.
Figure 2.1: Sections A-A,B-B,C-C,D-D,E-E and F-F Locations
Figure 2.1: Sections A-A,B-B,C-C,D-D,E-E, and F-F locations
107 Figure 2.3: Sections B-B
Figure 2.4: Sections C-C
Figure 2.5: Sections D-D
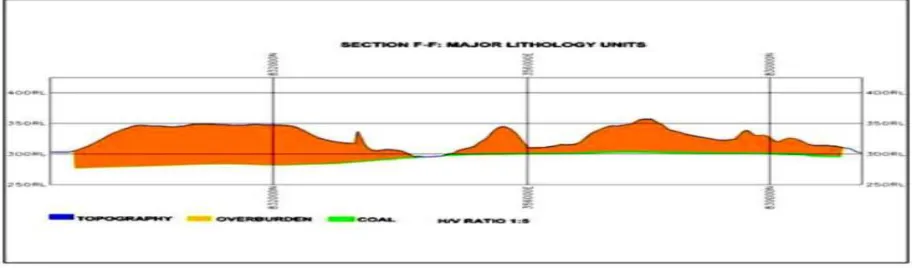
108 Figure 2.7: Sections F-F
3.0 MINING MODEL
Upon completion and acceptance of geologic model, the structural model was converted to a model for use in mine surface design. In Gemcom Minex terminology, this is terminology; this is a merged model, hereafter referred to as the mining model. The quality model grids were made compatible with the mining model and are referred to hereafter as to part of the mining model. After viewing the drill data, quality attributes, and compositing the seam quality of the Okobo seam and the lower
carbonaceous shale, it was determined that, from a mining perspective, except in the few places in excess of 0.5 meter thickness, the carbonaceous lower shale could be combined with the Okobo seam without significant impact on coal quality. This composite coal seam model was used in developing this optimum pit discussed below as separation of the bottom carbonaceous shale member is likely difficult and cost without significant impact on the coal quality or revenue except in localized areas.
Table1: Statistics on Potentially Diluting Carbonaceous Shale on Top and Bottom of Okobo Coal Seam
Coal Average Minimum Maximum NetCV Ash Sulfur Volatile
Seam 'Iblekness Thickne.ss Thickne-ss Matter
(k tonne.s) (meters) (meter) (meter) (MJ/kg) (%) (%) (%)
Upper Carbonaceous Coal 0.732
Okobo Seam 11,324 1.73 0.04 J.13 19.62 8.61 0.57 32.48
Lower Carbensceeus Shale 7 0.08 0.01 0.57 17.78 18.94 0.41 30.73
Total! Average 11,332 19.62 8.62 0.57 32.48
Statistics reported for seams bounded by the subcrop line and lease boundary
A number of constraints were applied to the design of the pits that are built into mining model. The constraints included in the mining model are:
Containing the rim of the pits were constrained to be within the property limits
Providing space for roads, power lines, and drainage channels around the pit rim, as necessary
Providing a set back where necessary from the lease boundaries
Mining the base of the pit to the lower carbonaceous shale by compositing it with the Okaba seam
Requiring the pit bottom to be at least 50 meters wide to ensure adequate operating room for the mining operation
Recovering seams of less than 0.5 meters were considered uneconomic and were added to the waste quantities. Coal recovery was estimated to be 95% with losses primarily occurring below the bottom of the Okaba
seam in an effort to minimize under seam dilution III a potentially muddy environment.
4.0
OPTIMIZATION
AND
PUSHBACK
GENERATION
109 defined because there will be insufficient money for the
coal and waste removal costs and the coal processing costs to support the mining of any coal. Reducing the percentage systematically will allow initially small pits of high unit value to develop. As the parameter is progressively reduced, larger pits will be defined. As the value of the parameter is further reduced, the pits will grow and may merge into bigger pits. The unit value of the coal between each progressive pit shell will be lower as the allowable cost of mining and processing is increased. This sequence defines the theoretical sequence through the mine that will maximize the cash flow the "profit" parameter can be reduced to zero or even negative to develop an understanding of the economic behavior of the deposit. By pushing the economic limit to negative, a hard limit on pit expansion may be identified or the potential for additional reserves should the sales price of the product increase. The sequence of shells will, on occasion, lead to questions about the underlying geological model. The pits defined by this parametric analysis are not likely to be practical units. They form a guide as to how to develop the deposit. The actual planed mining sequence should stay as close to this progression as practical with a reasonable consideration allowed in order to maximize the net present value (NPV) or discount cash flow-rate of return (DCF-ROR) on a project. The parameter used in the parametric analysis presented below is a percentage of the revenue received from the sale of the product at some defined point such as Free on Board (FOB) the mine. In reporting the result of the analysis, it is informative to transform the percent parameter into monetary units. In the tabulations below, the sales price is multiplied by the percent parameter to give the amount of money after all mining cash costs that are reserved for undistributed expenses, taxes, interest, loan repayment, and profit. This approximates the definition of margin used rigorously by accountants but it does not comply with accounting standards. The parameter listed in the tables and discussions below refer to the margin as the parameter controlling the pit expansions for identifying the strategic sequence for exploitation of the deposit.
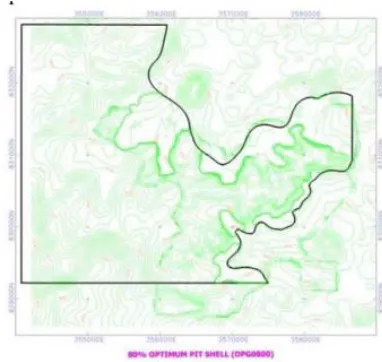
4.1 $80 Margin Optimizer Pit
The $80 margin optimizer results are shown in Figure 4.1. There are three distinct areas of interest, two on the north side adjacent to the subcrop line and adjacent to the southeast subcrop line. The southeast area is sub-divided into three smaller areas of interest. These three areas are prototype pits that have the highest profit potential within the subcrop area.
Figure 4.1 $80 Margin Optimizer Pit
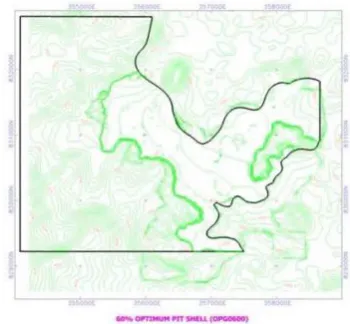
4.2 $75 Margin Optimizer Pit
The $75 margin optimizer results indicate that a $5.00 reduction in margin add approximately 100,000 tonnes to the north area and another 300,000 tonnes to the southeast pit. The changes along the boundary of the north pits are barely perceptible on Figure 4.2 relative to Figure 4.1. From a mine planning perspective, there is no opportunity to develop a separate expansion between these two optimizer pits. The two areas will either be merged into the $80 margin pit or included in the $70 margin pit or some combination of both to start straightening the pit outlines in to more practical limits.
Figure 4.2 $75 Margin Optimizer Pit
in the southeast pit area, the difference is more noticeable. The three separate areas in the southeast, formed at the $80 margin level, have merged into two areas, both having the potential to be the basis for a practically mineable pit. An examination of the topography around both the $80 and $75 margin pits clearly show that the pits are limited by the crop line on one side and hills rising on the other side of the pits.
4.3 $70 Margin Optimizer Pit
110 segments shown with a $75 per tonne margin merged into
one longer pit.
Figure 4.3 $70 Margin Optimizer Pit
Expansion of the pits continues to be limited by the surrounding hills and the increase in stripping they represent.
4.4 $65 Margin Optimizer Pit
Figure 4.4, the $65 margin pit, shows a significant break from the $80 margin pit through the $70 margin pit. The hills dividing the southeast prototype pits from the two north prototype pits have been removed connecting the three pits and opening the coal between the three areas. This identifies an incremental 1.7 million tonnes of 20.79 AD MJ/kg coal at 12.35 strip ratio in the 65 incremental pits compared with the combined the $70 incremental pits that exposed 600,000 tonnes of 20.77 AD MJ/kg coal at 10.51 strip ratio. This will likely present a detailed scheduling challenge that will need to be addressed when fitting the mining method to the topography and the practical pit that will need to be developed.
Figure 4.4 $65 Margin Optimizer Pit
The $60 margin optimizer pit, Figure 4.4, expands both east and west from the opening made by the $65 margin optimizer pit. The westward expansion is too small to form a practical mining unit. The expansion to the east appears to make a reasonable mining unit.
4.5 $60 Margin Optimizer Pit
The $60 margin optimizer pit, Figure 4.5 expands both east and west from the opening made by the $65 margin optimizer pit. The westward expansion is too small to form a practical mining unit. The expansion to the east appears to make a reasonable mining unit.
Figure 4.5: $60 Margin Optimizer Pit
4.6 $55 Margin Optimizer Pit
As shown on Figure 4.6, the $55 margin optimum pit pushes both east and west. On the east side, a residual high is left isolated with little ability to access, suggesting it either be left or moved with the $60 margin pit. On the west, the pit pushes the boundary of the prototype pit into the higher remaining cover areas. Both the east and west pushbacks are marginal facsimiles of a mineable unit.
Figure 4.6: $55 Margin Optimizer Pit
4.7 $50 Margin Optimizer Pit
111 Figure 4.7: $50 Margin Optimizer Pit
4.8 $45 Margin Optimizer Pit
As shown on Figure 4.8, the $45 margin optimizer pit finally removes the hill on the east side of the deposit. The west side of the pit showed very limited movement. The area to the east of the break though between the $70 margin pits and the $65 margin pit may require integration into one mining unit because of access Issues.
Figure 4.8: $45 Margin Optimizer Pit
4.9 $40 Margin Optimizer Pit
The $40 margin optimizer pit (Figure 4.9) shows very limited movement to the west. The incremental strip ratio increased from 16.27 in the $45 margin pit to 20.99 in the $30 margin pit.
Figure 4.9: $40 Margin Optimizer Pit
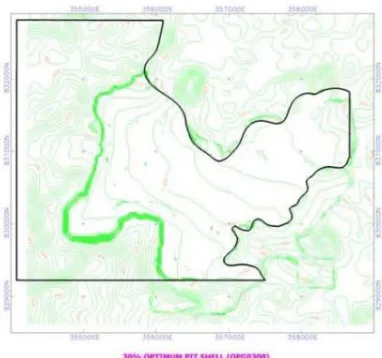
4.10 $30 Margin Optimizer Pit
The $30 margin pit (Figure 4.10) shows a noticeable movement in the range several hundred meters from the $40 margin pit adding 1.5 million tonnes to the resource total increasing the strip ratio from 20: 1 to 27: 1. This could be considered as a pushback; however, the economics of this pushback has to be well verified.
Figure 4.10: $30 Margin Optimizer Pit
4.11 $20 Margin Optimizer Pit
The incremental strip ratio on the pushback from the $30 margin optimizer pit to the $20 margin optimizer pit is 27.67 and is unlikely to be economical for surface mining (Figure 4.11).
Figure 4.11: $20 Margin Optimizer Pit
5.0 PRACTICAL PIT DETERMINATION AND
STRATEGIC MINE SEQUENCE
While the pits developed in the Gemcom Minex® Optimizer program is theoretically perfect, they often are not practical, because they do not take into
consideration:
Combining or dividing of the optimizer pits to make practical mineable units
112 Placement of access and roads for truck haulage
of coal to crusher or stockpiles
Placement waste dumps either within or outside of the pit and relate waste haul roads
Buffer zones along property boundaries
Water drainage and stream diversions may need to be integrated into the plan
Integration of the mine areas into an executable sequence with the mining method being applied
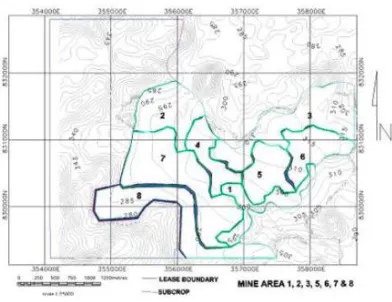
All of the above modifications to the pits are identified by the optimizer parametric analysis will result in changes that reduce the net unit value of the coal in the practical pits by an increase in waste removal and or a decrease in coal to be mined. After considering the "optimum pits," eight strategic mine area advances were identified. This information is presented in figure 5.1. below.
Figure 5.1: Practical Pits 1-8
The strategic mining sequence starts with the 1.1 million tonnes in the location labeled as Mine Area " 1 ". Mine Area 1 was first established and close in drilling was focused on that area. A coal haul road is proposed around the southwest end of Mine Area 1 and west to the crusher site. As first mined area, the southwest pit will be mined add left with an exposed high wall until the mine progresses from the north to the south. Backfill will be placed against the wall to avoid long-term coal exposures spontaneously combusting, and to prevent water accumulations and potential safety issues. Before the coal in Mine Area 1 pit is exhausted, development work will start on the northern edge of the deposit in the mining area labeled "2," followed by Mine Area 3. A coal haul road is proposed between Mine Area 2 and the crusher. This road passes from north to south along the western edge of the mining area. As coal in Mine Area 3 is developed, the coal haul road will be extended into the new areas. Mine Area 4 occupies the area between Mine Areas 1, 2, and 3, as shown on Figure 4.1. It has a significant increase in strip ratio and will require significantly more lead time to develop than Mine Areas 2 and 3. The production schedule will require the development of Mine Area 4 be integrated into the mining of Mine Areas 3 and 4.Mine Area 5, develops to the south of Mine Area 3 and north of Mine Area 1.Mine Area 5 butts up against the high hills to the east and to Mine Area 4 to the west. Integrating Mine Area 5 into the
earlier active mining areas and the subsequent mine areas will be an important requirement of the production schedule. Mine Area 6 is a combination of several optimizer pits that indicate, based on strip ratio, that the area should be included in the strategic sequence with or after Mine Area 5. Access to the high topography, production sequencing, and equipment utilization would be difficult with an ordered sequence. A development on a broad front through Mine Areas 4,5, and 6 appears to offer an opportunity to approximate the strategic sequence while allowing for a well-organized utilization of equipment, access, and open operating reserve. Mine Area 7 is a relatively high strip ratio resource on the west side of the mine area. It has similar strip ratio and preliminary economics as that of Mine Area 6. A broad front advance running for about 1,500 meters from pit 2 on the northwest end and to Mine Area 4 on the southeast end is a potential development strategy. As with Mine Areas 4, 5, and 6, the long face would be conducive to good equipment utilization, greater open reserve, and facilitate higher rates of production. An analysis of the development options would suggest that a chevron shaped advance of the pit, from north to south, provides an opportunity to develop and orderly advance of the mining face, a steady and manageable strip ratio increase with staged equipment additions, with maximization of the open reserve potential, minimization of haulage distances, climbs to the back fill area, and a reasonable adherence to the strategic mme sequence strategy. Mine Area 8 is a significant resource; however, at a strip ratio of approximately on a very high ratio, economics may indicate it is more suitable for underground mining. A cash flow analysis will determine if the economic favors inclusion of this resource in the surface mining reserves or not.
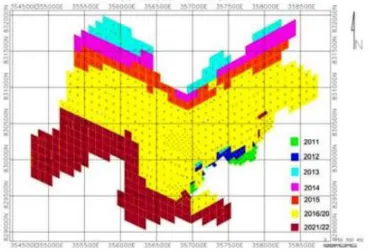
5.1 Production Schedules
113 Figure 5.2: Base Case Production Schedules
6.0 CONCLUSIONS
Models and plans were done using minex 6.0.5 of Gemcom Software Australia Pty Ltd ,a mine planning application package for coal and other stratified deposits such as phosphate, zinc, bauxite, iron ore and platinum, which is designed to allow surveyors, geologists and engineers to work together effectively throughout the life of a mine. These designs were integrally linked to a geology model so that mine designs can align with economic or geological considerations such as depth, strip ratio or optimum pit limits. It defined the most profitable extraction sequence of the mineralized material from the ground that produces maximum possible discounted profit while satisfying a set of physical and operational constraints. The large-scale open pit operations are looking at ways to improve economics of the operations using NPV as a criterion. The mine planning looked beyond the optimization techniques that traditionally provided the highest undiscounted profits. The available commercial packages are retooling their programs to overcome shortcomings of traditional mine planning techniques and providing NPV maximized mine plans and schedules. It is matter of time before the latest operation research based optimization tools become commercially available and regularly used. The use of these optimization tools and strategies provided great opportunities for increased returns on large amount of capital being invested on Okobo Coal Project. The most economical mine areas were selected through optimization processes based on quality and low stripping ratio as a priority area for the first years of mining.
REFERENCES
[1] Akaike, A and Dagdelen, K.. 1999, "A strategic Production Scheduling Method for an Open Pit Mine", Proceedings of 28") APCOM, pp. 729 to 738.
[2] Bernabe, D., 2001, "Comparative Analysis of Open Pit Mine Scheduling Techniques For Strategic Mine Planning of a Copper Mine in Southern Peru", MSc. Thesis, Colorado School of Mines, Golden, Colorado, 200l.
[3] Cai, Wen-Long, and Banfield, F., 1993, "Long Range Open Pit Sequencing - A Comprehensive Approach", APCOM Proceedings - Montreal, 1993, pp. 11-18.
[4] Camus, J.P. and Jarpa, S. G., 1996, "Long Range Planning at Chuquicamata Mine", Proceedings of2dh APCOM Symposium, pp 237 to 24l.
[5] Dagdelen, K., 1992, "Cutoff Grade Optimization", Proceedings of 23"* APCOM, University of Arizona, Tucson, Arizona, pp. 157-165.
[6] Lerchs and 1. F. Grossmann, "Optimum design of open pit mines," Canadian Institute of Mining Transactions, vol. 68, pp. 17-24, 1965.
[7] Hoerger, S. 1999, and et al "Long Tenn Mine and Process Scheduling at Newmont's Nevada Operations, Proceedings of 28* APCOM, Colorado School of Mines, Golden, Colorado, E999, pp 739- 748.
[8] Johnson, T.B., 1%8, "Optimum Open-Pit Mine Production Scheduling", Ph.D. Dissertation, University of California, Berkeley, Operations Research Department.
[9] Lane, K. F, 1964, "Choosing the Optimum Cutoff Grade", Colorado School of Mines Quarterly, Vol. 59, pp. 811-829.
[10] Lane, K. F., 1988, Economic Definition of Ore - Cutoff Grades Theory and Practice", Mining Jownal Books Limited, London.
[11] Lerchs, H. and Grosmann, 1. F.. 1 %5, "Optimwn Design of Open Pit Mines", Canadian Institute of Mining Bulletin. Vol. 58, no. 633, Jan., pp. 47-54.
[12] Tolwinski, B., 1998, <Scheduling Production for Open Pit Mines", 27™. APCOM Proceedings - London, UK, !998, pp. 651-662.