IMAGE DIGITIZATION BY WAVELET
COEFFICIENT WITH HISTOGRAM SHAPING AND
SPECIFICATION
Shivam Sharma
1, Mr. Lalit Singh
21,2
M.Tech Scholor,
2Assistant Professor GRDIMT, Dehradun (India)
ABSTRACT
Many applications of histograms for the purposes of image processing are well known. However, applying this
process to the transform domain by way of a transform coefficient histogram has not yet been fully explored.
This method combines two very popular techniques of enhancement, Wavelet decomposition and histogram
shaping & shifting. We will use this method for enhancement of commercial images as well as natural images.
In this algorithm, a original image (gray scale and color image) is first decomposed in its wavelet coefficients.
Then these coefficients filtered by global thresholding. This threshold is calculated by histogram shaping &
shifting method with the variable value of coefficient K. Inverse wavelet transform of filtered and modified
coefficients of image give the reconstruction of original image. With this algorithm, a new and efficient
algorithm for reshaping of histogram that is capable in enhancing local details as well as properly preserving
the image brightness is presented. In this paper, we show that a modified version of the measurement of
enhancement by entropy (EME) can be used as an image similarity measure, and thus an image quality
measure. Until now, EME has generally been used to measure the level of enhancement obtained using a given
enhancement algorithm and enhancement parameter. In terms of EME values, this combination will produces
better results.
In this a new and efficient algorithm for reshaping of histogram that is capable in enhancing local details as
well as properly preserving the image brightness is presented. When residual bad pixels exist in the image, the
dynamic range of the scene will be heavily suppressed when it displayed on a regular monitor. The proposed
method is reduced the dynamic range compression and improve the dynamic range and contrast. The proposed
algorithm also works on zero frequency components that exist sometimes in the original histogram, and they can
enhance the contrast by redistributing the original gray scales uniformly onto full Gray scale range. The
dynamic range of the image is much improved after proposed method and the details hidden in the original
image are enhanced. Simulation results show the efficient performance of proposed weighting method in terms
of Entropy and EME.
Keywords: Contrast Stretching, Contrast Entropy, Discrete Wavelet Transform, Entropy,
I. INTRODUCTION
Contrast Stretching is a systemic operation in Contrast Enhancement is a systemic operation in image processing which enhances human recognition of details secret in the scene and also renewed very rapid recognition of interested purposes. It makes various contents of images easily perceptible through suitable increase in contrast. Histogram modeling techniques provide sophisticated methods for modifying the dynamic range and contrast of an image by altering each individual pixel such that its intensity histogram assumes a desired shape. The goal of this thesis in objective image i.e. color and grey scale images contrast quality assessment is to produces quantitative measures that can quickly predict perceived image quality.
DWT decomposes image into four sub bands. These sub bands are low-low (LL), low-high (LH), high-low (HL) and high-high (HH). These sub bands are of, half the dimensions of that of image under assumptions, Stationary wavelet transform (SWT) is also being used for the resolution and contrast enhancement of different kind of images. Here we have proposed a new method for image resolution enhancement which is based on combination of DWT and SWT components.
II. PROPOSED WORK
In order to test the proposed method, Simulation using MATLAB 7.7.0 (R2008b ) are performed on input images. To evaluate the image enhancement performance, EME used as the criterion to calculate the entropy of enhanced image.
)
1
(
...
I)
(K,
I
I)
(K,
I
log
I)
(K,
I
I)
(K,
I
K
K
1
EME
min max K 1 k min max K 1 I 2 1 2 2
EM E:-Measure of Enhancement Higher the value of EME denotes a higher contrast and information clarity in the image.
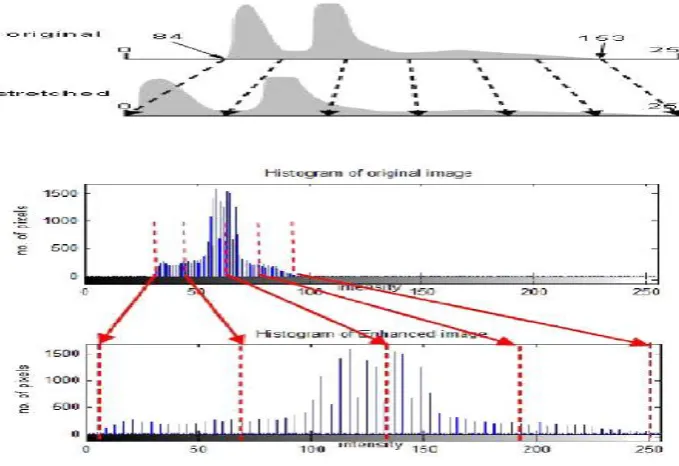
2.1 Histogram Shaping
Fig 2.1 Setup for Proposed Histogram Reshaping
2.2 Block Diagram
Figure 2.2 Proposed Block Diagram
2.3 Algorithm Proposed
The following steps are used in proposed algorithm:
Step 1: Upload an original image in MATLAB.
Step 2: Draw the histogram of the uploaded original input image.
Step 3: Calculate minimum and maximum value of thefrequency component in the histogram.
Step 4: FetchWavelet decomposition of load image.
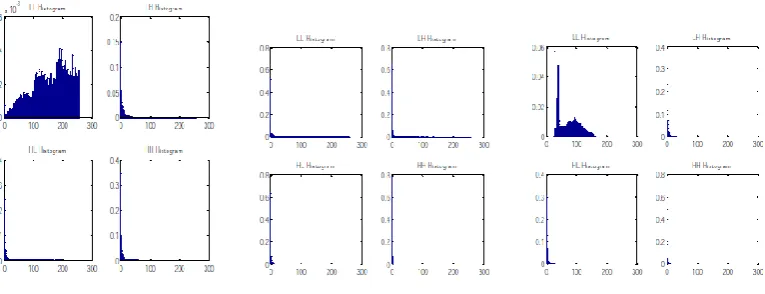
Step 5: Plot LL, LH, HL, HH Histograms.
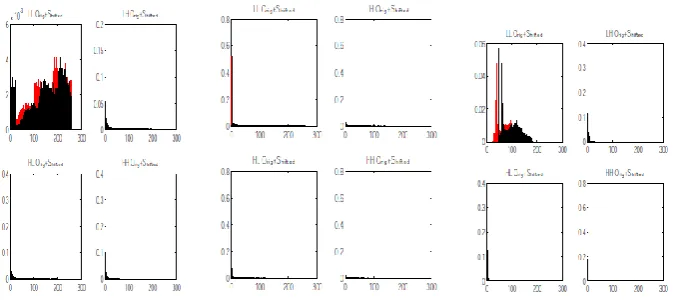
Step 6: plot LL orig + shifted,LH orig + shifted,HLorig+ shifted, HH orig+ shifted Histograms
Step 7: Take Processed image, if it is not met then go tostep 3 again.
ORIGINAL IMAGE
(Input)
DWT Thresholding
MATCH HISTOGRAM
ENHANCED IMAGE
(Output)
INVERSE D W T
Equalizer HISTOGRAM SHAPING COEFFICIENT K
III. SIMULATION & RESULT DISCUSSION
Figure 3. Original Images - a) Building b) Rock c) Seed
Figure 3.1 Wavelet Decomposition of a, b ,c Images Respectively for k = 1
Figure 3.3 LL,LH,HL,HH’s orig + Shifted Histograms of Images a,b,c Respectively.
Figure 3.4 Enhanced Version of Loaded Original Images for k = 1
Figure 4.1 LL,LH,HL,HH Histograms of Images a,b,c Respectively for k= 10
Figure 4.2 LL,LH,HL,HH’s orig + Shifted Histograms of Images a,b,c respectively for k=10
Figure 5 Wavelet Decomposition of a, b, c Images Respectively for k = 15
Figure 5.1 LL,LH,HL,HH Histograms of Images a,b,c Respectively for k= 15
Figure 5.3. Enhanced Version of Loaded Original Images for k =15
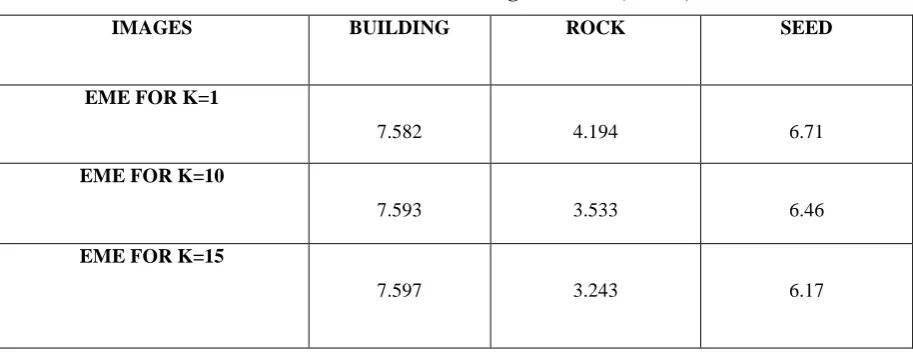
Calculation of EME For Loaded Enhanced Images for different value of K
Table 1.1 Calculation of EME of Images For K=1, K=10, K=15.
IMAGES BUILDING ROCK SEED
EME FOR K=1
7.582 4.194 6.71
EME FOR K=10
7.593 3.533 6.46
EME FOR K=15
7.597 3.243 6.17
IV. CONCLUSION
It is concluded from the thesis that Wavelet decomposition by histogram shifting & shaping method has better contrast and resolution of enhanced image. The final result shows the good visual quality without any inconvenient washout effect and blurred of images. It also increases the value of measurement of enhancement entropy (EME). This work shows the comparison for different images over EME parameters. The dynamic range of the image is much improved after proposed method and the details hidden in the original image are enhanced. Transform histogram shifting and shaping is the best method presented in this thesis.
REFERENCES
[1] Debashis Sen, Sankar K. Pal, “Automatic exact histogram specification for contrast enhancement and visual system based Quantitative Evaluation.” IEEE Transactions on image processing, Vo l. 20, No. 5, May 2011.
algorithms using contrast entropy,” IEEE Trans. Image Process, vol 16, no. 3, pp. 741-758, Mar 2007. [4] Agaian, SOS S., Blair Silver, Karen A Panetta,“Transform Coefficient Histogram- Based Image
Enhancement Algorithms Using Contrast Entropy”, IEEE Transaction on Image Processing, Vol. 16, No. 3,March.2007
[5] B. Silver, S. S. Agaian, and K. A. Panetta, “Logarithmic transform coefficient Histogram, Matching with spatial equalization,” presented at the SPIE Defense andSecurity Symp., Mar.,2005.