IgG glycoforms in arthritis
by
Katherine Birgitta Bodman
Department of Immunology
University College London School of Medicine
ProQuest Number: 10046034
All rights reserved
INFORMATION TO ALL USERS
The quality of this reproduction is dependent upon the quality of the copy submitted.
In the unlikely event that the author did not send a complete manuscript
and there are missing pages, th ese will be noted. Also, if material had to be removed, a note will indicate the deletion.
uest.
ProQuest 10046034
Published by ProQuest LLC(2016). Copyright of the Dissertation is held by the Author.
All rights reserved.
This work is protected against unauthorized copying under Title 17, United States Code. Microform Edition © ProQuest LLC.
ProQuest LLC
789 East Eisenhower Parkway P.O. Box 1346
A B S T R A C T
Serum IgG Fc has been shown to contain two conserved N-glycosylation sites, on which mannose rich, bi-antennary oligosaccharide chains are found. These oligosaccharide chains are postulated to conserve the three-dimensional structure of the IgG molecule and usually terminate in galactose. A decrease in terminal galactose (resulting in exposure of N-acetylglucoseamine (GlcNAc)) was described in rheumatoid arthritis (RA) patients and as a function of age in the healthy control population.
This thesis develops two rapid methodologies for the determination of the amount of terminal galactose in serum, synovial fluid and supernatant IgG molecules. These methodologies were then used to examine this glycoform in RA patients and murine models of arthritis.
The age-related decrease of IgG galactose in human control populations was re established and age-related changes in a variety of autoimmune prone and non-prone strains of mice were revealed. Agalactosyl IgG was shown to have a predictive value in RA patients presenting with early synovitis and as a longitudinal marker of the disease where it could be used to predict disease outcome. ThJ involvement of this glycoform in complex formation was analysed along with its relationship between the serum, synovial fluid and levels of interleukin 6. Spontaneous (MRL Ipr/lpr mice) and collagen induced (DBA/1 mice) models of arthritis were shown to have decreased levels of terminal galactose on their serum IgG molecules.
The defect was shown to occur as a pre-secretory event in human peripheral blood and synovial fluid mononuclear cells and increased spontaneous production was seen in MRL Ipr/lpr spleen and peripheral blood cell suspensions when compared to the same
compartments in the control strain of mice (CBA/Ca).
Using human T- and B-cell enriched populations and IgG secreting cell lines, T-ceUs and the cytokine interleukin 6 were shown to affect the regulation of IgG glycosylation. Sera from mice treated with a non-depleting anti-CD4 antibody were also investigated in order to provide further clues relating to T-cell regulation of this phenomenon.
C O N TE N TS
A B S T R A C T... 2
D E D I C A T I O N... 3
C O N T E N T S...4
T A B L E C E C O N T E N T S... 5
L I S T O F F I G U R E S...12
L I S T O F T A B L E S... 16
A B B R E V I A T I O N S... 18
A C K N O W L E D G E M E N T S...21
R E F E R E N C E S... 161
TABLE OF CONTENTS
C H A P T E R 1
G E N E R A L IN T R O D U C T IO N
1.1 R H E U M A T O ID A R T H R I T I S A N D Ig G... 23
1.1.1 R h e u m a to id a r t h r i t i s... 23
1.1.1.1 H um an rheum ato id a rth ritis... 23
1.1.1.2 M urine m odels o f a rth ritis... 24
1 . 1 . 2 Im m u n o g lo b u lin s a n d r h e u m a to id a r th r itis... 26
1.2 Ig G S T R U C T U R E A N D G L Y C O S Y L A T IO N... 27
1.2.1 Ig G s tr u c tu r e... 27
1.2.2 O lig o s a c c h a r id e a s s e m b ly...30
1.3 A B N O R M A L IT I E S I N Ig G O L IG O S A C C H A R ID E S... 32
1.3.1 A g ly c o s y la te d I g G... 33
1.3.2 A g a la c to s y la te d I g G... 33
1.3.2.1 H um an agalactosyl IgG or 'GO'... 33
1.3.2.2 M urine a g a la cto syl Ig G...35
1.3.3 O th er ch a n g es in Ig G c a rb o h y d ra tes... 35
1.3.3.1 G ly c a te d Ig G... 35
1.3.3.2 S ia ly la tio n c h a n g e s... 36
1.3.3. Other changes in IgG oligosaccharides... 36
1.4 Ig G G L Y C O S Y L A T IO N C H A N G E S: E F F E C T O N Ig G F U N C T I O N... 36
1 .4 .1 A g ly c o s y la te d I g G... 37
1 . 4 . 2 A g a l a c to s y la te d I g G... 37
C H A P T E R 2 M A T E R IA L S A N D M E T H O D S 2 .1 M A T E R I A L S... 40
2 . 1 . 1 I m m u n o c h e m i s t r y... 40
2.1.1.1 C h e m i c a l s...40
2 .1 .1 .3 M a tr i c e s / m e m b r a n e s... 40
2 .1 .1 .4 P r o t e i n s...40
2 .1 .1 .5 GO a s s a y s... 41
2 .1 .1 .6 N o n -ste rile p la s tic s... 41
2 .1 .1 .7 P r o life r a tio n a s sa y s... 41
2 . 1 . 2 A n t i b o d i e s... 41
2.1.2.1 H u m a n... 41
2 .1.2.2 M u r i n e... 41
2.1.2.3 M i s c e l l a n e o u s... 42
2 . 1 . 3 C ell s e p a ra tio n r e a g e n ts... 42
2 . 1 . 4 T is s u e c u ltu r e r e a g e n ts /e q u ip m e n t... 42
2.1.4.1 M e d i a / s u p p l e m e n t s... 42
2 .1.4.2 M i t o g e n s... 42
2.1.4.3 F re e -ra d ic a l s c a v e n g e rs... 43
2 .1 .4 .4 C y t o k i n e s... 43
2 .1 .4 .5 Tissue culture p la stic s... 43
2 . 1 . 5 M i c e...43
2 . 2 M E T H O D S... 44
2 . 2 . 1 S e ru m a n d syn o via l f l u i d source, collection a n d sto ra g e... 44
2.2.1.1 Source o f human serum and synovial flu id... 44
2.2.1.2 Source o f m urine serum...44
2 . 2 . 2 P re p a ra tio n o f I g G... 44
2.2.2.1 Ammonium sulphate precipitation and anion exchange chromatography purification o f serum and synovial flu id IgG... 44
2.2.2.2 Rapid gel filtration and anion exchange chromatography p u rific a tio n o f Ig G... 45
2.2.2.3 P recipitation o f immune com plexed IgG... 45
2.2.2.4 Purification o f cell culture supernatant IgG... 45
2.2.3 D e te rm in a tio n o f Ig G c o n c e n tr a tio n... 46
2.2.3.1 B i o r a d / B r a d f o r d...46
2.2.3.2 Enzym e linked im m unosorbant assay (E LISA )... 46
2.2.4 D e te r m in a tio n o f Ig G p u r it y...47
2.2.4.1 Sodium dodecyl sulphate - polyacrylamide gel electrophoresis ( S D S - P A G E )... 47
2.2.4.2 W estern b lo ttin g... 47
2.2 .5 B io tin y la tio n o f p r o te in s... 48
2.2.6 C e ll s o u r c e... 48
2.2.6.1 Source o f human tissue m a terial...48
2.2.6.2 Source o f m urine tissue m a terial... 48
2 .2 .7 P re p a ra tio n o f ly m p h o c y te s... 48
2.2.7.7 Separation o f human m ononuclear cells... 48
2.2.7.2 Separation o f murine m ononuclear cells...49
2 . 2 . 8 C o u n tin g o f c e lls... 49
2 .2 .9 H u m a n T- a n d B -ce ll e n r ic h m e n t... 50
2.2.9.1 Preparation o f neuraminidase treated sheep erythrocytes ( N - S R B C )... 50
2 .2.9 .2 Sheep red blood cell resetting o f PBM C... 50
2 . 2 . 1 0 C ell c u ltu r e... 50
2 .2.1 0 .1 C ulture m e d ia...50
a) H um an culture m edium... 50
b) M urine culture m edium... 51
2.2.10.2 Culture w ith m itogens... 51
2.2.10.3 Elim ination o f free -ra d ic a ls...51
2 .2 .1 0 .4 P ro lifera tio n a ssa ys... 51
2 .2 .1 0 .5 T/B -cell m ixing experim ents... 51
2 . 2 . 1 1 Q u a n tita tio n o f s u p e r n a ta n t I L - 6...52
2.3 S T A T I S T I C A L A N A L Y S E S... 52
C H A P T E R 3 D E V E L O P M E N T O F Ig G GO A S S A Y S 3.1 I N T R O D U C T I O N... 54
3.2 I M M U N O - D O T B L O T T I N G...55
3.2.1 D o t b lo ttin g... 55
3.2.1.1 Preparation o f standards and sam ples... 55
3.2.1.2 D o t b lo ttin g... 55
3.2 .2 L e c tin p ro b e s a n d in h ib itio n a ssa y s... 56
3.2.2.1 Lectin binding o f exposed m onosaccharides...56
3.2.2.2 S p e c ific ity s tu d ie s...56
3 . 2 . 3 V a ria b ility a n d s ta tis tic s...59
3.2.3.1 V a r i a b i l i t y... 59
3.2.3.2 C orrelation with biochem ical m ethod...59
3.3 E N Z Y M E L IN K E D L E C T IN A S S A Y ( E L L A )...61
3.3.1 H u m a n seru m , p la sm a a n d syn o v ia l f l u i d a ssa y... 61
3.3.3 C ell c u ltu r e s u p e r n a ta n ts... 62
3.3.4 S p e cificity stu d ie s and va riability o f the E L L A... 63
3.3.4.1 Sp ecificity o f lectin bind in g...63
3.3.4.2 V ariability a n d sta tistics... 64
3.4 D I S C U S S I O N... 66
3.4.1 Im m u n O ’ d o t b lo ttin g... 66
3.4.2 E n zy m e lin k e d lectin a ssa y (E L L A )... 68
C H A P T E R 4 GO C H A N G E S W IT H A G E 4.1 I N T R O D U C T I O N... 72
4.2 H U M A N A G E C H A N G E S... 72
4.2.1 C hanges in GO with age in the healthy control p o p u la tio n 72 4.2.2 S e x d iffe r e n c e s in GO... 73
4.3 M U R I N E A G E C U R V E S... 74
4.3.1 C hanges in GO with age in d iffe r e n t strains o f m ic e... 74
4.3.2 S e x d iffe r e n c e s in m u rin e GO le v e ls... 74
4.4 D I S C U S S I O N... 76
C H A P T E R 5 GO C H A N G E S I N H U M A N A N D E X P E R IM E N T A L M O D E L S O F A R T H R I T I S 5.1 I N T R O D U C T I O N... 79
5 .1.1 H u m a n r h e u m a to id a r th r itis... 79
5.1.2 M u r in e m o d els o f a r th r itis... 81
5.1.3 A g e co rrectio n o f IgG GO le v e ls...81
5 .2 H U M A N A R T H R I T I S... 82
5.2.1 GO in r h e u m a to id a r th r itis... 82
5.2.1.1 GO levels in serum and synovial flu id... 82
5.2.1.2 Relationship between interleukin 6 and GO in plasma and s y n o v ia l f l u i d... 85
5.2.2 GO in im m u n e c o m p le x e s... 86
5.2 .3 GO as a prognostic aid and lo n g itu d in a l m arker
o f d is e a s e... 88
5.2.2.1 GO as a prognostic aid in early-onset synovitis p a tie n ts... 88
5.2.2.2 GO as a longitudinal marker o f disease severity/outcome in RA p a tie n ts...90
5.2 .4 D i s c u s s i o n... 96
5.2.4.1 Serum and synovial flu id IgG GO relationship... 96
5.2.4.2 lL-6 levels in plasma and synovial flu id and relationship to GO le v e ls... 96
5.2.4.3 IgG GO and autoaggregation o f Ig G... 97
5.2.4.4 The prognostic value o f IgG GO in early-onset synovitis p a t i e n t s... 100
5.2.4.5 GO as a longitudinal marker o f disease... 101
5.2.4.6 GO as a predictor o f disease outcome in RA patients... 102
5.3 M U R I N E M O D E L S O F A R T H R I T I S... 104
5.3.1 In c re a se d GO in m urine m odels o f a rth ritis... 104
5.3.1.1 Spontaneous m odel o f arth ritis... 104
5.3.1.2 C ollagen induced a rthritis...105
5.3.2 Do strains o f mice prone to a u to im m u n ity have hig h er GO le v e ls ?... 106
5.3.3 D i s c u s s i o n... 108
C H A P T E R 6 L O C A L IZ A T IO N O F GO P R O D U C T IO N A T TH E C E L L U L A R L E V E L 6.1 I N T R O D U C T I O N... I l l 6.2 H U M A N L Y M P H O C Y T E S... 112
6.2.1 P erip h eral blood m ononuclear cell secretion o f GO Ig G... 112
6.2.2 S y n o v ia l f l u i d cell secretion o f GO Ig G... 114
6.2.2.1 Synovial flu id m ononuclear cells... 114
6.2.2.2 Synovial flu id derived B-cell hybridom as... 115
6.3 M U R I N E M O N O N U C L E A R C E L L S... 116
6.3.1 Ig G secretio n in m urine c u ltu r e s... 116
6.3.2.1 Spontaneous m odel o f murine arthritis...117
6.3.2.2 Induced m odel o f murine a rth ritis... 120
6.4 D I S C U S S I O N... 121
6.4.1 H u m a n L y m p h o id co m p a rtm en t secretion o f Ig G GO... 121
6.4.2 M u rin e ly m p h o id co m p a rtm en t secretion o f Ig G GO... 122
C H A P T E R 7 R E G U L A T IO N O F GO 7.1 I N T R O D U C T I O N...125
7.2 P O S T -S E C R E T O R Y M O D IF IC A T IO N O F Ig G GO... 127
7.2.1 A bsen ce o f free -ra d ic a l dam age o f de novo secreted I g G ... 127
7.3 T - C E L L C O N T R O L... 129
7.3.1 H u m a n T -c e ll c o n tr o l...129
7.3.2 M u r in e T -c e ll c o n tr o l...131
7.4 C Y T O K I N E C O N T R O L... 132
7.4.1 H u m a n Ig G sec retin g cell c u ltu r e s... 132
7.4.2 The e ffe c t o f IL -6 on m u rin e spleen cultures in v itro... 134
7.5 D I S C U S S I O N... 135
7.5.1 L a c k o f free -ra d ic a l dam age on in vitro IgG GO s e c r e t i o n... 135
7.5.2 A role f o r T-cells in Ig G GO re g u la tio n... 136
7.5.3 C y to k in e c o n t r o l... 137
C H A P T E R 8 A P U T A T IV E L IN K B E T W E E N (M Y C O B A C T E R IA L ) IN F E C T IO N A N D GO IgG 8.1 I N T R O D U C T I O N...142
8.2 H U M A N ... 143
8.2.1 S p o u s e s... 143
8.3 M U R I N E...145
8.3.1 In d u c tio n o f IgG GO changes by F reu n d 's com plete
a d j u v a n t... 145
8.3.2 E ffe c t o f in je c tio n r o u te... 147
8.4 D I S C U S S I O N... 148
C H A P T E R 9
D I S C U S S I O N
9.1 G E N E R A L D I S C U S S I O N... 152
9 .1.1 Ig G GO in healthy controls, rh eu m a to id arthritis
p a tie n ts a n d m u rin e m odels o f a r th ritis... 152
9.1.2 L ocalization a n d regulation o f agalactosyl IgG
p r o d u c t i o n...154
9 . 1 . 3 E n v ir o n m e n t in th e aetio p a th ogenesis o f R A... 156
9.2 PR O PO SED M O D E L FO R TH E R O L E O F IgG GO I N
LIST OF FIGURES
Figure 1.1 The biantennary oligosaccharide associated with IgG, showing
the linkages between the ; m onosaccharides... 28 Figure 1.2 IgG immunoglobulin domains and the positioning of the Fc
o lig o s a c c h a rid e s ... 30 Figure 1.3 The three possible terminal sugar combinations with respect to
galactose and TV-acetylglucosamine per human IgG Fc
o lig o sacch arid e c h ain ... 34 Figure 1.4 The hypothesized self association of agalactosyl IgG...38
Figure 3.1 Binding of BSII, anti-GlcNAc and RCAI to IgG of differing
g a lac to se c o n te n t...57 Figure 3.2 Immuno-dot blot standard curves of IgG samples with known
percentage GO against BSII : RCAI and anti-GlcNAc : RCAI
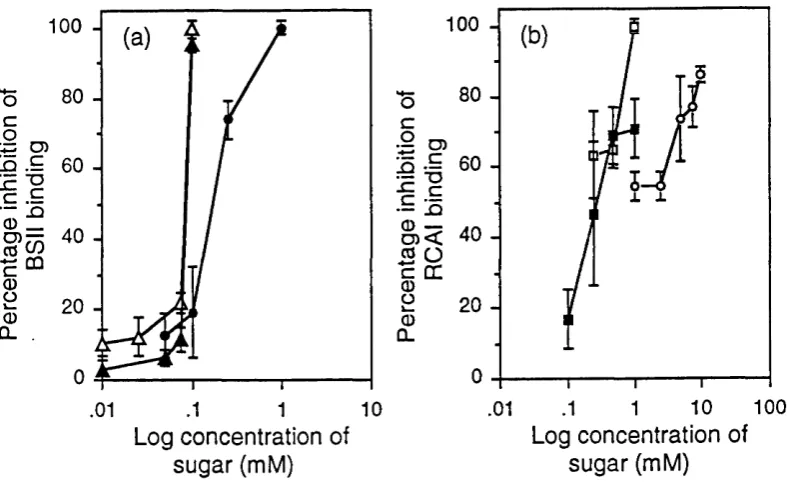
b in d in g ...58 Figure 3.3 Mean inhibition of BSII by GlcNAc, chitobiose and chitotriose
and RCAI by galactose, lactose and lactosamine binding to
dot b lo tte d Ig G ... 58 Figure 3.4 Correlation of IgG GO values obtained using the biochemical
method and the BSII : RCAI and the anti-GlcNAc : RCAI
m e th o d s ... 60 Figure 3.5 Plot of structurally determined human GO levels with the ratio of
BSII : anti-IgG binding as measured by the ELLA...61 Figure 3.6 Plot of structurally determined murine GO levels with the ratio of
BSII : anti-IgG binding as measured by the ELLA ...62 Figure 3.7 Plot of structurally determined GO levels with the ratio of
BSII : RCAI binding of standard human and murine sera diluted
to 2 p g /m l...63 Figure 3.8 Mean percentage inhibition of BSII by galactose, GlcNAc,
chitobiose and chitotriose and of RCAI by galactose, GlcNAc,
lactose and lactosamine binding to protein A captured IgG ... 64 Figure 3.9 Correlation of GO levels obtained using the immuno-dot blot
and EL L A m eth o d s... 65 Figure 3.10 Comparison of GO levels obtained from paired serum and
plasm a sam ples using the E L L A ... 65
Figure 4.1 C ontrol GO levels plotted against age... 73 Figure 4.2 Mean serum GO levels of 7 strains of mice plotted against age... 75 Figure 4.3 Mean GO levels of female and male SJL and MRL Ipr mice
p lo tte d ag ain st a g e ... 75
Figure 5.1 Age corrected IgG GO levels of serum and synovial fluids
from RA patients and disease controls... 83 Figure 5.2 Correlations between serum and synovial fluid age corrected GO
levels from RA patients and disease controls... 83 Figure 5.3 IgG GO levels in paired serum and synovial fluid from RA
patients plotted against disease duration... 84 Figure 5.4 Paired IgG GO and Log IL-6 levels from RA plasma and
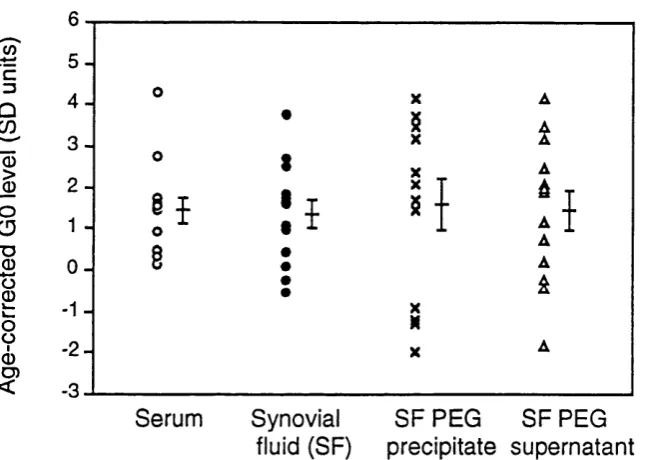
sy n o v ia l flu id s ... 85 Figure 5.5 IgG GO levels of paired serum, synovial fluid, polyethelene
glycol precipitated and supernatant synovial fluid... 86 Figure 5.6 RCAI and BSII binding to purified IgG samples of differing
GO le v e ls ... 88 Figure 5.7 Age corrected GO levels in early-onset synovitis patients plotted
ag ain st disease o u tco m e... 89 Figure 5.8 Age corrected serum GO levels from two cohorts of RA patients
p lo tted ag ain st tim e ...92 Figure 5.9 Mean age corrected GO levels of non-persistent and
relapsing/remitting or persistent RA patients with tim e... 93 Figure 5.10 Discriminant score of non-recurrent and relapsing/remitting
or persistent RA patients plotted against disease outcome... 94 Figure 5.11 Location of changes in oligosaccharide moieties on the IgG
m o le c u le ... 100 Figure 5.12 Serum IgG GO levels of CBA/Ca, MRL +!+ and MRL Ipr
mice at three and six months o f age... 105 Figure 5.13 Serum IgG GO levels of DBA/1 mice injected with PBS or
c o lla g e n type I I ... 106 Figure 5.14 Mean serum GO levels of 11 mouse strains at two months of age 107
Figure 6.1 GO levels of PBMC PWM culture secreted IgG from healthy
controls and rheumatoid arthritis patients... 113 Figure 6.2 Age corrected IgG GO levels of PWM culture secreted and
Figure 6.3 Age corrected, PWM cultured PBMC secreted IgG GO
levels from patients on 1st, 2nd and 3rd line drugs... 114
Figure 6.4 Age corrected GO levels of RA patient SFMC cultured in vitro
w ith P W M ... 115 Figure 6.5 Age corrected IgG GO levels of IgG secreted in vitro from
16 B-cell clones derived from 2 RA patients... 116 Figure 6.6 Concentration of secreted IgG 4 and 8 day cultures of DBA/1
and MRL Ipr spleen cells and MRl Ipr bone marrow cells... 117 Figure 6.7 Different MRL Ipr lymphoid compartment spontaneous secretion
o f IgG and IgG GO lev els... 118 Figure 6.8 CBA/Ca lymphoid compartment spontaneous secretion of
IgG and IgG GO le v e ls... 119 Figure 6.9 DBA/1 control and arthritic lymphoid compartment spontaneous
secretion of IgG and IgG GO lev els... 120
Figure 7.1 Percentage change in secreted IgG GO level on addition of
control T-cell enriched PBMC populations to RA B-cell enriched PBMC and the addition of RA T-cell enriched PBMC
populations to control B -cell PB M C ... 130 Figure 7.2 The effect of adding autologous or allogeneic T-cell enriched
PBMC populations to control B-cell enriched PBMC on secreted
IgG GO le v e ls ... 131 Figure 7.3 GO level of serum IgG from PBS and anti-CD4 injected NZB
m ice w ith tim e ... 132 Figure 7.4 Scatter of secreted IgG GO levels, of splenic cultures from
arthritic and non-arthritic male DBA/1 mice cultured with LPS
± I L - 6 ... 135
Figure 8.1 Age corrected GO levels of RA probands, relatives with RA
and healthy re la tiv e s ... 144 Figure 8.2 (a) Age corrected GO levels of RA probands and spouses... 144
(b) Age corrected GO levels of RA probands and spouses
p lo tted against each o th e r...145 Figure 8.3 Changes in serum IgG GO levels of groups of CBA/Ca and
BALB/c mice injected with PBS or an emulsion of FCA : PBS
w ith tim e ... 146
Figure 8.4 Changes in serum IgG GO levels of groups of CBA/Ca and
BALB/c mice injected with FCA : PBS by different routes with time... 148
LIST OF TABLES
Table 3.1 Coefficients of variation for the binding of BSII and RCAI
to dot b lo tted Ig G ... 59 Table 3.2 Coefficients of variation for the binding of BSII and anti-IgG
to protein A captured Ig G ... 66
Table 4.1 Ten year age-grouped mean GO levels of female and male
healthy co n tro l in d iv id u als... 74
Table 5.1 Mean GO levels in sera and synovial fluids from RA patients
w ith different disease activities... 84 Table 5.2 Mean BSII : RCAI binding values for serum, synovial fluid
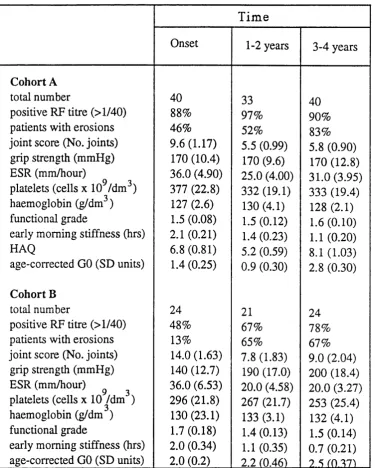
(SF), SF PEG precipitate and supernatant IgG heavy chains... 87 Table 5.3 IgG GO and RF levels of early-onset synovitis patients...89 Table 5.4 Mean clinical and serological parameters of RA patient cohorts
A and B ... 91 Table 5.5 DFA cumulative Rao's V values for prediction of disease
outcom e on RA patient cohort A ... 93 Table 5.6 Mean odds ratio for outcome of disease based on various clinical
and lab o rato ry p aram eters...95
Table 7.1 Mean stimulation index of PBMC cultures with PWM ±
free-radical scavengers at different concentrations... 128 Table 7.2 Mean GO levels of PBMCs cultured with and without the
free-radical scavenger vitam in C ... 128 Table 7.3 Percentage cells staining positive for B-cell, T-cell and monocyte
markers using FACS analysis in populations o^t SRBC treated
P B M C ... 129 Table 7.4 The mean secreted IgG concentration and GO levels of three
human IgG secreting cell lines with time in culture... 133 Table 7.5 The mean secreted IgG concentration and GO level from the HB-1
cell line split every three days with time in culture... 133 Table 7.6 The effect of exogenous addition of IL-6 on secreted IgG GO
levels from the HB-1 cell line... 134
Table 8.1 Mean area under the curve for serum IgG GO changes with time from groups of mice injected with PBS or FCA : PBS
A B B R E V I A T I O N S
ACR American College of Rheumatology
APC Antigen presenting cell
ARA American Rheumatism Association
Asn Asparagine
BIG Carbonate/bicarbonate buffer
BSA Bovine serum albumin
BSII Bandeiraea simplicifolia lectin
C Complement
oC Degrees centigrade
CD Cluster of differentiation
Ch Constant region of immunoglobulin heavy chain
CIA Collagen induced arthritis
Cl Constant region of immunoglobulin light chain
CNBr Cyanogen bromide
CO2 Carbon dioxide
DE52 Diethylaminoethyl cellulose 52
DFA Discriminant functional analysis
Dol P Dolichol phosphate
EBV Epstein Barr virus
EDTA Ethylenediaminetetraacetic acid
ELISA Enzyme linked immunosorbant assay
ELLA Enzyme linked lectin assay
ER Endoplasmic reticulum
EMS Early morning stiffness
ESR Erythrocyte sedimentation rate
Fab Antibody binding fragment
F(ab’)2 Divalent antigen binding fragment
FACS Fluorescence activated cell sorter
Fc CrystaUizable fragment
FcR Receptor for the Fc region of immunogloblin
FCA Freund's complete adjuvant
FCS Foetal calf serum
Fug Fucose
8 Gravity
Gal Galactose
GalTase ^ 1,4-galactosyltransferase
Yg gamma globulin
GlcNAc jV-Acetylglucosamine
Gin Glutamine
GM-CSF Granulocyte/monocyte colony stimulating factor G nT -m A^-acetylglucosaminyltransferase III
GPI Glycosyl phosphatidylinositol
H-2 (q, r) Mouse major histocompatability complex
HAQ Health assessment questionaire
HLA-DR/Dw Human leucocyte antigen-human major histocompatability molecules
HRP Horseradish peroxidase
J125UDR lododeoxyuridine
IFNy Interferon y
Ig Immunoglobulin
IL Interleukin
IL-2R Interleukin 2 receptor
He Isoleucine
JCA Juvenile chronic arthritis
kDa Kilodalton
KPi Potassium phosphate buffer
LPS Lipopolysaccharide
mA milhampere
Man Mannose
MEM Minimal essential medium
mg Milligram
l^g Microgram
MHC Major histocompatability complex
ml Millilitre
M R L Ipr MRL Ipr/lpr
mRNA Messenger ribonucleic acid
Neu5AC A-acetylneuraminic acid (sialic acid)
NS No significant difference
OA Osteoarthritis
œ Optical density
PBMC Peripheral blood mononuclear cells
PBS Phosphate buffered saline
PEG Polyethelene glycol
Pg Picogram
Phe Phenylalanine
PWM Pokeweed mitogen
RCAI Ricinus communis agglutinin
RER Rough endoplasmic reticulum
RF Rheumatoid factor
rmm Relative molecular mass
SD Standard deviation
SDS-PAGE Sodium dodecyl sulphate polyacrylamide gel electrophoresis
SEM Standard error of mean
Ser Serine
SF Synovial fluid
SFMC Synovial fluid mononuclear cells
SEE Systemic lupus erythematosus
SOD Superoxide dismutase
(n)SRBC (neuraminidase treated) Sheep red blood cells
T Polyoxyethylene sorbitan monolaurate (Tween)
TEMED Tetramethyl-ethylenediamine
TB Tuberculosis
TGFp Transforming growth factor p
Thr Threonine
T N F a Tumour necrosis factor a
UDP Uridine diphosphate
UV Ultraviolet
VBS Veronal buffered saline
Vh Variable region of immunoglobulin heavy chain
Vl Variable region of immunoglobulin light chain
v/v Volume/volume
w/v Weight/volume
A CKNO W L E D G E M E N T S
This work would not have been possible without Professor Ivan Roitt, whose invaluable comments and tuition have taught me to question in the pursuit of excellence. I also wish to thank him for the opportunity to study and work in his laboratory and for enthusing me with the excitement of medical research.
I would like to thank Dr Nazira Sumar for my 'start' in this field and for all her help and friendship through the years. Also Professor Peter Lydyard and Dr Peter Delves for their large contribution to this project
A special thank you goes to Dr Adam Young for many serum samples and even more statistical help and also to Professor David Isenberg for a constant stream of samples on demand and a long complicity in this field. Thanks also to Dr Loma 'mother' MacKenzie for teaching me all I know about tissue culture, to Pari Jeddi for shared experiments, Paddy Hutchings and Paul Levy for technical assistance. Dr Kim Dawe for the moans and groans, Colin Shapland and Professor Tom Rademacher for help and advice and to everyone in tlie department of Immunology, UCLSM for making life/work/studying such fun.
A thank you for further statistical advice from Dr Simon Tliompson and Dr Steven Pike at the London School of Hygiene and Tropical Medicine and Dr Tom Feam at the
department of Statistics, UCL.
A huge debt of gratitude goes to my mother, without whom I would never have started, for all her encouragement and friendship throughout the years and also to my father for so much stability and the long suffering patience of a saint.
CHAPTER 1
G EN ER AL IN T R O D U C T I O N
1.1 R H E U M A T O ID A R T H R IT IS A N D Ig G
1.1.1 R h e u m a to id a rth ritis
1.1.1.1 Human rheumatoid arthritis
Rheumatoid arthritis (RA) is the commonest of a group of chronic inflammatory diseases with autoimmune manifestations. This important group of diseases includes Hashimoto's thyroiditis, Grave's hyperthyroidism, juvenile onset (type I) diabetes, systemic lupus erythematosus and Sjogren's syndrome. Rheumatoid arthritis is a disorder of as yet unknown aetiology that is dominated by debilitation associated with progressive destruction of synovial joints. The prevalence of RA ranges between 0.3% and 3.0%, with a most common onset age of 16 to 50 years of age (Brostoff et al 1991). No aetiological agent or primary antigen has yet been implicated in the genesis of RA. It is currently thought that interplay among genetic factors, sex hormones and an infectious agent initiates an autoimmune disease with inflammatory and destructive features (Maini and Feldmann 1994).
Evidence for predisposition is derived from studies of the major histocompatability complex (MHC) class II molecules, indicating that the relative risk of developing RA is several times greater in individuals who inherit HLA-DRl or -DR4, specifically the subtypes Dw4 and D w l4 (Roitt 1994). There is a strong link between hormones and RA: The disease is three times as common in women as in men; is often precipitated by pregnancy; improves through pregnancy and usually occurs after menarche and before menopause. Stress has also been implicated (but not explained) in the precipitation of RA (Soloman 1981).
cartilage. The synovial membrane which surrounds and maintains the joint space becomes intensely cellular as a result of considerable immunological hyperactivity as evidenced by large numbers of T-cells, mostly CD4, in various stages of activation, usually associated with dendritic cells; there is also an abundance of macrophages bearing activation markers. Clumps of plasma cells are frequently observed and sometimes even secondary follicles with germinal centres are present (Roitt 1994). The synthesis of immunoglobulins by the synovial tissue ranks with that of a stimulated lymph node (Smiley et al 1968) which may lead to the formation of immune complexes; these complexes can be eluted from RA synovial tissue and are capable of fixing complement. Stabilization of these complexes by IgM and complement in the joint space may initiate an Arthus reaction and lead to an influx of polymorphs with which they react to release reactive oxygen intermediates and lysosomal enzymes. These include neutral proteinases and collagenase which can damage the articular cartilage by breaking down proteoglycans and collagen fibrils. If complexes are adherent to the cartilage, on binding the polymorph is unable to internalize them and releases lysosomal hydrolases into the space between the cell and cartilage where they are protected from enzyme inhibitors such as «2-
macroglobuhn. These aggregates may also directly stimulate the macrophage-like cells of the synovial hning through their surface receptors or indirectly through phagocytosis. Perhaps of even greater importance are the large number of activated T-cells whose secretion of cytokines and growth factors such as TNFa and GM-CSF will also stimulate and drive the cells involved in pannus development. As a result of these combined cellular activation factors, the synovial cells grow out over the cartilage and at the margin of this granulation tissue breakdown can be seen, almost certainly as a result of the release of enzymes, reactive oxygen intermediates, prostaglandins and especially of EL-1, IL-6 and TNFa. Activated macrophages also secrete plasminogen activator and the plasmin formed as a consequence activates a latent collagenase produced by synovial cells. The secreted products of the stimulated macrophage can activate chondrocytes to exacerbate cartilage breakdown, and osteoclasts to bring about bone resorption which is a further complication of severe disease.
1.1.1.2 Murine models o f arthritis
Animal models of arthritis are often used to mirror human disease allowing the freedom to have a closer and more indepth look at how this imperfectly understood disease works. Several different types are available, including rat, murine, spontaneous and induced. Induction of arthritis can be achieved by injecting susceptible strains with a variety of arthritogens including Freund's complete adjuvant into rats (Pearson et al 1956), collagen type n (Holmdahl et al 1990) and pristane (Wooley et al 1989) into mice. FCA alone has also been shown to induce arthritis in mice (Knight et al 1992). The resulting incidence of arthritis depends on a variety of factors including the route of administration of the arthritogen, the administration protocol and the strain used. Spontaneous arthritis is
observed in several strains of mice including the MRL Ipr/lpr (MRL Ipr), DBA/1 and NZB mice (Hang et al 1982, Nordling et al 1992, Nakamura et al 1991). These forms of arthritis are usually slower in onset than the induced models with the exception of the MRL Ipr, which shows signs of an arthritis by three months of age (Hang e ta l 1982). Several environmental factors are thought to play a role in the development of
spontaneous and induced arthritis, such as how 'dirty' or 'germ free' the environment is, the stress levels of the animals (i.e. if kept in aggressive conditions like mixing males from different litters, the incidence of arthritis will be greater and with a faster onset) and hormonal levels (Waites and Whyte 1987, Holmdahl et al 1992).
The arthritis seen in MRL Ipr mice occurs secondarily to a lupus like autoimmune disease at about five months of age (Tarkowski e ta l 1987) and is characterized by circulating rheumatoid factor, immune complexes and joint damage consisting of early proliferation of synovial cells followed by lymphoid pannus formation (Cohen and Eisenberg 1991); there is however, scarce expression of MHC class II antigens in the synovium and no infiltration of lymphocytes into the joints (Taikowski et al 1987). Tlie early stages of synovial pathology are usually seen at 3-4 months of age consisting of minimal
destructive changes, by 4-5 months an aggressive destructive process is present and at 5- 6 months of age extensive joint derangement and articular cartilage destruction has occurred (O'Sullivan et al 1985). The Ipr gene represents a retrotransposon integration into an intron of CD95 (fas), a molecule involved in ap op to tic signalling (Chu et al 1993) which results in multiple autoantibodies and the progressive accumulation of large
numbers of non-malignant CD4'CD8' T-cells in the lymph nodes and spleen, immune- mediated tissue damage and premature death. Although MRL Ipr T-cells can provide functional help for MRL Ipr B-cells, they show an imbalance in their cyokine production profile (Cohen and Eisenberg 1991, Murray et al 1990, Palacios 1984, Patraca et al
1990, Prud'homme et al 1983, Wofsy e ta l 1981), poor in vitro responsiveness to T-cell antigenic and mitogenic stimuli (Altman e ta l 1981, Davignon e ta l 1988, Fischbach etal
1984) and poor allogeneic mixed lymphocyte reactions (Altman et al 1981). The B-cell defects associated with this strain include abnormal activation (Dziarski et al 1985), increases in serum immunoglobulin (especially IgG) and the appearance of high titres of autoantibodies (Andrews et al 1978) to a wide variety of antigens (Cohen and Eisenberg
1991). Defects in other cell types from this strain have also been reported, including enhanced activation of peritoneal macrophages (Dang-Vu et al 1987) and decreased responsiveness of neutrophils (Gresham et al 1991).
Collagen induced arthritis was first described in mice by Courtney et al in 1980.
It is maximally induced in mice with the H-24 or H-2^ haplotype which include DBA/1, BIO and BUB and by using heterologous (bovine, rat or chick) collagen type II (Wooley
move to the T-cell dependent area of the draining lymph nodes, activating antigen specific T-cell clones (Matsuno et al 1991). Overall, however, a relatively weak T-cell
proliferative response in both the lymph nodes and spleen is generated (Wooley et al
1988). Conversely, a strong and rapid B-cell activation in primary response to
immunization with collagen is seen (Holmdahl et al 1990) consisting of a complex array of autoantibodies to collagen with a prolonged rise in IgG2a and IgG2b anti-collagen antibodies (Matsuno et al 1991) and the generation of some rheumatoid factor-like antibodies (Holmdahl e ta l 1987). The timing of disease onset is varied and may depend upon the immunization protocol. Usually, after about four weeks some mice show apparent arthritic symptoms, whilst at about six weeks, severe joint swelling and erythema with or without joint deformity is seen in most mice. By eight weeks joint deformity and distinct inflammatory signs are observed (Matsuno e ta l 1991, Wooley 1988). Immunohistopathologic analyses of joints reveals similarities with human rheumatoid joints including large numbers of MHC class II antigen expressing
macrophage-like cells with infiltration of activated CD4+ T-cells (Holmdahl et al 1991). Both anti-collagen type II specific T-cells and anti-coUagen type II auto antibody
containing sera from arthritic mice have been shown to transfer the arthritis to naïve recipients (Kakimoto e ta l 1988, Stuart and Dixon 1983).
1.1.2 Im m u n o g lo b u lin s a n d rh eu m a to id arthritis
There is a large B-cell involvement in RA including increased immunoglobulin secretion by both circulating peripheral blood and synovial fluid B-cells (Bell and Pinto 1984). In addition to a raised frequency of autoantibodies to a wide range of non-organ specific antigens, including single stranded DNA, histones, cytoskeletal components, collagen type n and the minor cartilage collagens (types V, VI and IX, Jasin and Taurog 1991), the most characteristic serological feature of RA relates to anti-IgG Fc or rheumatoid factor (RF) and there is an active attraction of rheumatoid factor producing B-cell precursors towards the sites of inflammation (Moynier et al 1992). RF was first
documented by Waaler (1940) and Rose et al (1948) and it is now universally recognised that both seronegative and seropositive adult RA patients as well as various forms of juvenile chronic arthritis (JCA) patients have elevated levels of RF (Torrigiani et al 1967,
Hay e ta l 1975, Haynes et al 1986). Rheumatoid factors are defmed as autoantibodies
specific for epitopes on the Fc fragment of the IgG molecule, they may be of any immunoglobulin isotype and do not only occur in RA and JCA; high titres of IgG and IgM RF are, however, characteristic of the disease. Although IgM RF occurs in normal healthy controls as a component of the 'natural antibody' subset (Casali et al 1989), the RF in RA are distinctive in that they can be of all immunoglobulin isotypes (indicating T- cell participation in antibody class-switch, Gioud-Paquet et al 1987), have a higher
avidity for human IgG than rabbit IgG and use the germline VhIII genes more frequently than other V h genes (Hay et al 1991). RA IgG RF is somatically mutated (in comparison to monoclonal RF which use germline immunoglobulin genes) suggesting maturation either by specific antigen stimulation or other activation signals such as cytokines (Hay et al 1991). A bias towards particular IgG subclasses has been seen in the RA synovium (Munthe and Natvig 1972) and more recently IgG secreting B-cells in the RA joint have been shown to over-represent certain subclasses and light chains of IgG (Brown et al
1990) indicating that the B-cells are under an, as yet unidentified selective influence. The presence of IgG RF has special significance in that IgG, being both antigen and antibody, can self-associate to form immune complexes capable of binding IgM rheumatoid factor and complement Substantial evidence favours the view that RF
contribute to tissue injury including the fmding that they are a prominent constituent of the immune complexes in the sera, the synovial fluid and polymorphs of RA patients. In fact, up to 90% of synovial B-cells have been shown to be making RF (Youinou et al
1984). These complexes in turn can activate the acute inflammatory reaction which gives rise to synovial effusions and contributes to pannus formation through immune complex activation of synovial fluid macrophages as described earlier. RF's are largely the
product of the B 1 subset of B-cells mostly expressing the CD5 marker (usually expressed on T-cells and 5-20% of circulating B-cells in normal adults, Calvanico 1993) and this subset of B-cells is increased in RA patients (Plater-Zyberk et al 1985). CD5+ B-cells from healthy controls can be stimulated by EB V to produce RF and limiting dilution analysis revealed that many of the CD5+ B-cells are committed to the production of antibodies with RF-like activity (Casali et al 1987). Another important feature of CD5+ B-cells with RF on their surface is that they may act as antigen presenting cells through binding to IgG complexes thereby capturing antigen for processing and presentation to T- cells.
1.2 Ig G S T R U C T U R E A N D G L Y C O S Y L A T IO N
1.2.1 Ig G S tru c tu re
Immunoglobulin G is possibly the most interesting immunoglobulin class in RA, since it is able to act as both antigen and antibody in the formation of immune complexes. The increased levels of IgG in the sera and synovial fluid of RA patients, along with increased immune complexes, has led to many searches for a structural cause within the IgG
Early studies showed the bulk of antibody activity in serum to be in the slow
electrophoretic fraction termed y-globulin (subsequently immunoglobulin). In 1959 Porter (1959) showed that the rabbit y-globulin molecule could be split, by the action of papain into two Fab (antigen binding) and one Fc (crystallizable, complement and cell binding) fragments and that the immunoglobulin molecule was composed of two heavy and two light chains. Each of the heavy chains in rabbit IgG folds into three domains (designated CrI, Cr2 and Cr3), and each domain consists of a 'sandwich' of two anti parallel p-sheets. These domains have subsequently been defmed as immunoglobulin domains and are conserved throughout a large variety of cell surface molecules including the T-ceU receptor and cell adhesion molecules CD4 and CDS. Such molecules are consequently defmed as containing 'immunoglobulin like' domains and are part of the immunoglobulin supergene family.
Porter also showed that the major glycosylation site of IgG was within the Fc, where it is now known that all five classes of human (and probably other species) immunoglobulin contain carbohydrate. Interestingly, there is considerable homology in the exact sites of substitution of the Fc piece with the carbohydrate units, which suggests that the necessary aminoacid sequences allowing oligosaccharide attachment have been highly conserved and points to an important structural and functional significance of the presence of carbohydrate. Light chain glycosylation is far less conserved and nearly always falls in the variable region since no potential glycosylation site is contained on the constant region of the light chain. However, 15% of IgG light chains in human sera are glycosylated (Wright and Morrison 1993).
Any given human serum IgG molecule contains, on average 2.8 iV-linked
oligosaccharides of which two are invariably located in the Fc attached to asparagine 297. This asparagine residue is to be found on a sharp bend between two adjacent strands of p- sheet at the end of the Ch2 domain distant from the Ch3 domain, in the sequence Gln- Gln-Phe-Asn-Ser-Thr-He (Sutton and Phillips 1983). The attached oligosaccharide is a biantennary complex type oligosaccharide with the basic structure:
Neu5Aca2“ 6G alpl— 4G lcN A cpl—2M anal
\ (F u cal)
6
I
(GlcNAcpl)— 4M anpi— 4GlcNAcpi— 4GlcNAc 3
Neu5Aca2— 6G aipi— 4G lcN A cpl—2 M a n a l^ ^ ^
Figure 1.1 The biantennary oligosaccharide associated with IgG, showing the linkages between the monosaccharides where Neu5Ac = siahc acid. Gal = galactose, GlcNAc = TZ-acetylglucosamine, Man = mannose and Fuc = fucose.
Another distinctive feature of IgG oligosaccharides is their structural multiplicity. The presence of sialic acid is unusually low in IgG with only 24-25% of chains being
terminally sialylated (Kobata et al 1989). More variety is afforded to Fc oligosaccharides by the presence or absence not only of terminal sialic acid (only present on approximately
10% of Fc oligosaccharides), but also of the presence of a fucose attached to the first GlcNAc residue and the presence of a bisecting GlcNAc on the first mannose residue (depicted in brackets in figure 1.1). This bisecting GlcNAc is n o t, however, present on murine IgG Fc oligosaccharides (Mizuochi et al 1987). More importantly, galactose may or may not be present on either arm and GlcNAc is seen to be missing from one arm in some molecules. In all, up to 22 glycoforms of IgG Fc oligosaccharides have been shown to exist in human serum IgG (Parekh et al 1985). This large number of different structures associated with IgG is not a result of studying a polyclonal population, since similar heterogeneity was found upon analysis of myeloma and hybridoma IgG
(Mizuochi et al 1982, Rademacher et al 1986, Takahashi et al 1987). The non-conserved light chain oligosaccharide chains are also reported to show microheterogeneity and assymetry in attachment (i.e. they may be present on one Fab and not on the other). Increased amounts of sialic acid have also been reported on Fab associated carbohydrate moieties along with increased levels of bisecting GlcNAc when compared to the Fc (Wright and Morrison 1993).
Crystallographic studies of IgG Fc fragments have shown that, unlike other
immunoglobulin domains, the two Cy2 domains do not interact directly. The resulting interstitial region accommodates the complex oligosaccharides attached to asparagine 297 on each heavy chain such that one of the a - 1,3 arms interacts with the trimannose core of the opposing oligosaccharide. The a(I-6) antenna of each oligosaccharide interacts with the hydrophobic and polar residues on the domain surface (Opdenakker et al 1993). Unusually for glycoproteins, these conserved Fc oligosaccharide moieties are relatively inaccessible, being buried within the IgG molecule, and are postulated, by their
positioning (and association with each other), to hold the two Cy2 domains apart helping to maintain biological activities of the Fc (Rademacher et al 1983) as depicted in figure
Antigen binding
Fab
Light chain
Heavy chain
Figure 1.2 IgG immunoglobulin domains and the positioning of the Fc oligosaccharides, where Cy and CL = the constant domains of the IgG heavy and light chains respectively, VH and VL = the variable regions of the heavy and light chains respectively a n d ^ # # * = Fc oligosaccharides.
1.2.2 O ligosaccharide assem bly
Only a few side chains of the aminoacid residues usually found in proteins are suitable for the attachment of a mono- or oligosaccharide including asparagine, serine, threonine, hydroxylysine, hydroxyproline, tyrosine, glutamic acid, aspartic acid, cysteine (Hughes
1983, Dwek et al 1993) and more recently tyrosine (Lis and Sharon 1992).
A very common linkage involves the 0(1) of monosaccharide and the nitrogen of the amide group of asparagine, after which the sugar residue forms the point of attachment of other monosaccharides.
The carbohydrate chains attached to polypeptide in this fashion are V-glycans (or N - linked glycans). The main alternative form of attachment is 0 -linkage, which involves the the attachment of monosaccharides through C (l) by glycosidic bonds to the oxygen of the hydroxylated side chains of serine, threonine, hydroxylysine, hydroxyproline or tyrosine. Another form of linkage has been shown, where the carbohydrate is attached to the C-terminal aminoacid of the protein via ethanolamine phosphate and is called the glycosyl-phosphatidylinositol (or GPI) anchor. This linkage is not strictly a
glycosylation process since the sugar is not bound to the polypeptide chain by a glycosidic linkage. V-linked oligosaccharides are the most common type found on glycoproteins and were thought to be acetylglucosamine attached to asparagine. Now,
however, acetylgalactosamine, glucosamine and L-rhamnose as well as
acetylglucosamine have been shown to be //-linked (Lis and Sharon 1992). In an individual glycoprotein, more than one carbohydrate unit is often present, attached at different positions by either an O - or / / -linkage or both and partial site-occupancy, where a potential N - o v O -linked glycosylation site on the protein backbone may or may not be occupied, is also observed. Moreover, each attachment site frequently
accommodates different glycans, a phenomenon referred to as site heterogeneity. This means that a glycoprotein is isolated, not as a single structural entity, but as a set of glycosylated variants of a common polypeptide creating discrete subsets or glycoforms of a glycoprotein. All classes of human immunoglobulins have heavy chain N -linked carbohydrates, but the position and type (whether the carbohydrate is complex or simple) varies considerably. IgAi and IgD also contain 0-linked sugars in the hinge region of the molecule. IgA l has two N- and 5 0-linked oligosaccharides sites whereas IgD contains three N~ and four O-linkage sites (Woof and Amin 1994). Furthermore, the two
allotypes of IgA% have different potential A^-glycosylation sites (Kerr 1990). IgM contains at least five //-linked oligosaccharides per monomer, two of which are simple and three complex oligosaccharides (Shimizu et al 1971). IgE has six //-linkages (Woof and Amin 1994) containing complex and simple structures (Winkelhake 1978).
Protein //-glycosylation starts with the assembly of an oligosaccharide core precursor which takes place in the endoplasmic reticulum (ER) on the lipid carrier dolichol phosphate (Dol-P). Sugars are added in a stepwise fashion with the first seven sugars (two GlcNAc and five mannose residues) derived from the nucleotide sugars, UDP- GlcNAc and GDP-mannose, followed by another seven sugars (four mannose and three glucose) derived from the lipid intermediates, Dol-P-mannose and Dol-P-glucose. The actual site of the first set of lipid linked oligosaccharides is not fully understood since nucleotide sugar donors are unable to pass through the Hpid büayer. Evidence has accumulated, however, for the existence o f proteins which mediate the transport o f sugar nucleotides across the membranes of the endoplasmic reticulum allowing assembly within the lumen (Lis and Sharon 1993). Otherwise it is thought that the first seven may be added on the cytoplasmic surface of the ER, transferred across to the luminal surface and the second seven added there (Komfeld and Komfeld 1985). Once assembled, the oligosaccharide core precursor is transferred to the nascent protein backbone in the rough endoplasmic reticulum (RER) under the control o f oligosaccharyltransferase. A series of glucosidases and mannosidase trim terminal sugars from the structure before it is
two more mannose residues and a subsequent addition of another GlcNAc. At this stage fucosyltransferase may act to transfer a fucose residue to the innermost GlcNAc on the oligosaccharide. The final steps occur in the trans Golgi cistemae and consist of addition of outer chain galactose and sialic acid residues catalyzed by galactosyl- and
sialyltransferases. The newly synthesized glycoproteins then exit the Golgi and are transported to their final destination (Komfeld and Komfeld 1985).
The timing of these glycosylation events in relation to heavy and light chain association and formation of disulphide bonds between these IgG subunits has been suggested to be of considerable importance. It is thought that heavy and light immunoglobulin chains are synthesised and partially assembled on separate polyribosomes, carbohydrates then being added to the molecule in the RER. The chains then enter the cistemae of the ER and the four chain molecule is formed in the cisternal space. The order of disulphide bond formation is reported to vary between immunoglobulin subclasses; for example human IgM is reported to produce disulphide bonds between heavy and light chains before those between the two heavy chains, whereas the reverse is reported for human IgG. The completed molecule is then transported to the Golgi complex where the final
carbohydrates are added (Hughes 1983). This timing of interchain association may explain why no reports of agalactosyl IgM Fc oligosaccharides have been made in comparison to IgG (see below). In other words, since the two heavy chains are linked together sooner in IgG than in IgM molecules (thereby making the Fc oligosaccharide less accessible sooner), there is less opportunity for terminal glycosylation to occur.
1.3 A B N O R M A L IT IE S I N Ig G O L IG O S A C C H A R ID E S
The microheterogeneity of serum IgG oligosaccharides of healthy individuals suggests that changes in glycoform are a normal part of glycoprotein glycosylation. Indeed other glycoproteins such as enzymes like ribonuclease B, cell surface carbohydrates like leukosialin and other cell surface molecules such as CD45 have been shown to vary their glycoforms upon activation or stimulation or with maturation (Rudd et al 1994, Filler et al
1988, Pulido and Sanchez-Madrid 1990, respectively). Recently, an increasing number of diseases have been associated with glycosylation changes of glycoproteins. For example the tumour product alpha-fetoprotein, gastric mucin in RA, the serum glycoprotein a2-macroglobulin in RA and S E E , acute phase proteins a 1-acid glycoprotein and a 1-protease inhibitor in severely burned persons and al-acid
glycoprotein in RA, SEE and ankylosing spondylitis (Taketa 1990, Finnen et al 1988, Silvestrini et al 1989, Pos et al 1990, Mackiewicz et al 1987, Mackiewicz et al 1989
respectively),! all show unusual changes implying an important role for glycobiology in disease.
1.3,1 A g ly c o sy la te d Ig G
Human IgG molecules completely lacking Fc oligosaccharides have not been described as naturally occuring glycoforms of IgG either in healthy subjects or in patients with
disease, underlying the importance and conservation of these structures within the Fc. Some groups, however, have artificially removed the carbohydrate from the molecule. This can be done using glycosidases or by culturing IgG secreting hybridoma cells in the presence of the TV-linked oligosaccharide inhibitor tunicamycin to investigate which IgG functions require carbohydrate (Walker e ta l 1989). These experiments have been more widely conducted in animal models using both the above techniques. Glycosidase digestion is usually done in sequence since some of the monosaccharides cannot be removed unless they are in a terminal position on the oligosaccharide chain (Koide et al
1977, Murray et al 1988), however, a single step hydrolase has been used (Winkelhake et al 1980). Aglycosyl IgG produced by tunicamycin inhibited hybridomas and
plasmacytomas are also widely described using animal models (Nose and Wigzell 1983, Leatherbarrow et al 1983, 1985, Heyman et al 1985, Lund et al 1990).
1.3.2 A g a la cto sy la ted Ig G
1.3.2.1 Human agalactosyl IgG or 'GO'
Naturally occuring abnormalities in the glycosylation of IgG were reported as long ago as 1974, when Johnson et al showed altered patterns of circular dichroism (a
Gal Gal Gal
GlcNAc GlcNAc GlcNAc GlcNAc GlcNAc GlcNAc
G 2' G l ' 'GO'
Figure 1.3 The three possible terminal sugar combinations with respect to galactose (Gal) and //-acetylglucosamine (GlcNAc) per human IgG Fc
oligosaccharide chain.
Thus, a measure of 'GO' would be the percentage of oligosaccharide chains completely lacking galactose and the description 'agalactosyl' IgG most usually refers to
oligosaccharide chains terminating as GO'.
In 1988, on closer inspection of the osteo- and rheumatoid arthritis patient levels of agalactosyl IgG, Parekh et al (1988a) showed that this glycoform occun*ed as a function of age within the healthy control population and that the osteoarthritis patients levels fell within this range. Interestingly, GO levels have been found to fluctuate within the control population and maximally during pregnancy. The levels fall throughout pregnancy and then rise quite dramatically post partum to levels higher than before conception (miiToring disease activity very closely in the case of RA patients) suggesting a possible hormonal control of this defect (Rook et al 1991a). Since then, raised IgG GO levels have been shown to exist in a limited number of diseases including juvenile chronic arthritis
(Mizuochi e ta l 1982, Parekh e ta l 1988b, Bahr e ta l 1990, Sumar e ta l 1991a, Tsuchiyaet al 1993), tuberculosis (Parekh e ta l 1989, Tsuchiya e ta l 1993, Rook et al 1994), Crohn's disease (Parekh et al 1989, Pekelharing et al 1988, Parkkinen 1989, Dube et al 1990, Tsuchiya et al 1993), Castleman's disease (Nakao et al 1991), some cases of systemic lupus erythematosus (Parekh e ta l 1989, Tomana e ta l 1988, Tsuchiya et al 1993), Sarcoidosis (O'Connor et al 1992a) and leprosy patients with erythema leprosum
nodosum (Filley et al 1989) as well as RA (Parekh et al 1985, Tomana et al 1988, Sumar
et al 1990). Furthermore, studies on IgG subclasses from RA patients have shown that
the increased levels of agalactosyl IgG are seen in IgGi, IgG% and IgG4 with the most significant difference from control IgG in the IgG2 fraction (Tsuchiya et al 1994). It was, perhaps unexpected, that raised levels of IgG GO were not seen in all inflammatory diseases, since normal levels were recorded in patients with most other forms of leprosy, acute rheumatic fever, klebsieUa and parvovirus infections and AIDS (Parekh et al 1989) indicating that this defect is not simply a marker for acute inflammation. It has been suggested that T-cell mediated damage and an acute phase response are required in order
for GO to be raised or involved in a disease (Rook 1988) and most current studies concentrate on the regulation and effect this defect has on the function of the IgG molecule
1.3.2.2 Murine agalactosyl IgG
The obvious question of whether similar decreases in IgG galactose levels are seen in animals and animal models of arthritis and other inflammatory diseases has been partially investigated. The earliest reports were of murine studies when in 1990, Mizuochi et al
looked at the MRL Ipr autoimmune and the congenic MRL +/+ strains of mice. This group showed that IgG Fc oligosaccharides chains lacking galactose existed in both strains but were significantly greater in the MRL Ipr mouse which also develops rheumatoid arthritis-like articular changes (as discussed earlier). The same year this finding was corroborated (Bond et al 1990) and compared to three other mouse strains; CBA/Ca, C57B1/6 and BALB/c, in which more 'normal levels' (or lower binding to a GlcNAc specific lectin) were seen in comparison to MRL +/-I- and Ipr mice. Agalactosyl
IgG was also described in two induced murine models of arthritis; male DBA/1 mice injected with collagen type II were reported to have increased IgG GO levels when
compared to controls (Jones et al 1992) and similarly Rook e ta l (1991b) showed a rise in agalactosyl IgG followed by the onset of arthritis after injection of pristane into male CBA/Igb mice. Subsequently, the presence of increased IgG GO in murine models of arthritis has been corroborated several times (Hitsumoto et al 1992, Jones et al 1992, Thompson e ta l 1992, Ghoraishian e ta l 1993, Jeddi e ta l 1994, Rademacher e ta l 1994a) emphasising the involvement of this defect in these models. Agalactosyl IgG has also been reported in Lewis rats with adjuvant induced arthritis (Yagev et al 1993) and arthritis susceptible King Charles' spaniels (Tom Rademacher, personal communication).
It is fascinating that, as with human rheumatoid arthritis patients (and healthy human controls), in mice the levels of agalactosyl IgG decrease through pregnancy, rising to what is often an all-time high post-partum (Rook et al 1991a)
1.3.3 O ther changes in Ig G carbohydrates
1.3.3.1 Glycated IgG
such as antigen-binding capacity and antibody affinity, however, were unaffected. These changes were suggested to be involved in the impairment of IgG function, leading to the increased prevelance of infection in these patients.
1.3.3.2 Sialylation changes
Abnormalities in the content of sialic acid on IgG oligosaccharides have been reported. Due Dodon and Quash showed that IgG (and IgM) from rheumatoid arthritis patients contained lower levels of terminal sialic acid and that these molecules were more likely to be involved in rheumatoid factor activity (1981). This was corroborated in a study by Casbum-Budd et al (1992). Decreased levels of IgG sialic acid have also been
demonstrated in patients with primary Sjogren's syndrome (Youinou et al 1992).
1.3.3.3 Other changes in IgG oligosaccharides
Contrary to the belief that most IgG Fc oligosaccharides contain at least one agalactosylated arm (in order to associate with the other oligosaccharide chain for maintenance of Fc conformation), IgG molecules with fully galactosylated Fc
oligosaccharides have been described (Takahashi et al 1987, Jefferis et al 1990). In the same study, the authors reported polyclonal IgG Fc oligosaccharide arms terminating in mannose. An explanation of the possible biological significances of these glycoforms is eagerly awaited. Rheumatoid IgG has also been reported to show increased binding to a variety of lectins specific for mannose. These molecules have also been shown to inhibit Fc phagocytosis more effectively than healthy control IgG samples which is suggested to be due to the increased exposure of mannose residues in rheumatoid IgG. Indeed, treatment with a-mannosidase and not p-galactosidase diminished this inhibition (Malaise
et al 1986,1987). Two murine monoclonal IgG%a antibody preparations have been
shown to contain 0-linked oligosaccharides (Coco-Martin e ta l 1992). These have also been reported on murine IgGib in the hinge region and are purported to protect the molecule from protease attack (Kim et al 1994)
1.4 Ig G G L Y C O S Y L A T IO N C H A N G E S: E F F E C T O N IgG F U N C T IO N
One o f the main areas of research into agalactosyl IgG at the moment is the effect these glycoforms may have on the function of the IgG molecule.
1 .4 .1 A g ly c o sy la te d Ig G
Only one group has reported on the effect of aglycosylation of human IgG on the function of the resulting molecule (Walker et al 1989). This group showed a decrease in FcyRI
and FcyRH mediated rosette formation (on U937 and K562 cells respectively) suggesting that interaction with Fc receptors is highly dependent on IgG Fc conformation and that the carbohydrate of the Fc serves to stabilize this conformation.
These findings have been corroborated and widened by looking at murine aglycosylated IgG. Culturing IgG-producing cell lines in the presence of tunicamycin, produces IgG which lacks several important biological functions such as decreased complement fixation and activation (Nose and Wigzell 1983, Leatherbarrow et al 1985, Heyman et al 1985) which was further described as due to a three times faster dissociation rate when
compared to glycosylated IgG rather than a decrease in binding to C lq (Leatherbarrow et al 1985). Decreases in binding to FcyR on a variety of cell types including human monocytes (Leatherbarrow e ta l 1985), macrophages (Nose and W igzell 1983, Heyman
et al 1985) and human killer cells (Lund et al 1990) have also been described, as well as a
decrease in the elimination of complexes from the circulation and antibody-dependent cellular- cytotoxicity (Heyman et al 1985, Nose and Wigzell 1983). These findings have also been mirrored in studies on rabbit aglycosylated IgG generated by culture with tunicamycin (Winkelhake et al 1980) and by glycosidase digestion (Williams et al 1973, Koide et al 1977). Unaffected properties of IgG included antigen binding of Fab fragments (Williams et al 1973, Winkelhake et al 1980, Heyman et al 1985, Nose and Wigzell 1983) and protein A binding (Heyman et al 1985, Nose and Wigzell 1983, Leatherbarrow et a/1983). These studies suggest that the N-linked oligosaccharides of IgG which occur at the conserved position in the Ch2 domain, play an important role in maintaining the integrity/conformation of the Fc for effective function.
1.4.2 A g a la cto sy la ted Ig G
Studies on the effects o f agalactosylation of IgG on Fc function and conformation of the molecule are few and of relatively recent history. Decreased Fey receptor binding by U937 cells of GO IgG have been shown (Tsuchiya et al 1989) suggesting that negative feedback immunosuppression of IgG production by B-cells and hence a continuous secretion of agalactosyl IgG may occur as a result The same group also showed that agalactosyl IgG binds less effectively to C lq and may lead to reduced clearance of
immune complexes containing this glycofom. A recent study shows decreased binding to FcyRI (on monocytes) and FcyRIII (on killer cells) leading to decreased antibody-
dependent cellular-cytotoxicity (Kumpel et al 1994) of anti-rhesus D IgG molecules with lower levels of terminal galactose. These same antibodies, however, did not show decreased binding to FcyRI on U937 cells in rosette formation assays.
Agalactosyl IgG has been postulated to increase self-association of IgG molecules (Roitt
et al 1988). This is hypothesized to be due to the exposure of a 'lectin-like' pocket on the
terminal galactose moieties of the Fab portion of neighbouring IgG molecules might then be able to associate with this 'pocket' causing auto-aggregation (figure 1.4):
Fab X Fab
Figure L4 Two models for the association of agalactosyl IgG. One involves the recognition of Fab combining sites with newly revealed epitopes on the Cy2 of the Fc (left) while the other involves the insertion of Fab oligosaccharides ( ) into the 'lectin' like pocket generated by the lack of Fc galactose. A combination of the two may also occur.
A d ap ted from R adem acher et al 1988.
A few examples of increased complex formation and autoaggregation of IgG molecules with increased levels of GO have been reported, but as of yet no large, convincing study has been published. One group showed increased GO IgG levels in synovial fluid immune complexes of RA patients when compared to the uncomplexed IgG in the same samples (Leader et al 1993, personal communication). A murine study on polyethylene glycol precipitated complexes from the sera of MRL Ipr mice showed increased
Bandeiraea simplicifolia binding (a lectin specific for terminal N-acetylglucosamine)
indicating increased amounts of agalactosyl IgG in these complexes, but also reported an increase in binding to ricinus communis agglutinin (a lectin specific for terminal
galactose). This, they suggest, could be due to an increase in exposed terminal galactose on Fab fragments which may be involved in the autoaggreation of the IgG molecules (Bond et al 1990). The most recent evidence for the pathogenicity of agalactosyl IgG comes from a study by Rademacher et al (1994a). This group enzymatically stripped IgG molecules (from collagen induced arthritic DBA/1 mice) of terminal galactose and injected them into recipients previously sensitized with denatured collagen in complete Freund's adjuvant. The arthritis produced in these animals was far more severe when these
agalactosylated antibodies were passively transferred as compared with the untreated IgG.