R E S E A R C H
Open Access
Measurement of implementation components ten
years after a nationwide introduction of
empirically supported programs
–
a pilot study
Terje Ogden
*, Gunnar Bjørnebekk, John Kjøbli, Joshua Patras, Terje Christiansen, Knut Taraldsen and Nina Tollefsen
Abstract
Background:Ten years after the nationwide dissemination of two evidence-based treatment programs, the status of the implementation components was evaluated in a cross-sectional study. The aim of the study was to pilot a standardized measure of implementation components by examining the factor structure, the reliabilities of the scores, and their association with implementation outcome variables. The aim was also to compare implementation profiles of the two evidence-based programs based on multi informant assessments.
Methods:The 218 participants in the study were therapists, supervisors, and agency leaders working with Parent Management Training, the Oregon model (PMTO), and Multisystemic Therapy (MST) in Norway. Interviewers filled in an electronic version of the Implementation Components Questionnaire during a telephone interview.
Results:The factor analysis of the eight one-dimensional subscales resulted in an individual clinical-level factor and an organizational system-level factor. Age, experience, and number of colleagues in the workplace were negatively correlated with positive ratings of the implementation process, but the number of colleagues working with the same program predicted positive ratings. MST and PMTO had different implementation profiles and therapists, supervisors, and managers evaluated some of the implementation drivers significantly differently.
Conclusions:The psychometric quality of the questionnaire was supported by measures of internal consistency, factor analyses of the implementation components, and the comparisons of implementation profiles between programs and respondent groups. A moderate, but consistent association in the expected direction was found with the implementation outcome variables.
Keywords:Implementation measurement, Implementation components, Empirically supported treatment programs, Parent management training, Multisystemic therapy
Background
Implementation is the movement of evidence-based pro-grams (EBPs) from science to practice, or the active and planned effort to mainstream a new intervention within a practice organization [1]. Implementation also describes a transition period in which practitioners become increasingly skillful, consistent, and committed in their use of a new intervention [2]. Even if new intervention programs are accepted and adopted, they are not necessarily put into practice. This is referred to as the ‘knowing-doing gap,’in which practitioners fail to do what might improve
performance and ‘substitute talk for action’ [3]. Further-more, when interventions are properly implemented they are threatened by program drift or dilution over time. The rather slow and limited success of transferring EBPs to or-dinary service, and the limited impact and sustainability of programs once adoption has occurred, have been the focus of several researchers working with implementation [4-7]. The failure of EBPs to produce expected outcomes may be attributable to the effectiveness of intervention or the qual-ity of the implementation [2]; therefore, both the program effectiveness and its implementation into regular practice should be evaluated.
In a national implementation project initiated in 1999, two treatment programs targeting conduct problems in
* Correspondence:[email protected]
Norwegian Center for Child Behavioral Development, University of Oslo, P.O. Box 7053, Majorstuen, 0306 Oslo, Norway
children and youth were disseminated across all regions of Norway. The Oregon model of Parent Management Training (PMTO) addressed families with children aged 12 years or younger [8], while Multisystemic Therapy (MST) was offered to families with juvenile delinquents in the age range of 13 to 17 years [9]. Randomized controlled replication studies were conducted of both PMTO and MST with encouraging short- and long-term clinical out-comes [10]. A retrospective case study of the Norwegian na-tional implementation of these programs was conducted after eight years [10], but no systematic implementation as-sessment system was at hand. The increased demand for implementation research has created a need for instruments measuring implementation components across programs and across different stages of implementation. In the present study, the‘measure of implementation components’ [11] was piloted on the two EBPs that had been implemen-ted in Norway over a period of ten years, making it both a validation study and a study of large scale program sustain-ability. The implementation components were evaluated by interviewing therapists, supervisors, and agency leaders working with the programs in regular practice.
Implementation research has focused on a string of vari-ables related to the process of transforming research find-ings into practice, often concluding that‘everything matters’ [12,13]. The incentives and barriers are often described in terms of attitudes (e.g., openness to change), motivation (e.g., readiness), values (e.g., learning orientation) and other characteristics of adopters, implementers, or stakeholders. Even if research has investigated which organizational structures and mechanisms that mediate or moderate implementation efforts, we still need to know more about the factors that influence organizations’ adop-tion of programs [14]. Klein and Sorra [2] recommend that rather than searching for critical determinants of imple-mentation effectiveness, researchers should try to docu-ment the cumulative influence of all the components. In the same vein, Greenhalgh et al. [1] criticized most studies for focusing on a limited number of implementation com-ponents rather than examining them more broadly. Moreover, Fixsen et al.[11] were critical of recent imple-mentation studies because the very general measures used did not specifically address core implementation compo-nents. According to Fixsen et al., some measures were pro-gram specific and lacked generality across propro-grams and some measures only indirectly examined the core imple-mentation components. In contrast, their model focuses on core components at different stages of the implementa-tion process and covers both the individual and organizational level of implementation [15].
Implementation models
Ideally, conceptual models of implementation should in-clude clearly defined constructs, a measurement model for
these constructs, and an analytical model describing the links between the constructs [1,6,15]. In linear stage models, implementation is the final stage in a two-step, one-way linear process: first from basic science to intervention development and testing and second from intervention de-velopment to implementation in real world practice set-tings. In stage models, little is said about the organizational and practice contexts. Alternatively, multi-level models of change differentiate between the large system or policy level, the organization level, the group/team level, and the individual level [16]. The component model of Fixsen et al. [4,15] combines the stage and multi-level model perspec-tives by describing the temporal progression of the imple-mentation process in six, recursive stages at individual group and organizational levels.
Implementation stages
Fixsen et al. [15] identified six stages of program tation, including exploration, installation, initial implemen-tation, full implemenimplemen-tation, innovation, and sustainability. The level and quality of implementation should ideally be measured at each of the implementation stages, and the relative importance of each implementation component should be measured and compared across stages in a pro-spective design. Full implementation is the stage when at least 50% of the positions are filled with practitioners who meet the fidelity criteria. The innovation phase occurs after one or two years of full implementation with acceptable fi-delity, and after outcomes of adaptations are carefully evalu-ated [11]. Sustainability is the final stage in which competence and integrity are maintained in the face of new challenges related to staff turnover and contextual changes. According to Fixsen et al. [17], ten years is approximately the right time to‘follow up’on implementation success or failure within an agency; this matches the timeline of the programs examined in the present study.
Implementation components
component might be overcome by strengths in others. The components and their outcomes exist independently of the quality of the program being implemented, and a good implementation strategy is of little avail without effective interventions [15].
Implementation strategies of MST and PMTO
All MST therapists have full-time positions and are mem-bers of permanent teams. They work exclusively with MST. PMTO, on the other hand, have trained therapists who de-vote 20% to 100% of their position to the treatment pro-gram and may have other responsibilities as well. PMTO is therefore established as a flexible and decentralized pro-gram service embedded in local child welfare and child mental health services. PMTO therapists outnumber MST therapists by 383 to 58. Compared to PMTO, MST has a more tightly organized team structure that consists of 23 teams in the specialist child welfare services at the county municipal level. MST was introduced in Norway by a well-organized purveyor organization, the MST Services in Charleston, which supported the implementation by con-ducting information meetings, site assessments, initial ther-apist and supervisor training, booster sessions, and monitoring of program and treatment adherence. MST Services had limited experience with implementation of the program outside of the US, and Norway was the first coun-try to implement MST on a national scale [9]. Until 1999, PMTO had almost exclusively been applied for research purposes at the Oregon Social Learning Center. Although it had been developed and evaluated for efficacy, no comprehensive implementation strategy or dissemination organization was established for the program. When invited to implement PMTO nationwide in Norway, the developers in collaboration with the Norwegian implementation team worked out an implementation strategy and model that later has been used in other large scale implementations of the program [8,20]. Compared to MST, PMTO had more therapists and more sites (agencies and organizations) adopting the program, and also greater variations in the time available for each therapist to deliver program services. This greater program context and therapist heterogeneity may account for the greater variations in the assessments of the PMTO implementation see also [21]. In sum, the differ-ences in implementation profiles between the two programs were likely due, in part, to the more uniform implementa-tion strategy of MST.
In the present study, the implementation components were measured retrospectively ten years after the introduc-tion of MST [22] and PMTO [20] in Norway. To the authors’ knowledge, few countries have had such a long-term and extensive experience with nationwide implementation of empirically supported programs. The respondents were therapists, supervisors, and agency leaders working with MST or PMTO.
Aims of the study
The primary aim of the present study was to exam-ine the factor structure and reliabilities of scores on an adapted and translated version of the Measures of Implementation Components [11]. This questionnaire had not yet been tested in a quantitative study. The study allowed for comparisons between program implementa-tion profiles (MST versus PMTO) and respondents (thera-pists, supervisors, and agency leaders). The study also investigated the validity of the scores on the drivers through its associations with scores on variables related to implementation outcomes.
Method
Participants and procedures
The 218 participants in the present study were recruited from a group of practitioners working with PMTO and MST and consisted of: trained and experienced PMTO and MST therapists (n = 149); supervisors (n = 45) of the therapists who participated in the study; and agency leaders (n = 24) who were making decisions and were responsible for the overall organization or the part of the organization in which the therapists worked. A computer-generated random sample of 100 therapists was selected among the cer-tified PMTO therapists who were active in the child welfare or child mental health specialist services. Among these, 93 participated together with all regis-tered PMTO supervisors (n = 24). Among the PMTO therapists, a random selection of 20 of their leaders were chosen for interview and, of those, 13 partici-pated. Fifty-six of 58 MST therapists, and all MST supervisors (n = 21) and leaders (n = 11) contributed to the study.
Questionnaires and interviews
The data collection took place during December 2009 and January 2010 and was organized as a procedure where the interviewers filled in an electronic questionnaire on the internet during a telephone interview. The interviews were carried out by ten MST and twenty PMTO program experts affiliated with the Norwegian Center for Child Behavioral Development. Requests for participation were e-mailed to the respondents, and upon confirmation, appointments were scheduled and the respondents received the question-naire in MSWord format prior to the interviews. Each inter-view lasted for approximately sixty minutes.
Measure
The Implementation Components Questionnaire (ICQ) was adapted from the Measures of Implementation Components of the National Implementation Research Network Frameworks [11]. Adaptation of the measure involved translation from English to Norwegian, and rewording of certain questions to apply to the sample. Each item had three response alternatives in which‘No’= 0, and the two remaining response alternatives (‘yes’ and ‘ some-times’) were collapsed into one, and scored as 1. It was assumed that by using the‘yes’and‘no’format, the answers would be more reliable and reflect whether the actual indi-cator was present or not. The two additional categories,‘not relevant,’and‘I don’t know.’were scored as missing. A brief description of each of the eight scales is provided in the results section of this article.
The implementation climate scale consists of 32 items that relate to the use of innovations in organizations and were adapted from the work of Klein and Sorra [2] and Panzano et al. [18]. In line with the rest of the ICQ ques-tionnaire each item had three response alternatives in which ‘No’= 0, and the two remaining response alternatives (‘yes’ and‘sometimes’) were collapsed into one, and scored as 1.
For the implementation outcomes questions, the therapist respondents were asked to rate the perceived level of inte-gration of the program within their organization, their over-all satisfaction with the implementation process, how much time they spent working with the program, their productiv-ity in terms of the number of cases they had treated with the program, and the number of families who completed treatment. Finally, they responded to the statement‘sooner or later I am going to quit using the program.’
Analyses
The implementation items were measured at an ordinal scaling level and analyzed by Categorical Principal Component analysis (CATPCA) using the PASW Statistics 18 software (2010; formerly SPSS). ‘While Principal Component Analysis (PCA) assumes that the variables used are metric, and proceeds to the spectral decom-position of the correlation matrix, CATPCA relate on
an alternative least squares scheme iterating between quantification and a decomposition phase’ [23]. A Cronbach’s alpha is calculated for each retained di-mension [24]. Due to the small sample size in relation to the number of variables, CATPCA was only con-ducted on the items for each driver separately. For each driver, we first explored a two dimensional solu-tion to test if there was a clear discernible pattern of items loading on the second dimension before we explored the expected one-dimensional solutions. To retain an item in a factor, two criteria were applied: the absolute value of the weighting was equal to or higher than 0.40; and all quantified ordinal variables correlated 0.50 with at least one of the components. Following a rule of thumb for standard PCA, fulfilling both criteria meant that all items contributed well to the description of the characteristics of our sample and all items were sufficiently correlated to one an-other to be useful in the analysis [25], p.128. If either criteria were not fulfilled, the item was excluded. Be-cause of the rather high rates of respondents included with one or more missing values on the scored vari-ables, it was decided to use CATPCA option of treat-ing misstreat-ing values as an extra category [26]. This option implies that the missing category will obtain a quantification that is independent of the analysis level of the variable. The greatest advantage of this in our study was that it enabled us to deal with variables that include categories like no response, don’t know, or not applicable. Mean scale scores were computed for the eight implementation components after the items were trimmed. The scales scores were then examined using descriptive analyses and bivariate cor-relations. Finally, differences between informants (therapists, supervisors, and agency leaders) and pro-grams (MST and PMTO) were investigated.
Results
Recruitment - practitioner selection (nine items)
The items in this scale focus on how staff is recruited to work with the program during its initial phases of imple-mentation, and how staff is recruited to help sustain the program over time. One factor was extracted after using a CATPCA analysis. All items loaded satisfactorily on the recruitment factor (from 0.41 to 0.90). The factor accounted for 53% of the total variance. Reliability for the scale was 0.89. The items in this scale appeared to be the most difficult to answer based on rather high rates of missingness (84 missing, 39%), which was particularly true for therapists.
Training (ten items)
This scale focuses on activities related to providing information, instruction, or skill development to practitioners and other key staff in the implementing organization. This is distinct from the supervision/ coaching scale in that the training scale focuses on the ini-tial acquisition of key skills related to the program. One item from the original scale was excluded due to lack of adequate loadings (i.e.,<0.40). A rerun of the component analysis using only the selected ten items produced a one-dimensional solution with loadings ranging from 0.41 to 0.97. The training factor accounted for 56% of the total variance. Reliability for the scale was 0.91. The distribu-tions of some of the items from the scale were highly non-normal (see Table 1).
Supervision/coaching (nine items)
The questions on this scale focus on the ways that super-visors provide guidance to therapists and practitioners and also how often, where, and how feedback informa-tion is collected. There was little variainforma-tion in the answers on these items. Two items from the original scale were excluded due to lack of adequate loadings. A rerun of the CATPCA analysis using only the selected nine items produced a one-dimensional solution with loadings
ranging from 0.52 to 0.67. The factor accounted for 37% of the total variance. Reliability for the scale was 0.79.
Performance assessment (ten items)
This scale is related to the type, frequency, and method of performance evaluation of the practitioners in relation to their use of the program. Specifically, questions deal with measures of integrity to the method, as well as how often and by whom their performance is evaluated. All items loaded satisfactory on the performance assessment factor (from 0.48 to 0.84) and the factor accounted for 50% of the total variance. Reliability for the scale was 0.89.
Decision support data systems (nine items)
This scale is based on the availability of information through systematic acquisition of data. The goal of these systems is to provide feedback to stakeholders, therapists, coaches, and policy makers inside and out-side of the organization. All items loaded satisfactory on the factor (from 0.47 to 0.75) and the factor accounted for 44% of the total variance. Reliability for the scale was 0.84.
Facilitative administration (seven items)
These items tap into whether those in charge of imple-mentation in the host organization had restructured and adapted the organization to make implementation and sustainability successful. All items loaded satisfactory on the facilitative administration factor (from 0.51 to 0.82) and the factor accounted for 48% of the total variance. Reliability for the scale was 0.82. It is likely that many of the questions were difficult for the therapists to answer because data was missing for 39 to 78 of the 149 respondents.
Systems interventions (twelve items)
The items in this scale are based on the participants’ organizations work to influence the systems and policies
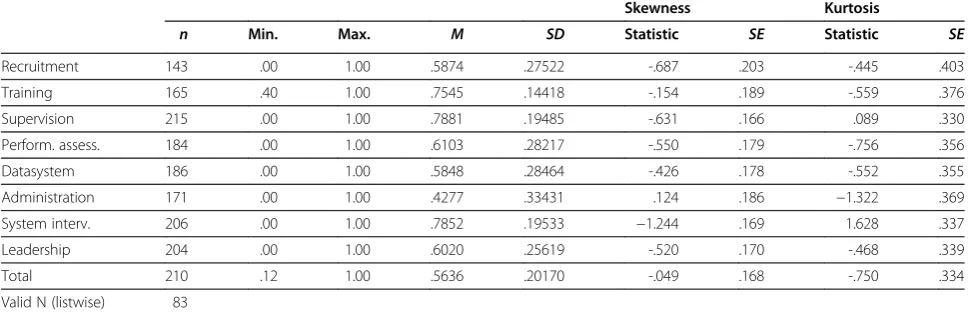
Table 1 Descriptive statistics for implementation drivers
Skewness Kurtosis
n Min. Max. M SD Statistic SE Statistic SE
Recruitment 143 .00 1.00 .5874 .27522 -.687 .203 -.445 .403
Training 165 .40 1.00 .7545 .14418 -.154 .189 -.559 .376
Supervision 215 .00 1.00 .7881 .19485 -.631 .166 .089 .330
Perform. assess. 184 .00 1.00 .6103 .28217 -.550 .179 -.756 .356
Datasystem 186 .00 1.00 .5848 .28464 -.426 .178 -.552 .355
Administration 171 .00 1.00 .4277 .33431 .124 .186 −1.322 .369
System interv. 206 .00 1.00 .7852 .19533 −1.244 .169 1.628 .337
Leadership 204 .00 1.00 .6020 .25619 -.520 .170 -.468 .339
Total 210 .12 1.00 .5636 .20170 -.049 .168 -.750 .334
in their region to develop better support for the innovation. All items loaded satisfactory on the system intervention factor (from 0.41 to 0.74) except for item seven. The twelve-item factor accounted for 36% of the total variance. Reliability for the scale was 0.82.
Leadership (fifteen items)
The questions about leadership focused on ways different people within the organization engaged in leadership be-havior and provided systematic support, clear communi-cation with practitioners, provided decision-making, garnered feedback, and engaged actively in a manner that was conducive to successful program implementa-tion. All items loaded satisfactory on the leadership fac-tor (from 0.41 to 0.74) and the facfac-tor accounted for 37% of the total variance. Reliability for the scale was 0.88.
Therapist assessment of implementation components
The following is a presentation of the associations be-tween therapist background characteristics and imple-mentation assessments and a more detailed description of therapist ratings of the eight subscales. Although the programs and their implementation strategies and struc-ture differ, they give a snapshot of the sustainability of the implementation components in two EBPs that have been in operation for approximately ten years.
Background characteristics
The associations between the therapist implementation ratings and their background characteristics were calcu-lated and the mean total implementation, that is, the mean of all implementation components, were negatively correlated with age (r =−0.21,p<0.01), with the number of years working (r =−0.20,p<0.05) and the number of colleagues (r =−0.37, p<0.001) in the present position, and positively correlated with the number of colleagues working with the same program (r = 0.44, p<0.001). In other words, the older the therapists were, the more time they had worked as therapists, and the more colleagues they had, the more they tended to give low ratings of the implementation components. The openness to change may vary among practitioners, and the older and more experienced among them may have been less motivated to incorporate an evidence-based method in their daily work. Based on their longer field experience, some of the older practitioners may also have had higher expecta-tions for the implementation process. Given the rather low level of general support for the evidence-based movement in the practice field, the organizational cli-mate in large agencies may have been less supportive of the new program. The respondents with relatively many colleagues may have faced more difficulties when they introduced the principles and practice of an empirically supported program. Both their age and experience may
have contributed to higher expectations for implementa-tion support, particularly at the organizaimplementa-tional level.
On the other hand, the more program colleagues the therapists had, the more positive ratings they tended to give. However, the number of years working with the program was not predictive of the implementation evaluation.
Descriptives
The mean scores for the scales were from 0 to 1. Descriptives of all scales revealed that the mean scores were at the upper end of the scale, with the exception of administrative support (M = 0.43, SD = 0.33) (see Table 1). The mean total implementation score was approaching normality with a mean of 0.56 and standard deviation of 0.20. The values of skewness and kurtosis were within acceptable limits for all subscales and items and sug-gested that the data were univariate non-normal (see Table 1) [27,28].
Correlations
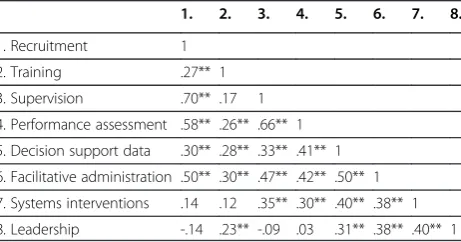
Bivariate Pearson’s correlations between the eight compo-nent scales were computed to examine the relationship be-tween the scales and are presented in Table 2. The correlations between the training scale and the other drivers were in the small to moderate range (ranged from 0.12 to 0.30). The relationship between leadership and facilitative administration, system interventions, and decision support data systems scales were of medium size (ranged from 0.31 to 0.40). The associations between leadership and recruit-ment, supervision and performance assessment were non-significant. The systems interventions scale showed moder-ate associations with the other drivers (ranged from 0.30 to 0.38), with exception of a non-significant correlation be-tween systems intervention and training and recruitment. The association between recruitment and supervision and performance assessment, between performance assessement and supervision, and between facilitative administration and decision support data systems were large and ranged from
Table 2 Pearson’s bivariate correlations between seven of the eight implementation drivers
1. 2. 3. 4. 5. 6. 7. 8.
1. Recruitment 1
2. Training .27** 1
3. Supervision .70** .17 1
4. Performance assessment .58** .26** .66** 1
5. Decision support data .30** .28** .33** .41** 1
6. Facilitative administration .50** .30** .47** .42** .50** 1
7. Systems interventions .14 .12 .35** .30** .40** .38** 1
8. Leadership -.14 .23** -.09 .03 .31** .38** .40** 1
0.50 to 0.70 (small correlation = 0.10, medium = 0.30, large correlation = 0.50; 32).
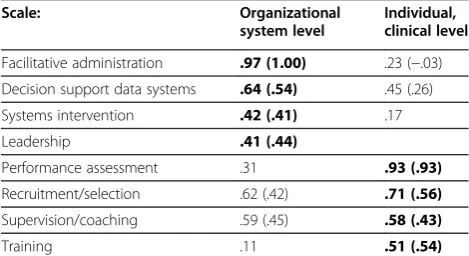
The pattern of the correlations between the implemen-tation drivers indicated that the drivers could be divided into an individual-clinical level and an organizational-system level. Therefore, a principal component analysis (PCA) was conducted on the implementation compo-nents and oblimin rotations were examined. The analysis yielded two factors with eigenvalue exceeding unity (see Table 3). The first factor accounted for 48% of the vari-ance and consisted of the organizational-system level subscales of leadership, administrative support, decision support data systems, and system intervention. The sec-ond factor accounted for 17% of the variance and con-sisted of individual-clinical level subscales of supervision, training, recruitment, and performance assessment. Thus, the results from this study indicate a two-factor structure representing implementation components at the individual clinical level that the national center was mainly responsible for and the organizational system level that to a large extent was under the control of the local adopting organizations. The ‘decision support data system,’ ‘recruitment,’and the ‘supervision’subscales had a high pattern coefficient on both factors. However, all variables loaded above 0.50 on their primary factor.
Prior to running correlations between the outcome ables and organization level and individual level scale vari-ables, only therapist data was selected because the outcome questions did not correspond well to supervisor or agency leaders’experience. An‘implementation sum score’was also calculated by summarizing scores on the eight subscales. Correlations between the outcome variables and scale vari-ables are reported in Table 4. Therapist assessment of the extent to which the program was well integrated into the organization correlated significantly with seven of eight components and with the total score, although in the small to moderate range. The therapists reported how much (in percent) of their position was used on program activities. There was a positive correlation indicating that the larger
the proportion of the position therapists worked with the EBP, the more positive the ratings were on the implementa-tion subscales, particularly recruitment, supervision, per-formance assessment, and the total score (r = 0.57, p<0.01). Another outcome variable of interest was the number of families who completed treatment within the last six months. The findings revealed that scores on recruit-ment, supervision, and performance assessment were mod-erately positively associated with the number of families who completed treatment. The recruitment and supervision components were related to how satisfied the therapists were with the implementation progress. Finally, only train-ing and leadership were associated with whether it is likely that the therapist will quit practicing the EBP.
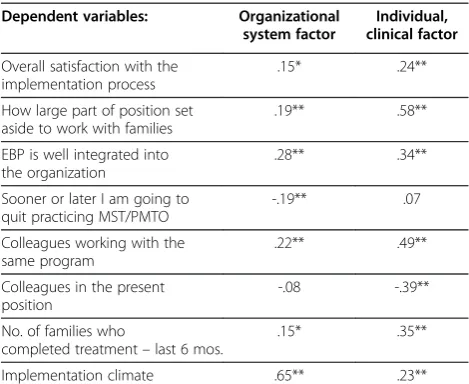
As noted, we created two scales based on the eight com-ponents, namely an organizational system factor and an individual, clinical factor. Table 5 shows that the two sub-scales were significantly correlated (from small to moder-ate) with most outcome variables. Exceptions were that the individual subscale had a large correlation with the proportion of the therapists’position devoted to work on the EBP and the organizational subscale had a large correl-ation with implementcorrel-ation climate. The organizcorrel-ational fac-tor was not significantly correlated with how many colleagues the interventionist had in the present position and the individual factor was not correlated with whether it is likely that the therapist will quit practicing the EBP.
Comparing informants
ANOVAs andpost hoctests (Bonferroni) showed that there were significant differences between the three respondent groups and mostly between therapists and supervisors. Sig-nificant differences between therapists and supervisors were demonstrated on the following subscales: Recruitment and staff selection, F(2,142) = 7.10, p= 0.001, training, F(2,164) = 5.99, p= 0.003, supervision, F(2, 214) = 6.14, p= 0.003, reporting of results, F(2, 183) = 7.13,p= 0.001, administrative support, F(2, 170) = 8.03, p= 0.000, and system interventions, F(2, 205) = 11.05, p= 0.000. On two of the subscales, the therapists scored significantly lower than both the supervisors and the leaders. The first was decision support data systems, F(2, 185) = 20.88, p= 0.000 in which the therapists had a mean score of 0.50 (SD = 0.27) the supervisors had a mean score of 0.77 (SD = 0.26) and the leaders had a mean score of 0.72 (SD = 0.16). Therapists also scored leadership lower than leaders, F(2, 203) = 9.79,p= 0.000; therapists had a mean score of 0. 55 (SD = 0.25), the supervisors had a mean score of 0.69 (SD = 0.25), and the leaders had a mean score of 0.75 (SD = 0.19).
Comparing PMTO and MST
The mean scores for the total scale proved to be signifi-cantly different between the PMTO and MST groups, and significant differences in favor of MST were Table 3 Structure and Pattern Coefficients (in Parentheses)
of the Variables in the Oblique-rotated 2-factor Solution
Scale: Organizational
system level
Individual, clinical level
Facilitative administration .97 (1.00) .23 (−.03)
Decision support data systems .64 (.54) .45 (.26)
Systems intervention .42 (.41) .17
Leadership .41 (.44)
Performance assessment .31 .93 (.93)
Recruitment/selection .62 (.42) .71 (.56)
Supervision/coaching .59 (.45) .58 (.43)
Training .11 .51 (.54)
registered for therapists, supervisors, and leaders. The scores reported by PMTO therapists (see Table 6) were lower for recruitment, supervision, reporting of results, decision support data systems, administrative support, and system interventions than scores reported by MST therapists; however, PMTO therapists’scores were higher than MST therapists on the leadership component. The score on individual system factors were significantly higher for MST therapists than for PMTO therapists, however, the difference in organizational system scores was not significant.
Discussion
The aim of this study was twofold: first,to pilot the Implementation Components Questionnaire (ICQ) which was adapted and translated from Fixsen et al.[11] by exam-ining the factor structure, the reliabilities of scores, and their association with implementation outcome variables. The second aim was to analyze and compare implementation profiles of two EBPs based on assessments by therapists, supervisors, and managers.
The ICQ was tested in a sample of 218 MST and PMTO professionals (therapists, supervisors, and agency leaders) in Norway in the‘sustainability’phase of imple-mentation, ten years after their initial implementation. The psychometric qualities of the questionnaire were supported by measures of internal consistency, the factor analyses of the implementation components, and the comparisons of implementation profiles between pro-grams and respondents. There was also a moderate but consistent association between component scores and implementation outcomes in the expected direction.
Overall, the respondents reported mean scores at the upper end of the scale for ‘recruitment,’ ‘training,’ and ‘supervision,’ and also for ‘systems interventions’ and ‘leadership.’Lower mean ratings were given for‘ perform-ance assessment,’ ‘decision support data systems,’and‘ fa-cilitative administration.’The total implementation score was also in the middle range, reflecting a normal distri-bution of ratings when they were pooled across respon-dents and programs. As reflected in the high mean scores and low variation on the training and supervision scales, both programs seemed to have established and sustained highly structured and consistent procedures for training and supervision. The respondents were Table 4 Pearson’s correlations between implementation drivers and dependent variables
1. 2. 3. 4. 5. 6. 7. 8. 9.
EBP is well integrated into the organization .38** .07 .42** .24** .27** .28** .32** .19* .43**
Satisfied with implementation progress .25** -.03 .26** .12 .05 .17 .11 .04 .19*
Sufficient number of cases .07 .08 .16* -.01 .05 -.15 .09 .04 .05
Percent of position to work with EBP .76** -.02 .64** .50** .21* .37** .23** -.01 .55**
Likely to stop using EBP .01 -.23* .11 .05 -.14 -.14 -.07 -.23** -.04
No. of families referred last 6 mos. .16 .00 .18* .12 .14 -.05 .09 -.01 .16
No. of families who completed treatment–last 6 mos. .40** .06 .30** .26** .14 .11 .07 -.05 .30**
1. Recruitment and staff selection, 2. Training, 3. Supervision, 4. Performance assessment, 5. Decision support data systems, 6. Administrative support, 7. Systems interventions, 8. Leadership, 9. Implementation sumscore.
Note. **. Correlation is significant at the 0.01 level (2-tailed), *. Correlation is significant at the 0.05 level (2-tailed).
Table 5 Correlations–implementation factors and dependent variables
Dependent variables: Organizational system factor
Individual, clinical factor
Overall satisfaction with the implementation process
.15* .24**
How large part of position set aside to work with families
.19** .58**
EBP is well integrated into the organization
.28** .34**
Sooner or later I am going to quit practicing MST/PMTO
-.19** .07
Colleagues working with the same program
.22** .49**
Colleagues in the present position
-.08 -.39**
No. of families who
completed treatment–last 6 mos.
.15* .35**
Implementation climate .65** .23**
Note. ** Correlation is significant at the 0.01 level (2-tailed), * Correlation is significant at the .05 level.
Table 6 Mean, standard deviations andt-test of differences between PMTO and MST
PMTO MST
Mean SD Mean SD t-value Sig N
Recruitment .34 .26 .69 .13 −8.30 .00 92
Training .72 .14 .74 .13 -.77 .44 108
Supervision .64 .15 .97 .06 −15.09 .00 148
Perf. Assessment .37 .23 .78 .14 −11.53 .00 121
Data systems .44 .28 .58 .23 −2.79 .00 121
Administrative supp. .30 .30 .55 .29 −3.77 .00 111
Systems interventions .70 .21 .81 .17 −3.09 .00 140
Leadership .60 .23 .46 .26 3.20 .00 148
Organizational system .55 .22 .59 .21 −1.81 .07 208
generally satisfied with the strategies initiated to influ-ence external systems to contribute with support and resources needed for the local running of the programs. Systems interventions included strategies for ensuring funding and support, routines for referral of cases, and information to families and other local stakeholders. The implementation components of ‘performance assess-ment,’ ‘decision support data systems,’and‘facilitative ad-ministration’ reflect new demands faced by the host organizations when adopting EBPs. These dimensions were given the lowest ratings among the subscales, but higher among MST than among PMTO informants, probably reflecting a higher awareness and a more devel-oped strategy for implementing these components in MST. Leadership was the only component that was rated more positively in PMTO than in MST, and may indicate that the decentralized implementation strategy of PMTO may have resulted in a closer relationship between local leaders and therapists in PMTO than in MST.
The factor analysis of seven of the eight subscales demon-strated a two-level factor structure of the implementation components, which is in line with the multi-level perspec-tive discussed in the literature [6,15,16]. The organizational factor included ‘leadership,’ ‘decision support data systems,’ ‘administration,’and‘systems interventions,’which to a large degree are under the control of the program’s host agencies. The individual-clinical factor measured ‘recruitment,” supervision,’ and ‘performance assessment,’ which to a greater extent reflects the contributions from the Norwegian Center for Child Behavioral Development. As a purveyor of the programs, the national implementation teams perform site assessments, give guidelines and advice concerning recruitment of therapists, and continuously conduct training and supervision. The implementation components identified in the current study have many simi-larities with the concept of ‘technical support’ in Mihalic and Irwin’s [29] evaluation of the Blueprint programs. Both evaluations emphasize the quality of training, supervision, material and handbooks, a system of performance assess-ment (quality assurance), and good working relations be-tween purveyors and practitioners [1,15].
Among the therapists, the most positive ratings came from young therapists with shorter professional careers who worked more than 80% on the program and in the company of program colleagues. This included tightly organized MST teams, but also team-based PMTO therapists. Ratings were not influenced by the number of years of experience with the gram, a finding that attests to the ability of the pro-grams to sustain therapist engagement. Also, the median number of three years of program experience indicated a considerable stability among program staff. The differences in response patterns among the in-formant groups may reflect their different experiences
and perspectives on the implementation process. The ratings of ‘leadership’may to a certain extent reflect the respondents positions in the agency hierarchy to the ef-fect that a higher position may have contributed to a more positive evaluation of the quality of the leadership. When the therapists rated several of the implementation components lower than the supervisors, this may be explained by the fact that the supervisors had more organization and system level information than the therapists, and also were more involved in the imple-mentation process. It may also be that the agency leaders had limited experience with the programs, and therefore had to rely on second hand information about the imple-mentation process.
The analyses of outcome variables showed that there was a moderate association between the implementation components and the therapists’ ratings of how well the program was integrated into their local organization. There were also associations between scores on the im-plementation subscales and the percent of the position set aside to work with the program and the number of families who completed treatment within the last six months. Because the therapist both reported the dependent and independent variables at the same time, the direction of the association is unclear.
Limitations and future directions
Rating System (FIMP), which is an observational fidelity measure specifically developed for PMTO that has been found to predict positive change in parenting practices [30]. Similarly, the relationship between the ICQ measure and Treatment Adherence Measure Scores (TAM scores) [31] should also be examined.
In this study, all informants (therapists, supervisors, and leaders) were affiliated with either MST or PMTO, and this may have been reflected in positive attitudes to-wards either of the programs and their implementation status. Therefore, and in order to reduce this potential bias, future investigations should include non-affiliated informants or observation data. Future studies should test the ICQ measure in different samples representing other empirically supported programs. Because both PMTO and MST in Norway employ (albeit to different degrees) structured implementation strategies, the find-ings from this study do not generalize to interventions without clear implementation strategies. Furthermore, the low variance obtained on some of the scales is also probably related to the program’s implementation strat-egies, although it may be related to instrument sensitiv-ity. This leads to another challenge: Low variance (every participant has almost the same score) does not leave much room for prediction of outcomes. Replication of this study in different samples (e.g., in school-wide pro-grams) is therefore vital in order to further test the valid-ity of the ICQ measure.
The questionnaire introduced a limitation to a report-ing period of six months prior to the interview, and this may have introduced confusion, because many of those interviewed had been recruited several years ago. Some interviewers allowed respondents to forego the six-month window, and some probably ignored the time-frame without any explicit permission. This fact made the interpretation of several items difficult. Although the development of the ICQ measure is still in an early phase, it is encouraging that results point in the expected directions: The highest scores were obtained on the scales where the Behavior Center has been most able to influence outcomes, and MST professionals reported higher scores than PMTO professionals on scales where the MST organization has had a clearer and more struc-tured implementation strategy. These findings may re-flect the validity of the ICQ measure.
Conclusion
Rather than being a one-time event, the implementation of EBPs is a process that might take three to four years [15], but may also languish for 15 to 20 years before they are integrated into routine practice [6]. The present study indicates that the strong focus on implementation in MST and PMTO has paid off 10 years after the pro-grams were introduced in Norway by revealing a strong
and ongoing presence within agencies, and a relatively long median lifespan of program practitioners. Several incentives for program sustainability, therapist engage-ment, and treatment fidelity were acknowledged by the respondents in their evaluations of the implementation components.
Competing interests
The authors declare that they have no competing interests.
Authors’contributions
To designed the study, took part in the translation and adaptation of the questionnaire, organized the data collection and conducted the statistical analyses in collaboration with the other co-authors (GB, JK, and JP), interpreted the results, wrote parts of the manuscript and coordinated the efforts of the co-authors. GB conducted several of the statistical analyses, interpreted the results, wrote parts of the manuscript and designed several of the tables. JK conducted several of the statistical analyses, interpreted the results, wrote parts of the manuscript and designed several of the tables. JP conducted several of the statistical analyses, interpreted the results, wrote parts of the manuscript and designed several of the tables. TC assisted in designing the study, took part in the data collection and interpretation of the analyses, and helped to draft the manuscript. KT assisted in designing the study, translating and adapting the questionnaire, took part in the data collection, interpreting the statistical analyses and helped to draft the manuscript; NT assisted in designing the study, translating and adapting the questionnaire, collecting data, interpreting the statistical analyses and helped to draft the manuscript. All authors have read and approved the final manuscript.
Received: 11 October 2011 Accepted: 31 May 2012 Published: 31 May 2012
References
1. Greenhalgh T, Robert G, Macfarlane F, Bate P, Kyriakidou O:Diffusion of innovations in service organizations: systematic review and recommendations.Milbank Q2004,82:581–629.
2. Klein KJ, Sorra JS:The challenge of innovation implementation.Acad Manage Rev1996,21:1055–1080.
3. Klein KJ, Knight AP:Innovation implementation. overcoming the challenge.Curr Dir Psychol Sci2005,14(5):243–246.
4. Fixsen DL, Blasé KA, Naoom SF, Wallace F:Core implementation components.Res Soc Work Pract2009,19:531–540.
5. Grol R, Wensing M:What drives change? Barriers to and incentives for achieving evidence-based practice.The Medical Journal of Australia2004, 180:57–60.
6. Proctor EK, Landsverk J, Aarons G, Chambers D, Glisson C, Mittman B: Implementation research in mental health services: an emerging science with conceptual, methodological, and training challenges.Adm Policy Mental Health2009,36:24–34.
7. Rogers E:Diffusion of innovation. 4th edition. New York: Free Press; 1995. 8. Ogden T, Forgatch M, Askeland E, Patterson GR, Bullock B:Implementation
of parent management training at the national level: the case of Norway. J Soc Work Pract2005,19:317–329.
9. Ogden T, Christensen B, Sheidow A, Holth P:Bridging the gap between science and practice: the effective nationwide transport of MST programs in Norway.Journal of Children and Adolescent Substance Abuse2008,17:93–109. 10. Ogden T, Amlund-Hagen K, Askeland E, Christensen B:Implementing and evaluating evidence-based treatments of conduct problems in children and youth in Norway.Res Soc Work Pract2009,19:582–591.
11. Fixsen D, Panzano P, Naoom S, Blasé K:Measures of implementation components of the national implementation research network frameworks. Chapel Hill: Authors; 2008.
12. Durlak JA, DuPre EP:Implementation matters: a review of research on the influence of implementation on program outcomes and the factors affecting implementation.Am J Community Psychol2008,41:327–350. 13. Greenberg M, Domitovich C, Graczyk P, Zins J:The study of school-based
14. Biglan AA, Taylor TK:Increasing the use of science to improve child-rearing. J Prim Prev2000,21:207–226.
15. Fixsen DL, Naoom SF, Blasé KA, Friedman RM, Wallace F: Implementation research: A synthesis of the literature. [http://www.fpg.unc.edu/~nirn/ resources/publications/Monograph/]
16. Shortell SM:Increasing value: a research agenda for addressing the managerial and organizational challenges facing health care delivery in the United States.Medical Care Research and Review2004,61(Suppl 3): 12S–30S.
17. Fixsen DL, Blasé K, Timbers GD, Wolf MM:In search of program
Implementation: 792 replications of the teaching-family model. InOffender Rehabilitation in Practice: Implementing & Evaluating Effective Programs. Edited by Bernfield GA, Farrington DP. New York: John Wiley & Sons; 2001. 18. Panzano PC, Seffrin B, Chaney-Jones S, Roth D, Crane-Ross D, Massati R:The
innovation diffusion and adoption research project (IDARP). InNew Research in Mental Health, Volume Volume 16. Edited by Roth D, Lutz W. Columbus: The Ohio Department of Mental Health Office of Program Evaluation and Research; 2004.
19. Fixsen DL, Blasé KA, Dua MA, Naoom SF, Van Dyke M:Implementation of evidence-based treatments for children and adolescents: Research findings and their implications for the future. InEvidence-Based Psychotherapies for Children and Adolescents. Edited by Kazdin AE, Weisz JR. New York: The Guilford Press; 2010.
20. Forgatch M, Patterson GR:The Oregon model of Parent Management Training (PMTO): An intervention for antisocial behavior in children and adolescents. InEvidence-Based Psychotherapies for Children and Adolescents. 2nd edition. Edited by Kazdin AE, Weisz JR. New York: The Guilford Press; 2010. 21. Welsh BC, Sullivan CJ, Olds DL:When early crime prevention goest to
scale: a new look at the evidence.Prev Sci2010,11:115–125.
22. Henggeler SW, Schoenwald SK, Borduin CM, Rowland MD, Cunningham PB: Multisystemic Treatment of Antisocial Behaviour in Children and Adolescents. New York: The Guilford Press; 2009.
23. Lopes H, Calapez T:Exploring the sources and benefits of cooperation.Int J Soc Econ2011,38(7):607–627.
24. Meulman JJ, Van Der Kooij AJ, Heiser WJ:Principal Components Analysis with Nonlinear Optimal Scaling Transformations for Ordinal and Nominal Data. InHandbook of Quantitative Methods in the Social Sciences. Edited by Kaplan D. Newbury Park: Sage Publications; 2004:49–70.
25. Hair JF, Black WC, Babin BJ, Anderson RE, Tatham RL:Multivariate data analysis. 6th edition. New Jersey: Pearson Education International; 2006. 26. Linting M, Meulman JJ, Groenen PJF, Van Der Kooij JJ:Nonlinear principal
component analysis: introduction and application.Psychol Methods2007, 12:336–358.
27. Curran PJ, West SG, Finch JF:The robustness of test statistics to nonnormality and specification error in confirmatory factor analysis. Psychol Methods1996,1:16–29.
28. Tabachnik BG, Fidell LS:Using multivariate statistics. 4th edition. Needham Heights: Allyn and Bacon; 2001.
29. Mihalic SF, Irwin K:Blueprints for violence prevention: from research to real world settings. Factors influencing the successful replication of model programs.Youth violence and juvenile justice2003,1:1–23. 30. Forgatch MS, Patterson GR, DeGarmo DS:Evaluating fidelity: predictive
validity for a measure of competent adherence to the Oregon model of parent management training (PMTO).Behav Ther2005,36:3–13. 31. Schoenwald SK, Hoagwood K:Effectiveness, transportability, and
disseminations of interventions: what matters when?Psychiatr Serv2001, 52:1190–1197.
doi:10.1186/1748-5908-7-49
Cite this article as:Ogdenet al.:Measurement of implementation components ten years after a nationwide introduction of empirically
supported programs–a pilot study.Implementation Science20127:49.
Submit your next manuscript to BioMed Central and take full advantage of:
• Convenient online submission
• Thorough peer review
• No space constraints or color figure charges
• Immediate publication on acceptance
• Inclusion in PubMed, CAS, Scopus and Google Scholar
• Research which is freely available for redistribution