R E S E A R C H
Open Access
Students
’
performance during practical
examination on whole slide images using view
path tracking
Slawomir Walkowski
1*, Mikael Lundin
2, Janusz Szymas
3and Johan Lundin
2Abstract
Background:Whole slide images (WSIs) used in medical education can provide new insights into how histological
slides are viewed by students. We created software infrastructure which tracks viewed WSI areas, used it during a practical exam in oral pathology and analyzed collected data to discover students’viewing behavior.
Methods:A view path tracking solution, which requires no specialized equipment, has been implemented on a
virtual microscopy software platform (WebMicroscope, Fimmic Ltd, Helsinki, Finland). Our method dynamically tracks view paths across the whole WSI area and all zoom levels, while collecting the viewing behavior data centrally from many simultaneous WSI users. We used this approach during the exam to track how all students (N = 88) viewed WSIs (50 per student) when answering exam questions (with no time limit). About 74,000 records with information about subsequently displayed WSI areas were saved in the central database. Gathered data was processed and analyzed in multiple ways. Generated images and animations showed view fields and paths marked on WSI thumbnails, either for a single student or multiple students answering the same question. A set of statistics was designed and implemented to automatically discover certain viewing patterns, especially for multiple students and WSIs. Calculated metrics included average magnification level on which a WSI was displayed, dispersion of view fields, total viewing time, total number of view fields and a measure depicting how much a student was focused on diagnostic areas of a slide.
Results:Generated visualizations allowed us to visually discover some characteristic viewing patterns for selected questions and students. Calculated measures confirmed certain observations and enabled generalization of some findings across many students or WSIs. In most questions selected for the analysis, students answering incorrectly tended to view the slides longer, go through more view fields, which were also more dispersed–all compared to students who answered the questions correctly.
Conclusions:Designed and implemented view path tracking appeared to be a useful method of uncovering how
students view WSIs during an exam in oral pathology. Proposed analysis methods, which include visualizations and automatically calculated statistics, were successfully used to discover viewing patterns.
Virtual slides:The virtual slide(s) for this article can be found here: http://www.diagnosticpathology.diagnomx.eu/ vs/13000_2014_208
Keywords:View path tracking, Whole slide image, Practical examination, Viewing behavior, Visualization, Metrics, Digital pathology
* Correspondence:[email protected] 1
Poznan University of Technology, M. Sklodowska-Curie Square 5, 60-965 Poznan, Poland
Full list of author information is available at the end of the article
Background
Whole slide images (WSIs) are digital representations of entire histological glass slides. WSI is a technology which may not only replace the conventional way of viewing slides but also provide new insights into how the slides are examined when making a diagnosis. This aspect is especially interesting in the case of students who take a practical exam in pathology. Tracking viewed WSI areas may explain why a student chose the right or wrong answer. Such knowledge is even more useful when it includes viewing behavior of multiple students for many slides. Creating a tracking infrastructure scal-able to many users and analyzing students’ viewing be-havior during an exam are the objectives of this paper.
WSIs have been described as a useful and scalable solu-tion for educasolu-tion purposes, including medical educasolu-tion and examination [1]. Digitized histological images can be successfully utilized in web-based learning modules [2]. The WSI system used in this work (WebMicroscope, Fim-mic Ltd, Helsinki, Finland) is a tool appreciated by stu-dents [3,4]. It has been already utilized in the Poznan University of Medical Sciences in Poznan, Poland since year 2005 to not only enable teaching but also conduct student examination [3,5].
One of the significant advantages of WSIs, compared to traditional histological glass slides, is enabling a wide range of complex analyses which can be performed using digital tools. Specially designed and implemented algo-rithms can tackle problems like comparing image quality of WSIs acquired using different devices [6] or distin-guishing between WSIs containing histopathological pat-terns characteristic of certain diagnoses automatically [7]. The analytical topics related to WSIs cover the edu-cational area as well. For example, assessment of learn-ing can be extended to investigate how a user interacts with a digital sample. This can include the whole learn-ing process, from analysis of how inexperienced students view educational samples to studies on how experts’ minds work and evaluating pathologists’performance in less subjective way [8].
One way of recording viewing behavior is eye movement tracking with highly specialized equipment [9], which has also been used to analyze how other medical images are viewed [10]. However, this approach is cumbersome and may be difficult and expensive to adapt for a large number of users. Using a software method is an alternative. It has already been suggested that signals collected from regular WSI viewing hardware, like mouse cursor position [11] and data from slide navigation [12], may have potential in identification of viewing behavior.
We use an innovative view path tracking method, which has been integrated with the WSI software plat-form WebMicroscope, and is described for the first time in this paper. This method dynamically tracks view paths
across the whole WSI area and all zoom levels, centrally collects viewing behavior data from many simultaneous WSI users and requires no specialized equipment.
Methods
A view path tracking approach was used to create and save information about how a WSI was examined. We tracked and analyzed viewing behavior of students (N = 88) of the Poznan University of Medical Sciences who participated in the practical exam in oral pathology in 2012. This retro-spective study is based on routine analysis of the exam re-sults and it is not an experiment. According to the curriculum of the Poznan University of Medical Sciences, this exam is an obligatory form of getting a credit for the oral pathology course. Dental students were informed about the conditions and form of the exam at the begin-ning of the course. Each student accepted displayed infor-mation when logging into the exam system and his or her answer sheet. View path tracking data utilized in the study is anonymous.
Every student was answering 50 exam questions. Each question was in the form of a multiple choice test (with a single correct answer) and had a WSI attached to it. Students spent the vast majority of exam time on view-ing these WSIs, while the rest of the time was used by them for reading questions and selecting answers. All students had unlimited time for completing the whole exam. Therefore, the duration of the exam depended on a particular student.
Slides were viewed using regular computer hardware and specially designed WSI viewer software–integrated, but optional part of the current WSI system. Each time a student stopped panning and zooming and image data for the whole view field was loaded, a record was gener-ated and sent to the central database. The record con-tained coordinates viewed, timestamp and metadata enabling identification of the given student and question. In total, there were almost 74,000 records sent during the exam in 2012. This corresponds to an average of about 750 view fields recorded per student in an exam session or about 15 view fields per WSI per student in an exam session. To enhance the quality of the data, 86 records coming from two students were excluded from the final processing as they were affected by workstation technical issues during the exam. Rest of the data was used for the analysis described in this paper.
Once the exam concluded, the database contained data ready to be processed and analyzed. Two general ap-proaches were used for data analysis: visualization and statistics.
Visualization
human-readable data representation. A single view path is repre-sented by a set of rectangles drawn on top of a slide thumbnail. Each rectangle represents an area which the student displayed on his or her screen while interpreting the slide. To improve clarity, rectangles are filled with semi-transparent color, with opacity depending on a view field’s zoom level, and connected with arrows, to visualize the order of viewing.
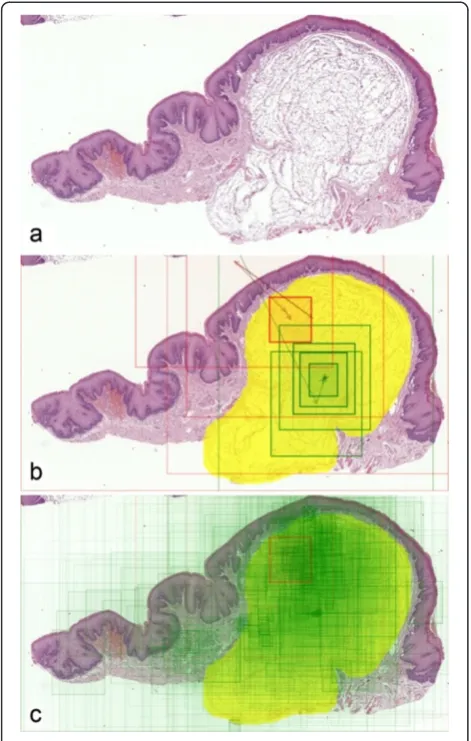
Such an image can be enhanced by marking the re-gions of interest (ROIs) on which a student should focus to make a diagnosis. Comparing them with the view path location can easily tell us whether a student was viewing an appropriate area of a WSI (Figure 1b).
View paths for the same WSI but coming from mul-tiple students were also compared on a single image. By using two distinctive colors, students answering cor-rectly and incorcor-rectly can be easily distinguished in such visualization. Drawing all students’ view paths on one slide thumbnail provides a map of areas which were most frequently viewed by the whole group (Figure 1c).
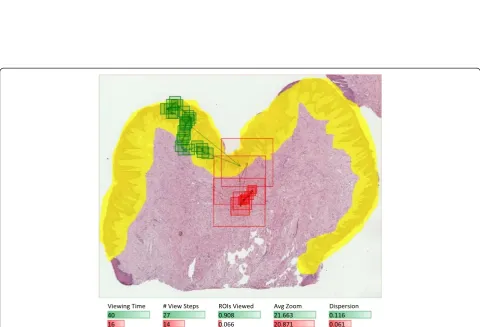
Having a timestamp associated with each database rec-ord enables creation of not only static images but also animations. In this case, rectangles representing single view fields appear at the same pace as a student was panning and zooming to corresponding regions. This method illustrates time spent on viewing particular areas. These areas can be simultaneously displayed next to the slide overview, forming a dynamic replay of what student was seeing on his or her screen (Figure 2, Additional file 1). Naturally, the speed of the animation can be adjusted and view paths from multiple students can be animated on a single slide overview (Additional file 2).
Figure 1Visualization process for a question containing a WSI demonstrating submucosal lipoma. (a)WSI overview (thumbnail).
(b)Viewing behavior of two students during the exam. Rectangles and arrows denote view paths–green one represents a student who answered the question attached to this WSI correctly, while red one is for a student who gave an incorrect answer. Diagnostic area, which denotes the expected region of interest (ROI), is marked in yellow.(c)An aggregated map of areas viewed by all students answering this question; only one student answered incorrectly.
Measures
Analysis of visualizations by a human is not scalable to discover viewing behavior of many students interpreting many WSIs. Such visual assessment may also not be pre-cise enough to draw general conclusions. To address these problems, a set of 26 statistics was designed and calculated to numerically describe viewing behavior. This approach enables aggregation of records for all view fields in a view path into a single set of metrics. Once calculated for each student and each question answered, the metrics may be further compared and aggregated across students and slides.
Calculated statistics included both simple metrics, like total viewing time and number of view steps, and more advanced formulas, describing spatial relations between view fields. The latter included the following measures, selected for further analysis:
‘Regions of interest (ROIs) viewed’, depicting how much a student was focused on diagnostic areas of the slide. This measure was calculated as a
percentage of view field area which included an ROI area and aggregated across all view fields except for the first one, which was by default presented to a student right after opening the WSI and does not represent student’s navigation. The aggregation was done using an arithmetic mean weighted by the time each view field was displayed on a screen.
Average zoom level, also weighted by view fields’ viewing time, used to describe at what level of detail a student was interpreting the slide.
Dispersion, describing how scattered or
concentrated the viewed areas were. This concept was expressed as an average distance between each pair of view fields. Similarly to‘ROIs viewed’ measure, the first (default) view field displayed after opening the WSI was not included in the
calculation.
In this paper, we focused on comparing the behavior of students answering a given question correctly and students whose answers were incorrect. Measures mentioned above were chosen based on how well they differentiate these two groups of students, according to initial tests and analysis.
Results
Selected metrics were used together with visualizations to compare students’ viewing patterns within the same questions. Then, an aggregation of measures across mul-tiple questions allowed us to make a broader comparison and draw more general conclusions.
We compared viewing behavior of two students inter-preting a WSI with benign reactive keratosis (Figure 3). Based on visual assessment, we can clearly see that the
student who answered correctly was much more focused on diagnostic areas, looked at more single fields of view, which were more dispersed across the WSI – as com-pared to the student who gave a wrong answer (Figure 4). These three observations are confirmed with the mea-sures calculated for these students’ view paths. Another measure, which also differentiates these answers, is total viewing time – it is longer for the examinee who an-swered correctly.
Such conclusions are specific to these two students viewing this particular WSI. In fact, they are very differ-ent from more general findings presdiffer-ented below. This shows the complexity of analyzing viewing behavior of many students interpreting many WSIs. However, the set of methods presented in this paper makes the ana-lysis possible on multiple aggregation levels.
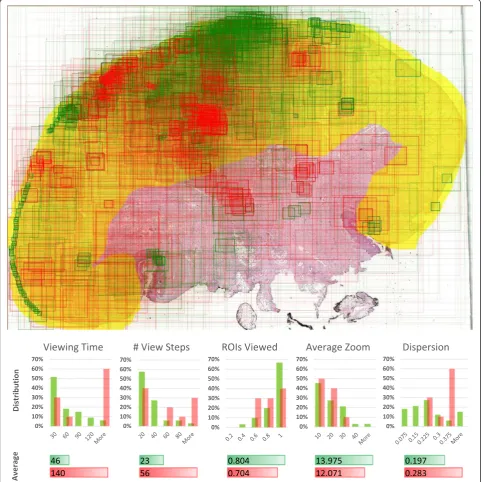
In case of a question containing a slide with squamous cell carcinoma, we compared view fields for all students’ answers at the same time (43 answers with 1,330 view steps in total). Visualization of view fields coming from all students gives some idea about slide areas on which most students were focused (Figure 5). However, it would be difficult to draw any conclusion about differ-ences in behavior of students answering correctly and incorrectly if based solely on such an image. Compar-ing measures calculated from the raw viewCompar-ing data helps in this task. Average values and distributions were calculated for each measure within groups that gave correct and wrong answers, respectively. It can be seen that for this question, students answering incor-rectly tend to view the slide longer, going through more view fields. Differences in average values and dis-tributions of other metrics are smaller but it can be still noticed that students with correct answers are generally a bit more focused on ROIs, use higher mag-nification and move less across different areas of the slide.
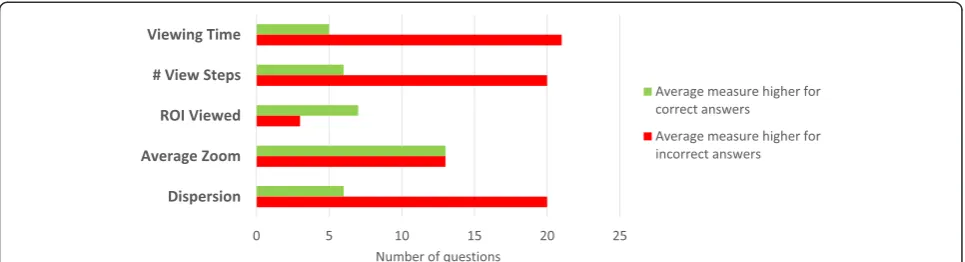
Finally, metrics were calculated and compared across multiple questions and their corresponding WSIs used in the exam. Because we were comparing behavior of students answering correctly and incorrectly, questions with at least 5 correct and 5 incorrect answers were se-lected. This resulted in a set of 26 questions with 1,033 students’ answers and 19,996 view fields in their view paths on corresponding slides. Ten of these questions had ROIs marked on WSI overviews for the analysis purposes, which made calculating‘ROIs viewed’measure possible for them.
Figure 3Visualization steps for a question containing a WSI with benign reactive keratosis. (a)Slide overview.(b)Region of interest (diagnostic area) marked by a pathologist for analysis purposes.(c)View paths for two answers (correct = green and incorrect = red), coming from two students.(d)Aggregated map of view paths from all students’answers for this question.
Viewing Time # View Steps ROIs Viewed Avg Zoom Dispersion
40 27 0.908 21.663 0.116
16 14 0.066 20.871 0.061
the chart in Figure 6. Conclusions which can be drawn from them are close to the outcome of the squamous cell carcinoma slide analysis above. In most questions, when students give wrong answers, they tend to spend more time on interpreting the slide and go through more view fields, which are also more dispersed than for students answering correctly. The latter ones seem to be more focused on appropriate ROIs. Magnification level
does not appear to be correlated with answer correctness in this overall comparison.
Discussion
and presented in various ways, on different aggregation levels. This resulted in multiple conclusions about stu-dents’viewing behavior during the exam.
The software-based tracking method for WSIs ap-peared to be a good choice for the exam session envir-onment. This approach has certain advantages over solutions described in [9,11], which involve eye move-ment tracking. Once implemove-mented on a WSI software platform, our method is easy to adapt and requires no changes in the way how WSIs are normally viewed. Compared with the approach presented in [12], it uti-lizes standard and more user-friendly graphical interface, scales well for multiple simultaneous users and collects tracking data centrally.
The method works well because of typical navigation (panning and zooming) required when interpreting a WSI. On the other hand, our approach cannot deter-mine which part of the currently displayed fragment is being actually viewed. This is the task which can be ac-complished using eye movement analysis and adding it to the navigational tracking could provide even more de-tailed results. However, scalability and adaptability of the current solution would be degraded because of extra equipment and preparation required by the eye move-ment tracking.
Application of the approach described in this paper can go beyond drawing conclusions about WSI viewing behavior among students. It would be interesting to en-able the tracking method in WSI viewers used by a group of expert pathologists for longer time. In this way, we could get a large set of data, which could help us bet-ter understand the process of making diagnoses by pa-thologists or evaluate their performance in a better way, like suggested in [8]. Moreover, WSI tracking data com-ing from experts could be used by computer-aided diag-nosis algorithms as training signals, which could help in automatic identification of important diagnostic areas in the slides containing certain diseases.
In the education area, one can imagine that informa-tion from view path tracking could be utilized as an element of student’s performance assessment. For ex-ample, a student who efficiently viewed a WSI and gave the correct answer could obtain a higher score than a student who also answered correctly but his or her way of viewing the slide suggested that he or she was not really prepared for the question. Furthermore, extending similar tracking approaches to the learning process can play an important role in the future of digital education. Discovering the behavior of students when they learn and acquire knowledge using digital technologies can help in making the courses more efficient. Collecting and automatically analyzing detailed signals about users’ behavior in real time can lead to developing immersive educational applications, which provide fast and direct feedback to the students. Because of scalability of such solutions, they could be applied to both regular classes and online courses.
Conclusions
It can be concluded that view path tracking appeared to be a useful method of discovering viewing behavior of a large group of users interpreting many whole slide im-ages. Although no specialized hardware was used, gath-ered data was a valuable resource. It was visualized in multiple ways, providing many useful insights into both individual viewing behaviors and patterns occurring across multiple students. Automatically calculated statis-tics reflected some viewing characterisstatis-tics, confirmed visual observations and enabled generalization of some findings for multiple students and exam questions.
Additional files
indicated in the upper left corner. Time is measured starting from the moment when the first view field was loaded after opening the WSI by the student. Right side shows the WSI overview, which includes diagnostic area (in yellow) and cumulative visualization of view fields subsequently displayed by the student (green rectangles). Animation speed is 2× compared to real time.
Additional file 2:Animation showing view paths for all students interpreting a WSI with cervical lymphoepithelial cyst.View fields subsequently displayed by all students answering a question attached to this WSI are visualized on a single WSI overview. Students answering correctly are differentiated from students answering incorrectly by using green and red rectangles, respectively. Animation of multiple view paths is synchronized by using the time of the first view field in each view path as the common animation start time. Fragments viewed at the given moment are distinguished by bold borders. Animation speed is 5× compared to real time.
Abbreviations
WSI:Whole slide image; ROI: Region of interest.
Competing interests
The authors declare that they have no competing interests.
Authors’contributions
SW was responsible for the final metrics, visualizations, analysis and manuscript. ML was responsible for view path tracking software and database, raw data processing and initial data presentation. JS was responsible for conducting the exam, marking diagnostic areas in WSI overviews and sharing pathologist’s and teacher’s expert knowledge. JL coordinated the WebMicroscope team work and oversaw the course of this research topic. All authors have read and commented on the manuscript draft, and read and approved the final manuscript.
Acknowledgements
We would like to thank the WebMicroscope team (from the University of Helsinki and Fimmic Ltd) for the WSI software support. We also appreciate the cooperation and would like to thank all dental students who participated in the practical exam in oral pathology in 2012, and the faculty members of the Chair of Clinical Pathology at Poznan University of Medical Sciences who utilized WebMicroscope system for teaching the students.
Author details
1Poznan University of Technology, M. Sklodowska-Curie Square 5, 60-965
Poznan, Poland.2Institute for Molecular Medicine Finland FIMM, University of Helsinki, PO Box 20, FN-00014 Helsinki, Finland.3Department of Clinical Pathology, Poznan University of Medical Sciences, Przybyszewski Str. 49, 60-355 Poznan, Poland.
Received: 8 June 2014 Accepted: 8 October 2014
References
1. Pantanowitz L, Szymas J, Yagi Y, Wilbur D:Whole slide imaging for educational purposes.J Pathol Inform2012,3:46.
2. Krasne S, Hillman JD, Kellman PJ, Drake TA:Applying perceptual and adaptive learning techniques for teaching introductory histopathology.
J Pathol Inform2013,4:34.
3. Szymas J, Lundin M:Five years of experience teaching pathology to dental students using the WebMicroscope.Diagn Pathol2011,6(Suppl 1):S13. 4. Helle L, Nivala M, Kronqvist P, Gegenfurtner A, Bjork P, Saljo R:Traditional
microscopy instruction versus process-oriented virtual microscopy instruction: a naturalistic experiment with control group.Diagn Pathol 2011,6(Suppl 1):S8.
5. Szymas J, Lundin M, Lundin J:Teachers’impact on dental students’exam scores in teaching pathology of the oral cavity using WSI.Diagn Pathol 2013,8(Suppl 1):S25.
6. Walkowski S, Szymas J:Quality evaluation of virtual slides using methods based on comparing common image areas.Diagn Pathol2011,6(Suppl 1):S14.
7. Walkowski S, Szymas J:Histopathologic patterns of nervous system tumors based on computer vision methods and whole slide imaging (WSI).Anal Cell Pathol2012,35:117–122.
8. Weinstein RS:Time for a reality check.Arch Pathol Lab Med2008,132:777–780. 9. Krupinski EA, Tillack AA, Richter L, Henderson JT, Bhattacharyya AK, Scott
KM, Graham AR, Descour MR, Davis JR, Weinstein RS:Eye-movement study and human performance using telepathology virtual slides. Implications for medical education and differences with experience.Hum Pathol2006,
37:1543–1556.
10. Bertram R, Helle L, Kaakinen JK, Svedström E:The effect of expertise on eye movement behaviour in medical image perception.PLoS One2013,
8:e66169.
11. Raghunath V, Braxton MO, Gagnon SA, Brunyé TT, Allison KH, Reisch LM, Weaver DL, Elmore JG, Shapiro LG:Mouse cursor movement and eye tracking data as an indicator of pathologists’attention when viewing digital whole slide images.J Pathol Inform2012,3:43.
12. Roa-Peña L, Gómez F, Romero E:An experimental study of pathologist’s navigation patterns in virtual microscopy.Diagn Pathol2010,5:71.
doi:10.1186/s13000-014-0208-6
Cite this article as:Walkowskiet al.:Students’performance during practical examination on whole slide images using view path tracking.
Diagnostic Pathology20149:208.
Submit your next manuscript to BioMed Central and take full advantage of:
• Convenient online submission
• Thorough peer review
• No space constraints or color figure charges
• Immediate publication on acceptance
• Inclusion in PubMed, CAS, Scopus and Google Scholar
• Research which is freely available for redistribution