Tweeting with Sunlight: Encoding Data on Mobile Objects
Rens Bloom∗ Marco Zuniga†∗ Qing Wang‡ Domenico Giustiniano§
∗AMS Institute, the Netherlands. †TU Delft, the Netherlands. ‡KU Leuven, Belgium. §IMDEA Networks Institute, Spain.
[email protected] [email protected] [email protected] [email protected]
Abstract—We analyze and optimize the performance of a new type of channel that exploits sunlight for wireless communication. Recent advances on visible light backscatter have shown that if mobile objects attach distinctive reflective patterns to their surfaces, simple photosensors deployed in our environments can decode the reflected light signals. Although the vision is promising, only initial feasibility studies have been performed so far. There is no analysis on how much information this channel can transmit or how reliable the links are. Achieving this vision is a complex endeavour because we have no control over (i) the sun or clouds, which determine the amount and direction of light intensity, and (ii) the mobile object, which determines the modulated reflection of sunlight. We investigate the impact of the surrounding light intensity and physical properties of the object (reflective materials, size and speed) to design a communication system that optimizes the encoding and decoding of information with sunlight. Our experimental evaluation, performed with a car moving on a regular street, shows that our analysis leads to significant improvements across many dimensions. Compared to the state of the art, we can encode seven times more information, and decode this information reliably from an object moving three times faster (53 km/h) at a range that is four times longer (4 m) and with three times lower light intensity (cloudy day).
I. INTRODUCTION
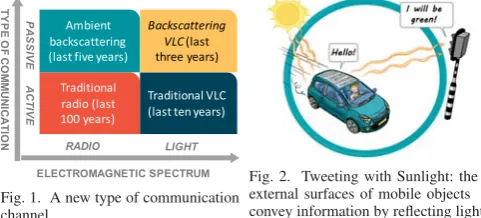
Wireless communication is a fundamental pillar of modern societies. The explosive growth of bandwidth demand, number of devices, and the need to reduce energy footprint, are driving efforts for new communication means, cf. Fig. 1. In the past decades,active communication, which requires carrier signals to be generated, has been the most popular approach using radio-frequency (RF) and visible light (VL). Recently, there is great interest inpassive communication, leveragingexisting signalsin RF [1] and VL spectrums [2], [3], [4] to convey data. Motivated by this later group of studies, we investigate how to optimizethe use of sunlight for wireless communication.
Except for [3], all communication systems in Fig. 1 share an implicit assumption: transmitters can be controlled. In active communications, a transmitter can control transmission power and symbol duration. In passive systems, it can control symbol duration. In [3] we cannot control either because ambient light is leveraged as a signal carrier. Since ambient light cannot be modulated directly, we proposed to modulate light reflections by i) changing the external surfaces of objects according to the information want to convey, and ii) exploiting the object’s mobility to modulate light reflecting from its surface. An inexpensive and energy-efficient photosensor can be used to measure the reflected light patterns to decode the information.
Motivating application: Objects that tweet.
Communica-tion with sunlight can enable passive monitoring of events
Fig. 1. A new type of communication channel.
Fig. 2. Tweeting with Sunlight: the external surfaces of mobile objects convey information by reflecting light.
and activities. As an example, consider the communication between a moving car and a static receiver shown in Fig. 2. The car embeds a message as a pattern in the reflected light. The message length is limited due to the size of the car. This communication method could be seen as a Twitter post: a short-length message sent to the world. The goal is to decode the information with a receiver placed next to the road as the car passes by. The message transmitted by the car can contain a static unique identifier similar to a license plate, or some dynamic information like where it is heading towards. In this paper we use static barcodes to encode messages, consisting of black and white stripes. But materials such as e-ink could be used to embed dynamic messages. We evaluate our system with this outdoor application in Sec. V.
Research questions.The vision of using sunlight for
com-munication is promising, but this new channel has not been analyzed yet. As in traditional communication, our goal is to maximize the amount of information that can be transmitted at the largest distance possible, while minimizing energy consumption. With this new channel, however, wedo not have control over the sun’s direction and illuminance, which depend on the weather and the time of the year/day; andwe do not have control over the object’s size and speed, which determine the modulation processes. The above considerations imply that the design choices for this channel are fundamentally different from traditional systems and can be summarized as follows:
2) Decoding: In traditional communications, the transmit-ter detransmit-termines the amplitude and the period of symbols. In our case, we cannot determine the amplitude (which depends on light reflections) and the timing (which depends on the object’s speed). This means that symbolswithina message could look very different from each other, making the decoding process harder. We need to design robust schemes to cope with highly variable amplitudes and modulation rates withinthe packet.
Contributions.We proposed to use sunlight for
communica-tion in [3]. We furtheranalyze and optimizethe use of this new communication channel. We provide three main contributions. 1) Optimal encoding of data(Sec. III). We design a frame-work to derive the optimal (minimum) stripe width to decode information reliably. Given that the object’ s size limits the amount of information that can be transmitted, this analysis is necessary to maximize the data rate of the channel.
2) Reliable decoding of data(Sec. IV). We propose a new decoding scheme, based on barcode methods, to overcome the problems caused by variable amplitudes and symbol duration. 3) Validation of insights(Sec. V). We build a testbed to val-idate our findings and perform realistic outdoor experiments. Our results showcase the strength of our framework: compared to state of the art, we can decode more data (7×), from faster objects (3×), at longer distances (4×), with less light (3×).
II. ANEW CHANNEL: POTENTIAL AND CHALLENGES
This section summarizes the necessary background to un-derstand the concept of wireless communication with sunlight.
A. Encoding with sunlight: uncontrollable but sustainable Our system is composed of three basic block elements: • Sunlight, our signal carrier, is widely available but hard to
control (modulate), as opposed to artificial lights, which are easier to control for backscattering [2], [4].
• Tags, which reside on top of mobile objects and contain different reflective materials to encode information. We refer to the information carried by thetagsas “messages”. • Receivers, which are tiny boxes containing at least one
photosensor to measure the impinging light intensity. As the object moves, the intensity of the reflected light changes depending on the properties of the tag’s materials. The variations in the reflected light can then be decoded by the receiver. This channel poses many challenges but it has a low carbon footprint across two important dimensions. First, lighting infrastructure. There is no need to add extra light sources or electronic transmitters. Second, energy consump-tion. Our system saves energy by using photosensors rather than cameras. Cameras can consume two order of magnitudes or more (1000 mW [5]), compared to the 6 mW consumed by our prototype. Furthermore, cameras raise up privacy concerns.
B. Research challenges
Compared to other systems, ours is opportunistic and best-effort because it depends on many factors outside the de-signer’s control. Since we have no transmitters but only sun-light with variable direction and illuminance, the performance
TABLE I
FACTORS AFFECTING THE SYSTEM’S PERFORMANCE
Metric Design Parameters
Symbol duration Stripe widthW, object speedv
Communication Field of view and sensitivity of photosensor, reliability reflective properties of materials
of our passive channel depends strongly on the design of the tags and the receiver. As presented in Table I, the symbol duration at the receiver is a function of the tag’s stripe width and the object speedv. The reliability of the passive channel depends instead on the reflective properties of the tag, and the field of view (FoV) and sensitivity of the receiver. Below, we describe the design challenges in detail.
1) Challenges due to the object’s properties.: The modula-tion of our signals is dictated by the reflective properties of the tags, and the size and speed of the object. These characteristics raise up three main challenges. First, we need to derive the optimal stripe width to encode,reliably, as much information as possible on the (limited) objects’ surfaces. Second, we need to design decoding methods that can cope with variable amplitudes caused by uncontrolled reflections over the tags. Third, the decoding method should also cope with variable symbol durations. An object could move faster or slower at any point in time. These dynamics can change the symbol durationwithinthe same message and cause decoding errors1. Thus we need to design a light-weight decoding method that can overcome amplitude and timing distortions.
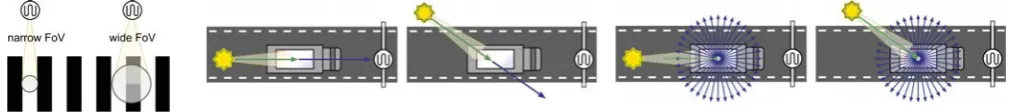
2) Challenges due to the sun’s properties.: The fact that we cannot determine the location and illuminance of the sun impacts the design of the receiver and tags. The receiver’s ability to decode information is particularly susceptible to its FoV. A broad FoV provides a high gain and a wide coverage, but it exposes the receiver to more interference, cf. Fig. 3. A narrow FoV provides the opposite trade-off. Regarding the reliability of links, the problem is hard because we depend on untamed reflections. The continuous change of the sun’s relative location affects the design of the tags because the direction of reflections changes throughout the day creating intermittent links [3]. Our system should provide a reliable link independently from the sun’s position during the day.
III. ENCODINGINFORMATION INPASSIVECHANNEL
In this section, we analyze the performance of our channel and derive the optimal (minimum) message’s stripe width. We disentangle the problem into the following sub-problems:
• For the tag: identify the appropriate type of reflecting material (Sec. III-A). We need to use materials that reflect light in such a way that we can maintain a continuous link independently of the sun’s position.
• For the receiver: maximize the amount of information that can be decoded reliably (Sec. III-B). We use geomet-rical optics to design receivers that can reduce their FoV
Fig. 3. A narrow (wide) FoV sees one (multiple interfer-ing) stripe(s) at a time.
Fig. 4. Specular reflection: left) the specular reflected light rays reach the sensor with the highest energy; right) they do not reach the sensor because of a different position of the sun.
Fig. 5. Diffuse reflection. The light rays reach the photosensor regardless of the angle of incidence.
(to encode more data on the tags), and as well, increase the received signal strength (to decode data reliably). • For the channel:analyze how the channel distorts signals
(Sec. III-C). We derive the channel impulse response and show how the ‘perfect’ square-wave signals of barcodes get distorted into Gaussian-like waves.
• For the entire system:quantify the overall communication performance (Sec. III-D). We use a realistic setup to analyze the joint effects of channel response and inter-symbol interference to derive the optimal stripe width.
A. Light reflection and reception
1) Modulation: It is performed by the reflection of im-pinging sunlight on a moving object’s surface. The amount of reflected light is determined by (i) the intensity and direction of sunlight and (ii) the reflection coefficient ρof the surface material, which takes values in the range[0,1]. Assuming that the sunlight’s intensity and direction do not change during the (short) data transmission, information bits can be associated to stripes of widthW having two distinct reflective materials:
bit = 0→LOWreflection coefficient(ρ1)
bit = 1→HIGH reflection coefficient(ρ2). (1)
2) Specular vs diffuse reflection: The reflection coefficient is not the only parameter that matters for the design of our tags. Depending on the material’ smoothness, there are two types of reflections:specularanddiffuse. Specular reflection occurs on smooth mirror-like surfaces that reflect light to a single direction; while reflections on rough surfaces are diffuse, that is, light is reflected to all directions. For example, metallic plates and white paper have high reflective coefficients, but the former is a specular material and the latter is diffuse reflective. For our purposes, the trade-off between using specular and diffuse reflective materials is that of range versus coverage. Given that the sun’s position (azimuth and zenith) changes during a day, using a specular mirror-like surface would imply that the photosensor captures a strong light beam but only from the direction of the angle of incidence, as in Fig. 4. Most of the time the link will not exist. With diffuse reflection, we guaran-tee that a photosensor will receive the signal because sunlight is reflected to all directions. In this case, only the photosensor’s FoV determines the detectable area of the object’s surface. By pointing the photosensor towards the expected location of the object, signals modulated through diffuse reflection will be received independently of the position of the light source, as illustrated in Fig. 5. Therefore, to guarantee a continuous link, we use diffuse reflective materialsto modulate sunlight.
A limitation of using diffuse reflections is that the luminous power towards the receiver is decreased. In Sec. III-B, we show that lenses help in overcoming this limitation.
3) Light reception at the photosensor: Upon impinging the object, sunlight scatters into multiple rays reflected in various directions. To quantify the light reaching the receiver, we fol-low a ray-tracing approach. We use the Lambertian reflection model to simulate the diffuse reflection on materials [7]. We divide the object surface into tiny cells. For each cell, a set of light rays is generated according to the Lambertian reflection model. The final received signal strength is given by the sum of light rays reaching the sensor’s detectable area.
B. Use of lens and optical transmission
Our system faces a fundamental trade-off between the amount of information that can be encoded on an object’s surface and our ability to decode that information. We require a narrow stripe width W to encode as much information as possible and increase the data rate. But a narrow size requires a narrow FoV, cf. Fig. 3. The problem of having a narrow FoV is that it reduces the light intensity reaching the receiver, making it harder to distinguish between HIGH and LOW symbols. The authors of [3] faced this challenge but they solved it by simply controlling the receiver’s FoV with a small cap surrounding the photosensor. With this approach, the authors either increased their data rate or their signal strength, but they could not achieve both goals simultaneously.
We exploit lenses to achieve the dual goal of increasing the data rate and increasing the amount of light reaching the receiver. In traditional systems, lenses have been used to improve the SNR in VLC [8] and to increase the efficiency of solar panels [9]. The goal in the above two applications is solely to gain more luminous power. Once the FoV covers the light source, there is no need to further decrease the FoV. We, on the other hand, need to identify an optimal trade-off between received energy and coverage. A similar problem is faced by barcode readers, which usually embed lenses [10]. However, the lack of control over the light source and the mobile object, as well as the sustainable design of our receiver (single photosensor) make our problem space unique.
To highlight the benefit of using lenses, we first describe the properties of a receiver with no lens in a simplified 2D model, see Fig. 6. Letdpbe the distance between the aperturesgand
a photosensor with size sp. Let D be the distance between
the aperture and the surface. The receiver’s FoV leads to a detection areaAwhich can be derived with geometrical optics:
Fig. 6. FOV and detection areaAfor a receiver without lens.
Fig. 7. A 2-D geometric representa-tion of our receiver with the object (left), lens (middle) and sensor (right)
This type of receiver leads to a non-optimal encoding becauseAis wide, but does not provide much optical energy at the receiver. There is a smaller area M that can provide maximum illuminance to the sensor (because it can be “seen” from any point on the photoreceptor’s area sp):
M =sg+ (|sg−sp|)D/dp. (3)
Ideally, we would like a receiver that satisfies three condi-tions: (i)A=M, (ii)Ais small, and (iii)Aprovides sufficient illuminance for decoding. Adding a lens to the receiver helps limiting the FoV, without lowering the received light intensity. First, let us clarify how lenses increase the luminous power. Lenses increase the illuminance power on a specific sensor area in the same way a magnifying glass (a lens) focuses the sunlight impinging over the lens’ area into a ‘single point’ to burn wood [11]. This property is particularly beneficial for reflections captured by a receiver with a small FoV.
Now, let us show how lensesreduce the detection areaA. Denotingf as the focal length of the lens, a distancediexists
for which the lens will give a sharp image of the surface’s symbol (A=M), see Fig. 7. The relationship betweenf and di is defined by Newton’s lens formula:
1/f = 1/di+ 1/dp. (4)
The size of the sharp imagesi atdiis given by the formula:
si=spdi/dp. (5)
Then, using geometrics, we find that:
A=spD/dp+sg|(D−di)/di|. (6)
1) Operational regions: These equations provide four re-gions that determine the final design of our receiver:
• Region 1. f ≤ 12dp ⇒0 < di ≤ dp. In this case, the
lens’ focal length is too short, makingditoo short for our
applications. This region would only help if the distance between the object and receiver is less than the size of the receiver. Hence, we do not consider this region. • Region 2. 12dp < f < dp ⇒di > dp. This is the most
relevant region to us due to two reasons: i) the receiver can be designed to match di with the expected distance
D, optimizing the amount of reflected energy (A=M); ii) this region always leads to surfaces with narrower stripe widths compared to the case without lens (even for the cases wherediandDdo not match). This occurs
because the factor multiplyingsgin Eq. 6 is less than the
corresponding factor for the case without a lens (Eq. 2). • Region 3. f = dp ⇒di = ∞, which is useful for very
long distances between the object and the receiver. In this case, the detection area size is A=spD/dp+sg. Note
thatAagain is always smaller than the case without lens, because sg now is multiplied by a factor of one.
0 50 100 150 200
Object distance (cm) 0
0.5 1 1.5 2
Received luminous power
(normalized)
With lens (f = 4.9 cm) With lens (f = 6.5 cm) With lens (f = 12.9 cm) Without lens Measured (no lens) Measured (f = 6.5 cm)
0 50 100 150 200
Object distance (cm) 0
5 10 15
Detection area (cm)
With lens (f = 4.9 cm) With lens (f = 6.5 cm) With lens (f = 12.9 cm) Without lens
Fig. 8. Total luminous power on the sensor (left) and size of the detection area (right) for several focal lengths.
• Region 4. f > dp⇒di is negative, which results in an
image on the same side of the lens as the object. Not an ideal case, but it may be the only design option if the size of the receiver is small and the focal length is long. 2) Evaluation and summary: We perform simulations, based on our ray-trace model, and empirical measurements to validate our insights. The parameters used in this evaluation, sg = 4mm, sp = 1mm and dp = 7.2cm, are the same as
the ones used in our final receiver in Sec. V. Fig. 8 shows the results with the received luminous power normalized with respect to the case without lens. We simulate three lenses: one in Region 4 and two in Region 2, one close to Region 3 (f = 6.5cm) and the other further away (f = 4.9cm). For our purposes, the second lens (f = 6.5 cm) is better because it provides a longer di (66 cm compared to 15 cm
for f = 12.9cm). Our empirical results show that, for that lens, the received light intensity can increase 33% on average (57% in simulations), while the stripe width can be reduced to encode three times more information.
In summary, adding a lens improves the performance of our channel in two ways: it increases the amount of information that can be transmitted and increases the luminous power on the sensor. Note that dp is very small, e.g. only a few
centimeters when D is several meters, making the proposed solution feasible in reality. In general, for a given scenario, the focal length f of the lens should be selected in such a way that 12dp < f ≤ dp (Regions 2 and 3), depending on
the typical distance between the object and the receiver. Note that fluctuations in D are fine if they are not large. Small fluctuations will only bring limited distortions on the signal.
C. Channel impulse response
The analysis presented in Sec. III-B is incomplete because it does not consider that the communication channel distorts the modulated (reflected) signal while it travels from the surface to the receiver. Analyzing these distortions is key to correctly decode information. To have a complete understanding of our system, we continue to analyze the channel response.
0 0.4
0.2 0.5
0.4
Luminous power per area
(normalized)
0
2D Channel response at 37.4 cm
X-position (cm)
0.2
Y-position (cm)
1
0 -0.2-0.4 -0.4-0.2
0 0.5
-10
Received luminous power
(normalized)
2D Channel response at 37.4 cm
5
X-position (mm) 1
0
Y-position (mm)
0 -10-5
-15 10
Fig. 9. Simulated (left) and measured (right) channel response at 37.4 cm showing the small area from which light reaches the sensor.
-15 -10 -5 0 5 10
X-position (mm) 0
0.2 0.4 0.6 0.8 1
Normalized channel response
1D Channel response at 37.4 cm
measured simulated geometric
-10 -5 0 5 10 15
X-position (mm) 0
0.5 1
Normalized channel response
1D Channel response at 101 cm
measured 1 measured 2 measured 3 measured 4 simulated geometric
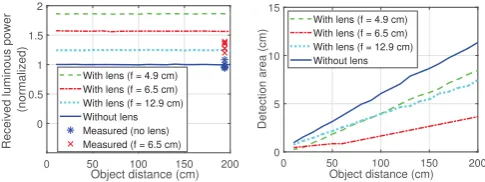
Fig. 10. Measured and simulated channel response at 37.4 cm (left) and 101 cm (right). The red vertical lines show the values ofA(geometric model).
h(x), whereg(x)is the message. Our goal is to determineh(x) so we can estimate the signal Y(x)expected at the receiver.
We obtainh(x)by determining the luminous power on the sensor when an ‘infinitesimally narrow stripe’ (the geometric equivalent of the dirac delta function) passes the detection area A. We deriveh(x)via simulations as well as empirical measurements. For the simulations, we divide the underlying surface into a fine-grained grid, and use our ray-based model to quantify the amount of light reflected from each grid cell. For the empirical results, we use an e-ink display as a surface because it reflects light diffusely and allows a fine-grained control of pixels (white or black).
We perform tests outdoor with two differentD: 37 cm and 101 cm. We use sunlight to illuminate the surface. Fig. 9 shows the light intensity received from each ‘pixel’ for D=37cm (simulations and empirical measurements). Fig. 10 shows the channel response for both distances, but considering only the position of the tag (x) as an input (1D response). The most important observation is that the channel distorts a perfect square-wave message into a Gaussian-like signal. If we had used surfaces with specular reflections (mirror-like materials), the channel response would have been different (likely closer to a square-wave). Fig. 10 also shows that the normalized geometric (cf. Eq. 6), simulated (ray-tracing approach) and empirical results match each other, and the accuracy increases as the distance between the object and the receiver increases. This high accuracy is due to the fact that light waves are not affected by multipath as severely as radio waves are.
D. Inter-symbol interference (ISI)
The impulse response obtained in Sec. III-C considers a single type of diffuse material. Our messages, however, will have materials with different reflective properties:HIGH and LOW. Furthermore, not all objects may pass at the expected distance D, some may have longer distances, and thus, the
receiver’s FoV may cover more than one stripe at a time, causing inter-symbol interference (Fig. 3). If the distance is shorter, the FoV will only cover one stripe, and there will be no inter-symbol interference (ISI). Considering ISI, an important question arises:what is the performance of our channel under more realistic settings?The channel response introduced in the previous subsection will allow us to analyze this problem in detail utilizing eye diagrams. Consider for example a moving car carrying the following messages:111,110,001, and010. All messages have a stripe widthW = 3.5 cm. The distance between the receiver and the car is approximately 3 m. The parameters for the receiver are: sg = 4mm, sp = 1.7mm,
dp= 7.2cm. These parameters lead to a value ofA= 8.5cm.
Thus, the message 111could be seen as a pattern equivalent to having a stripe of width3×W = 10.5cm, which is greater than A(no ISI effect). The message 110could be seen as a pattern with a stripe width2×W = 7 cm, slightly narrower thanA(minimal ISI effect). The messages100and010could be seen as a pattern with a stripe of width1×W= 3.5 cm, significantly lower thanA. In fact, more than two symbols are under the FoV (strong ISI effect).
If we convolve these messages and all other combinations of 1s and 0s with our channel response, we obtain the signals shown in Fig. 11 (left). These signals are the expected (simulated) performance of our system. The message 111 creates a wide peak. Such wide peak appears as a flat blue signal at the normalized intensity 1. The message000appears as a flat black signal at the normalized intensity 0. This type of signals are easy to decode because any threshold between 1 and 0 can be used to differentiate between HIGH and LOW symbols. But if we start reducing the stripe width, thesignal’s peaks can be lower due to ISI: the reflections of HIGH and LOW symbols mix up together under the same FoV. The data rate could increase, but decoding becomes harder. Consider for example the signals generated by messages 101 and010 (captured by the ‘eye’). To decode information, we would need to use a threshold within a much narrower range (between 0.4 and 0.6), and we would only have a window of 3 ms within a symbol to utilize that threshold reliably (between -1.5 and 1.5 ms). Note that even though W = 3.5cm is only 40% of the length of A = 8.5cm, we can still decode information. The reason for this phenomenon is the circular coverage of our receiver which naturally gives a higher weight to the stripe at the center of the circle. For example in Fig. 3, the broad FoV covers three symbols, but the black stripe at the center covers (proportionally) a larger area.
The same setup used in the above simulations is then evaluated empirically with a car moving on a street, shown in Fig. 11 (right) (the details of the evaluation are presented in Sec. V). The problem in real scenarios is that fluctuations in the illumination or in the reflection coefficients of the surface can reduce the height of the ‘eye’ significantly, making the decoding process less reliable.
-2 0 2
Time (ms)
0 0.5 1
Normalized signal intensity
Simulated eye pattern at 3 m White stripe Black stripe Eye
-2 0 2
Time (ms)
0 0.5 1
Normalized signal intensity
Eye pattern from measurements at 3 m White stripe
Black stripe Eye
Fig. 11. Simulated (left) and measured (right) eye diagram for our channel with a stripe size of 3.5 cm moving at 12 m/s at a distance of 3 m.
Fig. 12. A constant sampling rate usually works (left), but if the signal frequency fluctuates (middle), it is better to detect edges (right).
Prior studies pursued this approach [3], but they had to use wide stripes (10 cm) stripes at just 1 m distance. In traditional communication systems, threshold-based methods are efficient because the transmitter can adjust the output power and sym-bol duration to create wide-enough eye diagrams based on the channel conditions. But we have no control over the emitted signal. In Sec. IV, we will propose an alternative decoding method for our new channel. Second, the eye diagram can help us determine a lower bound for the minimum stripe width W. Using a stripe width equal to A (geometric model) is a conservative choice because the FoV can cover more that one stripe and still decode data reliably. Using a stripe size greater thanA/2would still allow the eye to remain wide enough to decode symbols reliably. In Sec. V we will validate this claim and show that if empirical measurements can be performed, the stripe width could be reduced belowA/2.
IV. DECODINGINFORMATION: RESILIENCE TO DYNAMICS
In traditional communication systems, a preamble is used to obtain parameters to decode a frame. This approach is efficient because the transmitter controls the output power and timing, and thus, the symbol properties (amplitude and duration) do not change (much) between the preamble and the payload. In our system, signals can change in amplitude and time, causing decoding errors if traditional approaches are used, Fig. 12. For example, when multiple stripes are under the FoV (a requirement to maximize the data rate of our channel, c.f. Sec. III-D), the amplitude changes depending on the number of consecutive ones and zeros, Fig. 12 (left). The peaks are higher when two HIGH symbols are together (instead of just one HIGHsymbol) because more light is reflected back. The issue of timing is also problematic, Fig. 12 (middle). A signal could be stretched out or compressed, and the decoding process would lead to more (or less) bits than the original reflections. The state-of-the-art [3] applied dynamic time warping to solve this problem. However, its computing complexity is high and it requires a training dataset with signals for all possible tags. To overcome our decoding challenges, we took inspiration from barcode scanner techniques [12], [13]. We borrow two key concepts from these methods. First, we use edge detectors to identify the symbolboundariesinstead of symbol duration.
0 0.02 0.04 0.06 0.08 0.1
Time (s) 0
0.5 1
Decoded signal
0 1 00 11 0 1 00 1 0 11 00 1 0 1 0 1 00
0 0.02 0.04 0.06 0.08 0.1
-1 0 1
Edges
0 0.02 0.04 0.06 0.08 0.1
2000 2400
ADC Output
Received barcode signal and decoding
A D
C B
Fig. 13. The algorithm uses edge detection (middle) on the received signal (top) to retrieve the barcode signal (bottom).
This approach ameliorates the problems related to variable speeds. Second, we gather information from the entire packet before starting the decoding process, as opposed to using only information from a preamble. This approach allows us to decode bits based on edge transitions instead of using thresholds prone to fail due to (varying) amplitudes. We use these key concepts and optimize our algorithm to work with the uncontrollable properties of the object (speed, distance) and environment (illuminance). Note that our system is sig-nificantly more challenging than standard barcode readers, due to the much longer distances, the uncontrollable objects, and the uncontrollable light source.
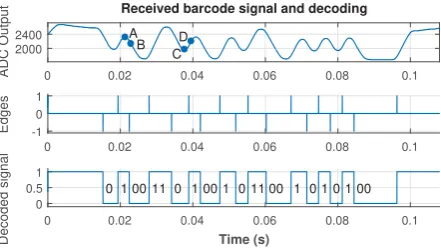
Our algorithm works for any code with the property that the maximum number of consecutive 0sor1sis two, as in popular line coding schemes such as Manchester Coding [14] and interleaved-2-of-5 (ITF) [15]. We use an example from our outdoor evaluation to assist the description of our decoding algorithm, see Fig. 13. The signal captured at the receiver is shown in Fig. 13 (top). We select four points in the figure,A, B,C,D, to facilitate the description. Let us denote the tuple < rx, tx>as the signal valuerxand timestamptxmeasured
at the receiver for samplex. Our decoding algorithm works in two steps:edge detectionandedge mapping.
Step 1: edge detection.Our algorithm detects an edge when the signal rx has changed at least r. The threshold ris
heuristically chosen by the algorithm, depending on the light conditions. Consider the two points A and B in Fig. 13. If
|rB−rA| ≥ r, then an edge is detected. The polarity of
the edge depends on the signal values at point A and B. If rB< rA, then it is considered as a fallingedge; otherwise it
is considered arisingedge (pointsCandD). When an edge is detected, the time stamp is stored into a setT. To prevent an edge being detected again, a ‘detected’ edge is only considered as new if the polarity is different from the previous edge.
LetNdenote the number of detected edges. For the barcode in our example, the detected edges are drawn in Fig. 13 (middle). In this example, we haveN = 18. Among them,9 are falling edges and9are rising edges. The set of timestamps for the edges becomes T = {t1, t2, . . . , tN}. The first edge,
t1, marks the start of a message, all the other edgest2, t3, . . .
Fig. 14. Receiver:left)diagram;right)snapshot Fig. 15. Disk
Step 2: edge mapping. The detected edges are mapped to symbol sequences according to the time intervals between each two consecutive edges. Denoting the interval between the nth edge and its previous edge asδn, namely
δn=tn−tn−1, ∀tn∈ T \t1. (7)
Our algorithm maps a rising edge ninto bits as below:
A rising edge−→
bit0, δn< kδ
bits00, otherwise, (8)
where δ is a time threshold used to determine the number of symbols between two edges (explained later), used together with the empirical constant k. For our system, we chosek=
√
2to maximize robustness. Similarly, a falling edge can be mapped to bits 1or11, depending on the value ofδn. Edges
withδn>3δ mark the boundaries of a tag message.
We denote the set of δn as S = {δ2, δ3, . . . , δN} and we use the following steps to determine the threshold δ:
1) Find the minimal time interval δmin= minδn∈Sδn;
2) Define a new setSof the time intervals. In our algorithm,
S≡ {δn:δi< kδ
min,∀δn∈ S}
3) Calculateδ by averaging the elements in the new setS. Based on the above described edge mapping, the detected edges in the example can be finally mapped to the correct bit string as shown in Fig. 13 (bottom).
V. PERFORMANCEEVALUATION
In this section, we first combine the theoretical and empir-ical insights gathered in Sec. III to derive the optimal stripe width, which provides the highest data rate for our channel. Then, we evaluate our system in two different setups. The first experimental setup is created indoors on a small scale, such that the experiments can be easily repeated to test the impact of different parameters. The second setup is on a larger scale, performed outdoors with a car communicating information through an embedded tag.
Receiver.A prototype of our receiver is shown in Fig. 14. It is built with the following parameters: sp = 1mm (for
indoor experiments), sp= 1.7mm (for outdoor experiments),
sg= 4mm,dp= 7.2cm,f = 6.5cm. The additional distance
dg between the gap and the lens is1.6cm. The optical signal
is sensed with a phototransistor, rather than with photodiodes (as used in [3]). This has the advantage of greatly increasing the sensitivity of the receiver, at the cost of reducing the bandwidth. However, our communication channel does not require high rates as it will be shown in the experiments. The electrical signal after opto-electrical conversion is sampled by an ADC at a rate of50kHz.
50 100 150
Distance (cm)
0 0.2 0.4 0.6 0.8 1 1.2
Minimum width (cm)
Minimum stripe width (sp = 1.0 mm) geometric (A/2)
simulated measured
100 200 300 400
Distance (cm)
0 1 2 3 4 5 6
Minimum width (cm)
Minimum stripe width (sp = 1.7 mm) geometric (A/2)
simulated measured
Fig. 16. Minimum stripe width for the indoor (left) and the outdoor (right) experimental setups. The geometric estimation representsA/2.
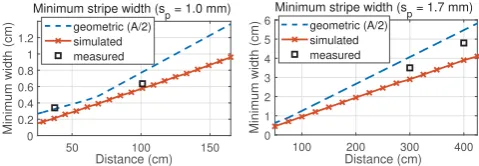
A. Optimal stripe width
One of the goals of this paper is to find the minimum required stripe width, such that the conveyed information can be maximized. We compare the stripe widths obtained with our geometric model, simulations and empirical evaluations in Fig. 16. We divide the figures for the indoor and outdoor scenarios because we use a photosensor with sensing area sp= 1mm indoors andsp= 1.7mm outdoors.
A designer willing to use our channel will first need to determine the maximum distanceD between the receiver and the object. Then, based on the constraints on the size of the receiver, the designer needs to place a lens, aiming atD≈di.
After that,Acan be calculated. If the stripe widthWis greater or equal than the geometric boundA, the system is expected to work reliably (no ISI), but in Sec. III-D we showed that more than one symbol can be present under the FoV and the system can still decode information. Geometrically, we can state that if the stripe widthW is greater thanA/2, the dominant stripe under the FoV (HIGH orLOW) will still reflect (or absorb) enough light to allow a reliable decoding (blue dotted lines in Fig. 16). If the designer uses the channel response, an absolute lower bound can be simulated for the stripe width (red lines in Fig. 16). A system on this absolute lower bound, however, will lead to a minimal amplitude difference in the eye’s height, making the system unreliable. If empirical tests can be performed in the scenario of interest, the minimum stripe width can be reduced using eye-diagrams of the received signal. We did this optimization for the indoor and outdoor experiments, squares in Fig. 16. All in all, we can observe that the geometric bound (A/2) is a safe choice, and that a fine-tuned empirical approach will lie in-between the geometric and simulated curves.
B. Indoor evaluations
The indoor experiments are performed in a small-scale setup to provide repeatability. A spinning paper disk with a barcode striped pattern, shown in Fig. 15, is used as a tag that repeatedly transmits the same message (the code is01010100 11001010110101001011001100). The disk is driven by a DC-motor that can be programmed to adjust the speed. Different disk-receiver (i.e. object-sensor) distances are tested.
50 390 Varying
Symbol rate (baud)
0 20 40 60 80 100
Decoded messages (%)
Ours SoA
120 440 Varying
Symbol rate (baud)
0 20 40 60 80 100
Decoded messages (%)
Ours SoA
low sunlight
Intensity of ambient light
0 20 40 60 80 100
Decoded messages (%)
Ours SoA
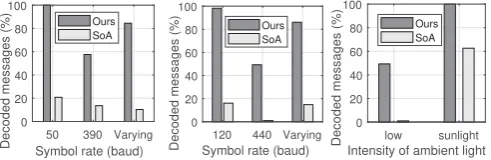
Fig. 17. Impact of object’s speed and ambient light intensity: the object-sensor distances is 37 cm (left) and 70 cm (middle&right), respectively. (SoA: [3])
baud. The decoding ratio drops to around 58% when the object moves at a higher speed such that the symbol rate is 390 baud. This drop is due to the distortion of the received signal caused by the non-ideal behavior of the receiver, which becomes predominant in low-light conditions. Second, we can observe that with a varying speed of the object (symbol rate changing from 50 to 390 baud), our algorithm is still able to decode the message at a high rate, 85%, because it can compensate the speed fluctuations partially. In contrast, state-of-the-art [3] (referred as SoA) can only decode about 10% of the messages due to its limited robustness to speed variations. Finally, we can notice that even when the object moves at constant speeds, our decoding algorithm still outperforms the SoA greatly. The reasons are two-fold: (1) the intensity of ambient light changes slowly which affects the performance of the SoA, while our edge-detection algorithm is resilient to the intensity changes in ambient light. (2) The SoA relies on perfect detections of the peaks and valleys of the preambles [3], which cannot be accurately carried out in practical scenarios. We then place the sensor at 70 cm from the object. The results are given in Fig. 17 (middle), where we can observe that our decoding algorithm still outperforms the SoA.
2) Impact of the intensity of ambient light: In this scenario, we compare the performance of our system in a low-light condition (about 500 lux) with the setup exposed to direct sunlight, which provides much higher illuminance (1000s of lux). We utilize the high symbol rate case: 440 baud for 70 cm. This high symbol rate did not provide 100% decoding ratios with low lighting conditions. The evaluation results are shown in Fig. 17 (right). We can observe that with higher illuminance, our algorithm achieves 100% decoding ratio with sunlight, which doubles the decoding rate achieved under a low-light condition. This result exposes a nice property of optical receivers: the higher the illumination, the higher the symbol rates the system can handle. This occurs because optical sensors react to the amount of photons that it receives for a given unit of time. Thus a fast moving stripe at a high illumination can provide more photons than a slow moving stripe at a low illumination.
C. Outdoor evaluations
For the outdoor experiments we attach a tag to a car’s side as shown in Fig. 18. Paint could be used to create a tag, but we printed tags on paper to have two exchangeable tags: (i)
SparseTag: a 21-bit string with a stripe width of 4.8 cm (the
Fig. 18. Outdoor setup. 0 5 10 Time (ms)15 20 25 30
0 0.5 1
Normalized signal strength
Experimental Simulated Input signal
Fig. 19. Received signal: experiment vs. simulation.
TABLE II
EVALUATION RESULTS IN OUTDOOR SCENARIO
Code Distance Speed Our method SoA [3]
SparseTag 3 m 40 Km/h Decoded Decoded 4 m 53 Km/h Decoded Decoded
DenseTag 2.5 m 40 Km/h Decoded No
3 m 40 Km/h Decoded No
code is00101010011010010110010);(ii)DenseTag: a 37-bit string with a stripe width of 3.5 cm (the code is001010110011 0101001011001101001011010). The receiver is placed by the roadside at distances ranging from 2.5 m to 4 m from the tags attached to the car. Due to the speed limit on the road, we could not drive the car faster than 55 km/h.
rate of 308 baud in our ITF message). The figure shows a clear signal that can be easily decoded. For the DenseTag, our algorithm can decode it at a distance of 3 m with the car moving at a speed of 40 km/h, that is, achieving a throughput of 123 b/s (corresponding to a symbol rate of 296 baud in our ITF message). The DenseTag cannot be decoded by the method presented in [3] because the narrower stripes are more prone to deviations in amplitude and symbol duration.
Overall, our analysis of this new type of channel not only provides novel insights about its fundamental properties, but also improves its performance across multiple dimensions.
VI. RELATEDWORK
Our system is inspired by the concept of passive communi-cation with ambient light introduced in [3]. But this work is the first to investigate deeply the properties of this new channel. We propose a framework to derive the optimal stripe width to maximize the amount of encoded information, and ensure that it can be decoded reliably. We exploit lenses to increase simultaneously the data rate and the amount of light reaching the receiver. Further, we propose a decoding scheme to solve the problems caused by variable amplitudes and symbol dura-tion. None of these optimizations were considered by [3], and thus, our work significantly enhances the performance of this new type of channel. We are also inspired by other seminal studies. In particular:
Backscatter communication.Our system is a type of scatter communication [16]. For radio waves, ambient back-scatter introduced a new generation of RFID tags that exploit existingartificial RF waves [17]. These tags are energy-neutral, as the tags harvest energy directly from the surrounding RF waves. The amount of harvested energy is too small to excite an antenna, therefore, the tags absorb and reflect surrounding RF waves to communicate. This concept has been used to create 3D printed sensors that communicate with WiFi devices without the need of batteries or electronics [18]. Compared to the above works, our tags do not need complex electronics nor rely on artificial (human-generated) waves. Our system ex-ploitsnaturalsunlight waves, which have completely different properties compared toartificially modulated RF waves.
Recently, Retro-VLC [2] and PassiveVLC [4] have explored backscattering with visible light communication. Both works create a bidirectional link between anactivelight source that transmits data to a receiver using traditional VLC. For the up-link, the receiver replies back using an LCD shutter to change the reflected light in time. Similar to radio backscattering, they use local clocks to modulate the reflected light. We have no such control, we explore backscattering for unmodulated light sources andmobilenodes. A high-level comparison with works in VLC backscatter is provided in Table III.
Embedding information into objects. Recent advancements have embedded information into objects using ‘physical bar-codes’ [19], [20]. But the tags only contain static information and require expensive RF equipment to be read (220 000 USD [20]). A more recent study enables data storage and interaction with smart fabric without onboard electronics [21].
TABLE III
COMPARISON OF WORKS INVLCBACKSCATTER(TX: transmitter)
Name Throughput Range Control of TX Electronics in Tags
Retro-VLC 0.125 kb/s 2.4 m Yes Yes
PassiveVLC 1 kb/s 2 m Yes Yes
Our work >0.12 kb/s 4 m No No
Our tags may also be embedded into smart fabric, but more work is needed to enable such communication channel.
VII. CONCLUSION
In this work we, for the first time, optimized the operation of a new communication channel based on sunlight. Our thorough analysis enhanced its performance across multiple dimensions: longer ranges, higher data rates, higher object speeds and more robustness. This new area is promising and there are still many challenges to overcome, e.g. our system does not work well in darker scenarios at the moment. In the future, we will design advanced receivers and new methods to over these limitations.
ACKNOWLEDGMENT
This work was supported in part by the Social Urban Data Lab (SUDL), Amsterdam Institute for Advanced Metropolitan Solutions (AMS), and the FWO postdoctoral fellowship.
REFERENCES
[1] V. Liu, et al, “Ambient backscatter: wireless communication out of thin air,” inACM SIGCOMM Computer Communication Review, 2013. [2] J. Li, et al, “Retro-VLC: Enabling Battery-free Duplex Visible Light
Communication for Mobile and IoT Applications,” inHotMobile, 2015. [3] Q. Wang, M. Zuniga, and D. Giustiniano, “Passive communication with
ambient light,” inACM CoNEXT, 2016.
[4] X. Xu, et al, “PassiveVLC: Enabling practical visible light backscatter communication for battery-free iot applications,” inMobiCom, 2017. [5] X. Chen, Y. Chen, Z. Ma, and F. Fernandes, “How is energy consumed
in smartphone display applications?” inACM HotMobile, 2013. [6] K. Immink, “Runlength-limited sequences,”Proc. of the IEEE, 1990. [7] J. H. Lambert,Photometria. Eberhard Klett Verlag, 1760.
[8] P. Pathak, et al, “Visible light communication, networking, and sensing: A survey, potential and challenges,”IEEE COMST, 2015.
[9] P. Ben´ıtez, J. C. Mi˜nano, and P. Zamora, et al, “High performance fresnel-based photovoltaic concentrator,”Optics express, 2010. [10] M. Wang, “Line focus barcode scanner,” 1999, US Patent. [11] W. Hough, “The methods of fire-making,” 1890.
[12] S. Shellhammer, et al, “Novel signal-processing techniques in barcode scanning,”IEEE Robotics Automation Magazine, 1999.
[13] T. Pavlidis, J. Swartz, and Y. P. Wang, “Fundamentals of bar code information theory,”Computer, 1990.
[14] S. Rajagopal, et al, “IEEE 802.15.7 VLC: modulation schemes and dimming support,”IEEE Communications Magazine, 2012.
[15] S. Youssef, “Automated barcode recognition for smart identification and inspection automation,”Expert Systems with Applications, 2007. [16] H. Stockman, “Communication by means of reflected power,”Proc. of
the IRE, 1948.
[17] B. Kellogg, A. Parks, and S. Gollakota, et al, “Wi-fi backscatter: Internet connectivity for rf-powered devices,” inACM SIGCOMM, 2014. [18] V. Iyer, J. Chan, and S. Gollakota, “3D printing wireless connected
objects,”ACM Trans. TOG, 2017.
[19] K. Willis, et al, “Infrastructs: Fabricating information inside physical objects for imaging in the terahertz region,”ACM Trans. TOG, 2013. [20] F. Moshir and S. Singh, “Wireless barcodes for tagging infrastructure,”
inACM MobiCom, 2014.