A Self-Organizing Algorithm for Community
Structure Analysis in Complex Networks
Hanlin Sun
∗, Wei Jie
†, Christian Sauer
†, Sugang Ma
∗, Gang Han
‡and Wei Xing
§∗Big Data Research Centre, Xian University of Posts and Telecommunications, China
†School of Computing and Technology, University of West London, UK
‡Department of Electronic Science and Technology, Northwestern Polytechnical University, China
§CRUK Manchester Institute, University of Manchester, UK
Abstract—Community structure analysis is a critical task for complex network analysis. It helps us to understand the properties of the system that a complex network represents, and has significance to a wide range of real applications. The Label Propagation Algorithm (LPA) is currently the most popular community structure analysis algorithm due to its near linear time complexity. However, the performance of the LPA has proven to be unstable and the correctness of community assignment of nodes is unsatisfactory. In this paper a Self-Organizing Community Detection and Analytic Algorithm (SOCDA2) based on swarm intelligence is proposed. In the algorithm, a network is modeled as a swarm intelligence system, while each node within the network acts iteratively to join or leave communities based on a set of pre-defined node action rules, in order to improve the quality of the communities. When there is not a node changing its belonging community anymore, an optimal community structure will emerge as a result. A variety of experiments conducted on both synthesized and real-world networks have shown results which indicate that the proposed algorithm can effectively detect community structures and the performance is better than that of the LPA. In addition, the algorithm can be extended for overlapping community detection and be parallelized for large-scale network analysis.
I. INTRODUCTION
A variety of real-world systems could be modeled as mathematical complex networks. Social networks, protein-protein interaction networks, the WWW, and the Internet, etc. are just some examples of such systems. These networks usually show some interesting properties such as high network transitivity, power-law degree distribution, the existence of community structure, and much more. The study of community structure can help us to understand those systems at a middle-scope level, just between the macroscopic level in which the whole system is considered and the microscopic level in which each node is analyzed individually. Actually the analysis of community structure has significance to many applications. For example, community structure analysis can be used in a social community or network (e.g. Facebook) which presents rela-tionships between community members. The analysis of such networks will help to design reliable friend recommendation systems. As another example, community structure analysis can be used in detecting communities of customers with similar purchasing interest in e-business network. This can lead to set up efficient recommendation system and thus improve business opportunities for product retailers.
An exact definition of community depends on the under-lying problem and its application. For example, the definition
could be based on degrees of node [1], cliques, clans, k-clubs [2], etc. Intuitively, a community is a group of nodes in a network that has more edges (connections) among its members but comparatively has less edges between its members and the rest of network nodes. This simple concept is the core of nearly all community definitions.
Community structure analysis of complex networks has attracted much interest and a number of algorithms originating from different fields, such as physics, statistics, data mining, and evolutionary computation, etc., have been proposed. There are many different strategies behind these community detection algorithms, such as divisive hierarchy, agglomerative hierarchy, random walking, information diffusion, spectrum analysis, statistical inference, and much more. A comprehensive review of these methods has been conducted, for example, a survey of community discovery methods was provided with a special focus on techniques designed by statistical physicists [3]. The meta definitions of a community in a complex network was given, and the majority community discovery methods was summed up based on their own definitions [4]. However, most of these traditional algorithms are incapable of working in large-scale network community structure analysis mainly because of their heavy computational cost or model limitations, e.g., requiring priori information of community structure, data structure representation of community structure, etc.
In this paper, we propose a Self-Organizing Community
Detection and Analytic Algorithm (SOCDA2) based on the
idea of Swarm Intelligence (SI). SI is the collective behavior of decentralized and self-organized systems, either natural or artificial. The expression was introduced in the context of cellular robotic systems [11]. Generally, in an SI system, there is a large number of simple individuals who can only perform simple actions and interact with nearby neighbors locally as well as with the environment. Intelligence emerges as a consequence of the sum of these simple actions and interactions. It is believed that SI seems not to be a coin-cidence but rather a property of a variety of systems. We treat an analyzed network as a SI system, in which each node decides its own actions, i.e., leaving its original community (communities) or joining into new communities, depending on whether the action could improve the quality of the related community. Obviously, a node can only form a community (or communities) with its neighbors, thus the communities that a node acts to join are those its neighbors are belonging to also. The community (communities) a node is staying and those of its neighbors belonging to, form the environment a node makes its own decision. An optimal community structure will finally emerge as each node acts iteratively, until no node changes its community anymore. Due to the fact that nodes make actions by referencing a whole community rather than just one hop out of labels as in LPA, the quality of the community structure that emerges is more likely to be better.
In fact, SI covers a number of algorithms inspired by natural bio-systems including the Genetic Algorithm (GA) and the Ant Colony Optimization (ACO) algorithm. Both of the two algorithms were used for community structure analysis [12], [13]. However, due to the limitation of the representation method for evolutionary individuals, the GA based algorithm cannot be used for large scale network analysis. As for the ACO based algorithm, it has a number of parameters to be set which introduces great complexity. Instead, our algorithm does not imitate any specific bio-system, and it is an artificial swarm system built on the basic idea of SI. Our algorithm is free of parameters except two simple ones in initialization and post processing.
The rest of this paper is structured as follows. In section II, we formally describe our algorithm and discuss its advantages and limitations. Then in section III, we show the evaluation results of our algorithm on both synthesized and real-world networks. Finally, section IV concludes the paper.
II. ALGORITHM DESCRIPTION
In this section, we will describe our proposed SOCDA2
algorithm in detail, including community structure represen-tation, community structure initialization, community assess-ment, node evolution, post process and more.
1) Community Structure Representation: In our algorithm, each node needs to know communities of its own and its neighbors’ for evolution decisions. It is straightforward to let each node remember the members of the community to which it belongs. However, when a node changes its community belonging, it is difficult to notify the related nodes of the changes if there is not a convenient communication way between the nodes. Here the related nodes include the members
1 2 3 4 5 6 7
1
2 3
4
5
6 7
1
2 3
4
5
6 7
2 1 1 2 6 5 5
1 2 3 4 5 6 7
2 3 4 -- 6 7
---- 1 2 3 -- 5 6
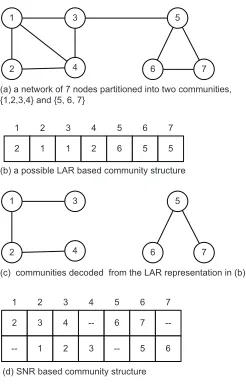
(a) a network of 7 nodes partitioned into two communities, {1,2,3,4} and {5, 6, 7}
(b) a possible LAR based community structure
(c) communities decoded from the LAR representation in (b)
(d) SNR based community structure
Fig. 1. An example of SNR in a community structure
of the community from which the node leaves and the members of the community to which the node joins. Since our focus is on node action rules, the community structure and the graph topology are stored in central data structures, in particular, we propose a Sequential Node Representation (SNR) to remember the community structure of a network in our algorithm. The SNR is inspired by the Locus-based Adjacency Representation (LAR) [14], which is usually used in evolutionary community detection algorithms (such as genetic algorithm based) for individual representation.
In LAR, a community structure is encoded in an N
-dimensional vector while N is the number of network nodes.
Each component of a vector represents a node of the network, and the value of a component is a neighbor identifier of the corresponding node. These nodes linked together by their neighborhood connections form a community. For example, in a network with seven nodes partitioned into two communities as shown in Fig.1 (a), a possible LAR community structure representation is depicted in Fig.1 (b), in which each compo-nent is a neighbor of a corresponding node. By sequentially decoding the LAR representation, i.e. finding the connected node groups, the community structure of the graph could be extracted, as shown in Fig.1 (c).
Our SNR representation method denotes the community
structure of a network in aN×2-dimensional matrix, or a
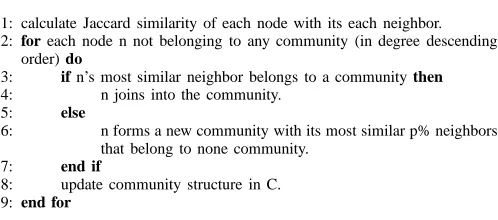
ALGORITHM 1: community initialization INPUT: graph adjacent matrix ’G’; ratio ’p’ OUTPUT: community structure ’C’ in SNR
1: calculate Jaccard similarity of each node with its each neighbor. 2: for each node n not belonging to any community (in degree descending
order) do
3: if n’s most similar neighbor belongs to a community then 4: n joins into the community.
5: else
6: n forms a new community with its most similar p% neighbors that belong to none community.
7: end if
8: update community structure in C. 9: end for
Fig. 2. Core community structure initialization algorithm
the members of the community to which node 3 belongs, from the third column, along the forward-link, node 4 is found, and along the backward-link, nodes 2 and 1 are recognized. Note that it is also simple to update a community, i.e., to add a node into or delete a node from a community. The addition or deletion is simply bi-linked list insertion or deletion operations.
2) Community Structure Initialization: The initialization is
the first step in SOCDA2. The initialized core community
structure has impacts on node evolution performance and the quality of the finally obtained community structure. The initial communities are built based on the structural similarity between nodes defined as
S(i, j) = |N(i)∩N(j)|
|N(i)∪N(j)|, (1)
where N(i)and N(j)are the neighbor node sets of node i
and j, respectively. Apparently, the more common neighbors
two nodes have, the more similar they are. In the initialization procedure, at first, we calculate similarities between each node and all of its neighbors. Then, a node which is not part of any community will have two choices: (1) it joins the community to which its most similar neighbor belongs if the community exists, and (2) it forms a new community with its most similar p% neighbors who do not belong to other communities yet. If the first choice is impossible, then the second is employed. The node with large degrees is processed preferentially as it has more chance to form a better core community. The designed core community structure initialization algorithm is summarized in pseudo code in Algorithm 1 as shown in Fig. 2.
3) Community assessment: A node evolves its community belongings depending on the impacts of its actions on the related community. That means it needs a community quality measure method. We use the Normalized Conductance (NC) [15] as the community quality assessment function in our algorithm. Denote the member node set of a community as
A, and the rest node set of the network asB, then the NC is
defined as follows:
C(A) = eAA
eAA+eAB
− eAeA
eAeA+eAeB
, (2)
while eAA is the number of edges within A andeAB is the
number of edges between A and B. The eA =eAA+eAB
andeB =eBB+eAB.
4) Node evolution: Node evolution is the key step of the algorithm. Network nodes are considered as a swarm and each node in the swarm aims to act to create a better community structure. The community structure and the network topology are the environment in which the swarm lives. A node can only communicate with the environment and get the local information that includes: (1) the community to which the node belongs, (2) its neighbor nodes, (3) each neighbor’s communi-ty, and (4) the connections between these nodes, i.e., the partial topology related to nodes belonging to these communities. The node can decide its actions based on assessment of these communities.
Nodes can be classified into two categories, the inner node and the boundary node. An inner node has neighbors that all stay in the same community as the inner node itself (i.e., it has no connection with the rest nodes outside of the community), while a boundary node has some neighbors in the community it belongs to, and some neighbors who belong to other communities. Obviously, an inner node does not need to change its community attribution, while a boundary node will evolve to make better communities.
In general, there are two main types of questions a node needs to answer: (1) ”Should I leave the community in which I’m staying?” To answer this, the node compares the quality score of the community before and after it (potentially) leaves. If the former is greater, then the node does not leave its original community, else the node will leave. (2) ”For each neighbor’s community, should I join into it?” It is worthwhile mentioning that: (a) some neighbors may coincidently stay in the same community as the node, and it is not necessary to join into the community the node already stays in, and (b) some neighbors themselves may stay in a same community, thus the node only needs to decide once that if it should join to the community. We refer these unique communities of neighbors as independent communities, therefore a node only needs to decide whether joins to these independent communities. To answer this, likewise the first question, the node compares the quality score of the community before and after (potentially) joining and makes a decision based on the comparison result. The objective of deciding on the leave or join action is to make the related community become better. Therefore, we say a node has ”good-will” or ”aims to” improve the community structure.
Most possibly, a node may join into several communities simultaneously. It is necessary to merge some communities if the quality of the merged community is better than the sum of each quality. The merging action will induce acceleration of
community growth. If there areKcommunities a node belongs
to, then there will be(2K−K−1)candidate merging strategies.
IfKis a large number, it is time consuming to try all possible
strategies. Unfortunately, initially K is usually large. For
simplicity, now we only try to merge two possible communities for which the mergence will induce the maximum increment of quality score. The members of other communities that should be merged could be finally added into the community gradually in later evolution steps.
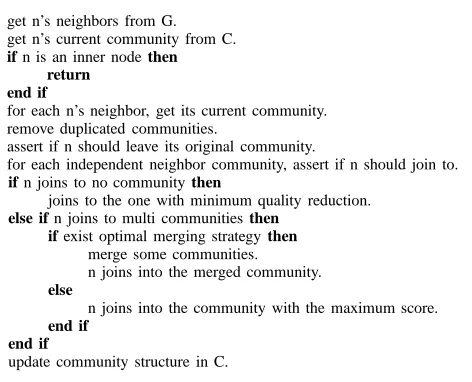
ALGORITHM 2: node evolution
INPUT: node id ’n’; graph adjacent matrix ’G’; current community structure ’C’ in SNR
OUTPUT: updated community structure ’C’
1: get n’s neighbors from G. 2: get n’s current community from C. 3: if n is an inner node then 4: return
5: end if
6: for each n’s neighbor, get its current community. 7: remove duplicated communities.
8: assert if n should leave its original community.
9: for each independent neighbor community, assert if n should join to. 10: if n joins to no community then
11: joins to the one with minimum quality reduction. 12: else if n joins to multi communities then
13: if exist optimal merging strategy then 14: merge some communities. 15: n joins into the merged community. 16: else
17: n joins into the community with the maximum score. 18: end if
19: end if
20: update community structure in C.
Fig. 3. Community structure evolution algorithm
assume a node can only belong to one community at a time. If a node aims to joins multiple communities by its actions, the node will select the one with the greatest quality score to actually join it. In addition, we assume there is no isolated node, i.e. a node must belong to a community. If a node joins no community after its actions, it will then join the community with the minimum quality score reduction. The pseudo node evolution algorithm is illustrated in Algorithm 2 as shown in Fig. 3.
5) Post Processing: Once there is no node changing it-s community belonging anymore, the algorithm ait-sit-sumeit-s a community structure that is considered as the best, though the best outcomes of different runs of the algorithm may be different as a result of the randomness of the algorithm. Due to the quality measure function, the obtained community structure may contain some small sized communities which have only a few members. These small size communities are very possibly a part of a larger size community, that is to say, the algorithm could find fine-grained communities. We introduce a post process to merge small size communities below a threshold into an appropriate larger community. The criterion is that a small size community should be merged with the community which has the maximum neighbors of nodes in small size community as its members. The merging is carried out in the ascending order of the size of merged small communities. Note that if the communities to be merged are in the same size, they will be merged in a random order. The pseudo code of post processing is shown in Algorithm 3 as shown in Fig. 4.
The framework of our proposed SOCDA2 algorithm is
summarized in Algorithm 4 as shown in Fig. 5. The maximum evolution generation is a measure employed to make sure the algorithm terminate. Mostly, node evolution will end in a few generations. We will show this in later experiment. Note that in each generation, the nodes evolve in a new random order.
ALGORITHM 3: post processing
INPUT: detected communities ’dcoms’; merging threshold, ’TH’ OUTPUT: improved communities
1: sort communities according to their size in ascending order. 2: for each detected community do
3: if community size is less than or equal to ’TH’ then 4: get all neighbors of each member.
5: merge the community with the one having the maximum neighbors as its members.
6: remove this community. 7: end if
8: end for
Fig. 4. Community structure post processing algorithm
ALGORITHM 4: community detection
INPUT: graph adjacent matrix ’G’; evolution generation ’E’ OUTPUT: community structure ’C’ in SNR
1: call ’community initialization’(Algorithm 1). 2: while evolution generation is lesser than ’E’ do 3: generate a random node evolution order sequence.
4: call ’node evolution’ (Algorithm 2) for each node according to the sequence.
5: if no node changes its community belonging anymore then
6: break
7: end if
8: increase evolution generation. 9: end while
10: call ’post processing’ (Algorithm 3).
Fig. 5. Framework of the algorithm
This will introduce randomness into the algorithm. If no node evolves or the maximum number of generations is reached, the algorithm starts the post processing.
Comparing with LPA, the algorithm could be more likely to quickly find better community structure since its node action referencing the whole community. In LPA, a node selects its label mainly depending on the one-hop labels, which may have lost some network topology information. In addition, the quality assessment of a community (the evolution objective
of community structure) in the SOCDA2 algorithm could be
any one that relates with the definition of a community in the network, while in LPA a node can only join to the community of the definition that a node has more edges (connections) with those nodes in the same community, i.e., the node adopts the label that the most of its neighbors hold. Therefore,
the SOCDA2 algorithm could be potentially used in wider
scenarios.
Similar to LPA, randomness is also inevitable in the
SOCDA2 algorithm as nodes update their community joining
in a random order in each evolution generation. However, the impact of the randomness is much less than that of LPA
because in the SOCDA2 algorithm, a node can much likely
leave a community it has joined previously by mistake. The experiment described in next section will back this.
The SOCDA2 algorithm, however, still faces certain
label selection used in the LPA algorithm. Additionally there is the task of merging tries while a node joins into multiple communities simultaneously during evolution, for the space of candidate merging strategies may be huge. Moreover, as the algorithm is running, there will be more stable communities of which members will not change, i.e., these nodes having neighbors in such stable communities may repeatedly, but unnecessarily, re-compute the quality scores of such com-munities. This computation burden could be alleviated by remembering each community’s current score, and therefore the re-computation can be avoided.
III. EXPERIMENT AND EVALUATION
We used a variety of synthesized networks and real-world networks to check the ability of our approach to successfully detect the community structure of a network. We employed the modularity [16] and the Normalized Mutual Information (NMI) [17] to evaluate the quality of community structure. In addition, to depict more details about results, we calculated the statistics such as number of communities containing wrong members, incorrect assignment number of nodes, and maxi-mum number of mistakenly included members of communities.
We implemented the SOCDA2algorithm on MATLAB and ran
it on a virtual server with 8G memory. For comparison, we implemented the LPA algorithm on MATLAB as well.
A. Synthesized network experiment
For the synthesized networks we use the LFR model [18], which is popular in community detection algorithm perfor-mance evaluation. LFR network is characterized by a mixing parameterµ=zout/((zin+zout))that gives the ratio between
external degree of a node and its total degree. Thezinandzout
are the internal and external degree of a node with respect to its community, respectively. Asµ <0.5, the community structure is well defined. The parameters setting of the model used are: (1) average node degree, 20, (2) maximum node degree, 50, (3) exponent of degree distribution, -2, and (4) exponent of
community size distribution, -1. We generate networks forµof
0.3 and 0.4 with node number from 1000 to 10000, increment by 1000. The ratio parameter in initialization is 30% and the threshold in post processing is 10.
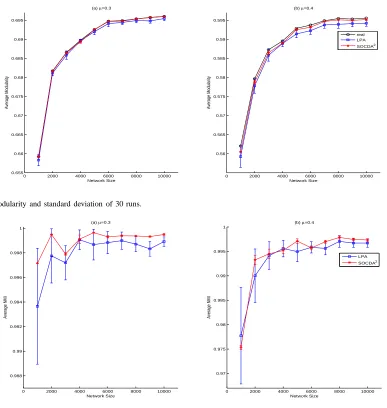
Due to the random property of both SOCDA2 and LPA
algorithms, for each network we ran both algorithms 30 times and computed the average quality score (and associate standard deviation) for each network. The modularity and NMI results are shown in Fig. 6 and Fig. 7, respectively.
These two figures indicate that: (1) in most cases, the
results of the SOCDA2algorithm are better than those of LPA,
either in modularity or in NMI, and the modularity scores of
the SOCDA2 algorithm are closer to the real ones; (2) the
standard deviations of the SOCDA2algorithm are smaller than
those of LPA, indicating the former is more stable; (3) in some cases, the conclusion from modularity disagrees the one from
NMI, e.g., as µ = 0.4 and network size is 1000, 4000 or
6000, the modularity score states the SOCDA2 algorithm is
better, while the NMI score declares LPA; and (4) though in most cases, the quality of the community structure discovered
by the SOCDA2 algorithm is better than that of LPA, the
absolute difference of values is not much significant. The third
and fourth phenomena can be explained by the fact that the modularity and NMI values are statistic and thus expose the quality of the community structure as a whole. Both values are affected by the factors such as the number of communities containing wrong members, the number of nodes assigned into incorrect communities and its distribution, and so on. Table I shows the statistics of some factors. (Due to space limit,
we only give out results of networks with µ = 0.4. Those
of networks with µ = 0.3 are similar.) Note that we put 30
runs of generating community structures together to get these statistic.
From this table, it is clear that: (1) the numbers of com-munities detected by both algorithms are equivalent; (2) in most cases, the number of communities including incorrect
member nodes found by the SOCDA2 algorithm is more than
that of LPA; (3) always the number of nodes of LPA joining
a wrong community is much more than that of SOCDA2
algorithm; and (4) the maximum number of incorrect members contained in a community determined by LPA is much greater
than that of SOCDA2 algorithm e.g., as can be seen, that
number of the SOCDA2 is just several, while that of LPA is
comparable with the size of a community (50 nodes). The first phenomenon indicates that the followed statistics is meaningful in that the situation is avoided that communities found by the
SOCDA2 algorithm are fine-grained, i.e., found communities
have a small number of members and thus consequently these small size communities very possibly contain less wrong members. The second and the third phenomenon state the
incorrect joining nodes of the SOCDA2distributes dispersedly
in more communities, while those of LPA concentrate in a number of communities. The fourth phenomenon backs this conclusion as well. As there are more communities with incorrect member nodes, though the number of which is quite small, the accumulated difference between these communities and the corresponding real ones may overrule the difference between a community structure which has a lesser number of communities but containing more incorrect members and the real community structure. This can explain the phenomenon
that the community structure detected by the SOCDA2
algo-rithm is sometimes worse than that of LPA from modularity or NMI view. In fact, in the community structure obtained
by the SOCDA2 algorithm, both of the number of incorrect
members within each community and the total number of nodes joining into incorrect community are less, therefore, from the application point of view, the quality of community
structure by the SOCDA2 algorithm is better. Fig.8 compare
the frequency distribution of the number of nodes joining into incorrect community.(Due to space limit, only results of
networks with µ = 0.4 are given. Those of networks with
µ= 0.3are similar.) Note that there is no number 0. The figure
further indicates the performance of the SOCDA2algorithm is
better. Therefore, it can be concluded that SOCDA2algorithm
is a better method for community structure in synthesized networks.
B. Real-world experiment
0 2000 4000 6000 8000 10000 0.655
0.66 0.665 0.67 0.675 0.68 0.685 0.69 0.695
Network Size
Average Modularity
(a) µ=0.3
0 2000 4000 6000 8000 10000 0.56
0.565 0.57 0.575 0.58 0.585 0.59 0.595
Network Size
Average Modularity
(b) µ=0.4
real LPA SOCDA2
Fig. 6. Average modularity and standard deviation of 30 runs.
0 2000 4000 6000 8000 10000 0.988
0.99 0.992 0.994 0.996 0.998 1
Network Size
Average NMI
(a) µ=0.3
0 2000 4000 6000 8000 10000 0.97
0.975 0.98 0.985 0.99 0.995 1
Network Size
Average NMI
(b) µ=0.4
LPA SOCDA2
Fig. 7. Average NMI and standard deviation of 30 runs.
TABLE I. PRECISION STATISTICS OF SYNTHESIZED NETWORK ANALYSIS
network # of detected communities # of communities containing wrong members
# of nodes joining to wrong com-munities
maximum # of wrong members
µ size LPA SOCDA2 LPA SOCDA2 LPA SOCDA2 LPA SOCDA2
1000 852 870 213 450 1201 542 58 3
2000 1829 1862 211 290 1706 367 81 4
3000 2630 2654 237 370 1393 470 50 9
4000 3673 3720 240 415 1993 659 58 5
0.4 5000 4845 4838 343 370 2256 490 71 4
6000 5546 5555 417 717 2123 887 41 4
7000 6357 6390 511 597 3036 765 57 5
8000 7228 7232 315 471 2402 640 44 4
9000 8189 8194 438 653 2923 908 63 5
10000 9116 9098 548 748 3257 1044 62 6
college football games network [21]. The properties of the three networks are listed in Table II.
We ran the SOCDA2algorithm 30 times for each network
as well. The ratio parameter in initialization is 30% while the threshold of community merging in post processing is 5. We found in all runs our algorithm could effectively expose the community structure of the three networks. For example,
0 10 20 30 40 50 60 0
100 200 300
Frequency
Network size, 1000
LPA SOCDA2
0 10 20 30 40 50 60 70 80 90 0
100 200
Frequency
Network size, 2000
0 10 20 30 40 50
0 100 200 300
Frequency
Network size, 3000
0 10 20 30 40 50 60
0 100 200
Frequency
Network size, 4000
0 10 20 30 40 50 60 70 80 0
100 200
Frequency
Network size, 5000
0 5 10 15 20 25 30 35 40 45 0
200 400
Frequency
Network size, 6000
0 10 20 30 40 50 60
0 200 400
Frequency
Network size, 7000
0 5 10 15 20 25 30 35 40 45 0
100 200 300
Frequency
Network size, 8000
0 10 20 30 40 50 60 70 0
200 400
Frequency
Wrong belonging node number Network size, 9000
0 10 20 30 40 50 60 70 0
200 400
Frequency
Wrong belonging node number Network size, 10000
Fig. 8. Distribution of the number of nodes joining to incorrect community,µ= 0.4.
TABLE II. PROPERTIES OF REAL-WORLD NETWORK
network # of nodes # of edges # of communities karate club 34 78 2
dolphins 62 159 2
football games 114 613 19, with 8 contain only 1 team.
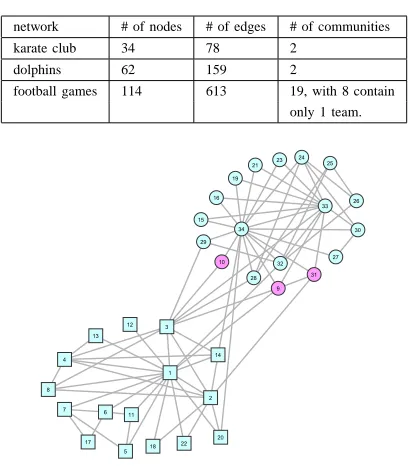
Fig. 9. The real community structure of the karate club network. Node shapes represent community attribution. The pink nodes are mis-assigned by SOCDA2 in two types of community structure.
The results for dolphins network are similar: two communities are detected, and in the first node 40 (label ’SN89’) joins a wrong community, and in the second node 37 (label ’SN100’) and 40 join an incorrect community. Fig.9 and Fig.10 show the real community structure of the karate club network and the dolphins network, respectively. Intuitively, the node 9 and 31 of the karate club network and the node 37 of the dolphins network are hard to be assigned to an incorrect community since all of them have more connections with the correct community. The results stem from the randomness of the order of communities merging during post process when there are several merged communities of the same size.
The detected community structure of the football games network is shown in Fig.11. Each box (including the dash-line box) represents a detected community. Two types of
Fig. 10. The real community structure of the bottlenose dolphins network. Node shapes represent community attribution. The pink nodes are mis-assigned by SOCDA2in two types of community structure.
community structure were discovered in the 30 runs of the algorithm. The difference between them is the members of the ’Mid- American’ conference (community) are split into two finer communities in several runs. Since our algorithm assumes there is no singleton node community, the eight inde-pendent teams (NotreDame, Navy, Connecticut, CentralFlori-da, MiddleTennesseeState, LouisianaTech, LouisianaMonroe, and LouisianaLafayette) will join into incorrect communities, as shown in the figure. Essentially, the detected community structure is very close to the real TSE conference assignments.
In summary, the SOCDA2 algorithm is stable and it can,
as shown here, effectively detect communities on real world networks.
IV. CONCLUSION ANDFUTUREWORK
In this paper, we proposed a self-organizing community
structure detection and analysis algorithm called the SOCDA2
Big West
Mountain West
Atlantic Coast
Conference USA
Pacific Ten
Western Athletic Big Twelve
Big Ten
Southeastern
Big East
Mid-American
independent team NotreDame
Connecticut Navy
Fig. 11. The detected community structure of the football match network. Node shapes and fill colors represent community attribution except the ’independent team’ that is one of the eight independent teams.
all nodes iteratively making these decisions over a number of generations, an optimal community structure is emerging. The algorithm first forms a core community structure depending on the nodes structure similarities. Then each node acts to make related communities become better. When no node acts any-more, the algorithm terminates as it is assumed that an optimal community structure is reached, eliminating the need of further actions of any node in the community structure. A variety of experiments on both synthesized and real-world networks show
that the performance of the SOCDA2algorithm is much better
than that of LPA, and additionally, SOCAD2 algorithm can
effectively discover network community structures.
Overlapping communities are common in real systems. The self-organizing algorithm inherently supports overlapping community detection by simply allowing a node joining mul-tiple communities simultaneously. As future work we aim to extend our algorithm to support overlapping community detection. In addition, the node view computation of the algorithm makes it easily to parallelize the algorithm. We will implement a parallel version of the self-organizing algorithm using Giraph++ [22], which is an open source large-scale graph processing platform that utilize Apache Hadoop’s MapReduce implementation to process big graphs for large-scale network analysis. The execution and experiment of our parallel algo-rithms for large-scale social network analysis demands massive computing and storage resources. We will leverage Amazon Web Services (AWS) which provides massive and elastic cloud based computing and storage resources to run and benchmark the performance of our algorithm.
ACKNOWLEDGMENT
The authors would like to thank Scott Hamilton and Brendan Bouffler from Amazon (UK) for their full support on our application of requesting Amazon Web Services (AWS) to conduct our project. AWS will provide an ideal cloud-based platform on which we can implement, test and benchmark our algorithm for large-scale network analysis.
REFERENCES
[1] F. Radicchi, C. Castellano, F. Cecconi, and V. L. D. Parisi, “Defining and identifying communities in networks,” in Proceedings of the National
Academy of Sciences of the United States of America, vol. 101, no. 9,
2004, pp. 2658–2663.
[2] G. Palla, I. Derenyi, I. Farkas, and T. Vicsek, “Uncovering the overlap-ping community structure of complex networks in nature and society,”
Nature, vol. 435, no. 7043, pp. 814–818, 2005.
[3] S. Fortunato, “Community detection in graphs,” Physics Reports, vol. 486, no. 3, pp. 75–174, 2010.
[4] M. Coscia, F. Giannotti, and D. Pedreschi, “A classification for com-munity discovery methods in complex networks,” Statistical Analysis
and Data Mining, vol. 4, no. 5, pp. 512–546, 2011.
[5] U. N. Raghavan, R. Albert, and S. Kumara, “Near linear time algo-rithm to detect community structures in large-scale networks,” Physical
Review E, vol. 76, no. 3, p. 036106, 2007.
[6] J. R. Xie and B. K. Szymanski, “Labelrank: A stabilized label propa-gation algorithm for community detection in networks,” in IEEE 2nd
International Network Science Workshop, NY, United states, Apr. 2013,
pp. 138–143.
[7] Z. W. Liang, J. P. Li, F. Yang, and A. Petropulu, “Detecting community structure using label propagation with consensus weight in complex network,” Chinese Physics B, vol. 23, no. 9, p. 98902, 2014. [8] S. Gregory, “Finding overlapping communities in networks by label
propagation,” New Journal of Physics, vol. 12, no. 10, p. 103018, 2010. [9] J. Xie and B. K. Szymanski, “Towards linear time overlapping com-munity detection in social networks,” in 16th PAKDD Pacific-Asia
Conference on Knowledge Discovery and Data Mining, Kuala Lumpur,
Malaysia, Sep. 2012, pp. 25–36.
[10] Q. Dai, M. Guo, Y. Liu, X. Liu, and L. Chen, “Mlpa: Detecting overlapping communities by multi-label propagation approach,” in 2013
IEEE Congress on Evolutionary Computation, Cancun, Mexico, Jun.
2013, pp. 681–688.
[11] G. Beni and J. Wang, “Swarm intelligence in cellular robotic systems,” in NATO Advanced Workshop on Robots and Biological Systems, Tuscany, Italy, Jun. 1989, pp. 703–712.
[12] P. Clara, “A multiobjective genetic algorithm to find communities in complex networks,” IEEE Transactions on Evolutionary Computation, vol. 16, no. 3, pp. 418–430, 2012.
[13] H. Chang, Z. Feng, and Z. Ren, “Community detection using ant colony optimization,” in 2013 IEEE Congress on Evolutionary Computation, Cancun, Mexcio, Jun. 2013, pp. 3072–3078.
[14] Y. Park and M. Song, “A genetic algorithm for clustering problems,” in the Third Annual Conference on Genetic Programming, Madison, Wisconsin, USA, Jul. 1998, pp. 568–575.
[15] A. Mislove, B. Viswanath, K. P. Gummadi, and P. Druschel, “You are who you know: inferring user profiles in online social networks,” in
Proceedings of the third ACM international conference on Web search and data mining, New York,USA, Feb. 2010, pp. 251–260.
[16] M. E. J. Newman and M. Girvan, “Finding and evaluating community structure in networks,” Physical review E, vol. 69, p. 026113, Feb 2004. [17] L. Danon, J. Duch, A. Diaz-Guilera, and A. Arenas, “Comparing community structure identification,” Journal of Statistical Mechanics:
Theory and Experiment, vol. 2005, p. 09008, Sep 2005.
[18] A. Lancichinetti, S. Fortunato, and F. Radicchi, “Benchmark graphs for testing community detection algorithms,” Physical Review E, vol. 78, no. 4, p. 046110, 2008.
[19] W. W. Zachary, “An information flow model for conflict and fission in small groups,” Journal of Anthropological Research, vol. 33, no. 4, pp. 452–473, 1977.
[20] D. Lusseau, K. Schneider, O. J. Boisseau, P. Haase, E. Slooten, and S. M. Dawson, “The bottlenose dolphin community of doubtful sound features a large proportion of long-lasting associations,” Behavioral
Ecology and Sociobiology, vol. 54, no. 4, pp. 396–405, 2003.
[21] T. Evans, “Clique graphs and overlapping communities,” Journal of
Statistical Mechanics: Theory and Experiment, vol. 2010, no. 12, p.
12037, 2010.
[22] Y. Tian, A. Balmin, S. A. Corsten, S. Tatikonda, and J. McPherson, “From ’think like a vertex’ to ’think like a graph’,” in 40th International
conference on very large data bases, Hangzhou, China, Sep. 2014, pp.