http://www.sciencepublishinggroup.com/j/ijsqa doi: 10.11648/j.ijsqa.20180403.16
ISSN: 2469-8156 (Print); ISSN: 2469-8164 (Online)
Applying Infrared Technique as a Nondestructive Method
To Assess Wheat Grain Hardness
Ayman Ibrahim
1, Adrienne Csúr Varga
2, Márton Jolánkai
2, Ferenc Safranyik
3 1Department of Agricultural Bio-Engineering Systems, Agricultural Engineering Research Institute (AEnRI), Agricultural Research Center (ARC), Dokki, Giza, Egypt
2Crop Production Institute, Szent Istvan University, Gödöllő, Hungary
3
Department of Mechanics and Technical Drawing, Faculty of Mechanical Engineering, Szent István University, Gödöllő, Hungary
Email address:
To cite this article:
Ayman Ibrahim, Adrienne Csúr Varga, Márton Jolánkai, Ferenc Safranyik. Applying Infrared Technique as a Nondestructive Method To Assess Wheat Grain Hardness. International Journal of Science and Qualitative Analysis. Vol. 4, No. 3, 2018, pp. 100-107.
doi: 10.11648/j.ijsqa.20180403.16
Received: March 15, 2018; Accepted: June 8, 2018; Published: June 28, 2018
Abstract:
Hardness, of wheat grains, is one of the most important quality characteristics used in wheat classification and determination of its marketing value. So, the key objective of this investigation applies a non-destructive method like infrared technique as an alternative method of destructive methods to assess hardness of wheat grains. The hardness characteristic was measured by two destructive methods Single-Kernel Characterization System (SKCS) and Instron Universal Testing Machine (IUTM), as reference values. Infrared technique was used to develop NIR calibration and validation model using the partial least squares (PLS) regression to assess wheat grain hardness. The best calibration and validation model for assess hardness of wheat grains were observed throughout the reference method Instron Universal Testing Machine (IUTM) within the wavelength range 950 to 1650 nm with 6 principal components (PCs) and pretreatment by Savitzky-Golay second derivative (S.G. 2nd). Where, the optimum PLS was recorded at the lowest standard error of prediction (SEP) 3.92 N with the maximum value of coefficient of prediction (R2P ≈ 0.91) and sufficient value of the relative prediction deviation (RPD ≈ 3.35). The accuracy of the prediction model was sufficient to use NIRS technique as a nondestructive method to estimate hardness of wheat grains for different varieties of the wheat.Keywords:
Wheat Quality, Hardness, Near Infrared (NIR), Partial Least Squares (PLS) Regression1. Introduction
Wheat crop has a valorize value among all the cereal crops as a staple food for the peoples of the world and used in numerous of the food products industry. Quality of agricultural crops has become one of the most important market requirements based on consumer demand. Wheat quality was generally classified into two group's physical and chemical characteristics. Primary physical characteristics are vitreousness, kernel weight, PSI, moisture content, color, and hardness while the content of protein, gluten, starch, ash and SDS-sedimentation value represent the essential chemical characteristics as mentioned [1-7]. Generally, Cereal hardness is gaining major importance in cereal quality determination, especially in wheat grain. Hardness
of single gene of puroindoline genes and the other absence this leads to hard texture. In the case of durum wheat, both puro-indolines are absent. Wheat grain hardness has been defined by numerous researchers as the case of being hard, difficult to penetrate or separate into fragments [15]. While, [3] added that the term of hardness is not a clearly defined but could generally be formulated as a resistance to plastic strain and cracking at a force concentrated on the surface of a given body. In another meaning hardness is the resistance of the individual grain to deformation under applied forces as described by [19-20]. Also, [21] defined hardness grain as the ratio of the rupture force to the deformation at the rupture point of the grain. Additionally, Wheat grain hardness dependent on genotypes and influenced by many factors as environment especially nitrogen (N) availability of the soil [22-23] and other factors like moisture, lipids, pentosans and protein content as shown by [20]. Many investigations concluded that protein content of wheat grain related to the proper amount of N fertilizer application as mentioned [24]. Likewise [25] shown that greatest influence of nitrogen fertilizer on wheat grain quality is achieved through its effect on grain protein concentration resulting in an increase of gliadins and glutenins. For this reason, [3] reached to that the high percentage of protein content in wheat grain lead to hard wheat grain have strength gluten. Conversely, in case, protein content ratio was low tends to be the wheat grain is soft, have weak gluten. A lot of investigations employed numerous techniques to estimate wheat grain hardness where was the first experiment to assess a numerical value to the hardness of Australian wheat by [26]. Most of them depend on measuring the size and particles distribution after grinding or milling operation like wheat hardness index (WHI) [27], particle size index (PSI) [28], or pearling resistance index (PRI) [29]. Recently, compressive-strength of grain has been measured as a fundamental characteristic for hardness. Agreed both [3-4, 13] that the broadest methods to determine and measure grain hardness are the particle size index (PSI) and near infrared reflectance (NIR) spectroscopy according to [30-31] Which were approved by the American Association of Cereal Chemists [32] under these following methods 55-30 and 39-70A respectively. While concerning to the last prevalent method single kernel characterization system (SKCS) model 4100 (Perten Instruments, Springfield, IL) [33] which measures the required force to crush individual grains between two surfaces, taking into account the weight, diameter and moisture content of each individual grain. Also, this method was approved by [32]. All these physical methods of hardness estimation depend primarily on the crush cereal and therefore classified as destructive methods. These destructive methods for hardness estimation are tedious, time-consuming and are rarely used in wheat breeding. Near-infrared spectroscopy (NIR) is adequately method for rapidly measuring the constituents of various agricultural products with acceptable accuracy. In addition to, is particularly useful when analyzing a large number of samples. Various NIR techniques have been studied to quantify wheat hardness. These NIR techniques included
near infrared reflectance spectroscopy (NIRs) for ground wheat grain by [30-31, 34-37]. Although this technique does not require chemical substances, it only requires grinding process before analysis and this causes great suffering and leads to a significant source of error. Also, NIR transmittance spectrum ranged 740 to 1140 nm were combined on single wheat kernels in order to establish the feasibility of measuring wheat hardness by spectroscopy [38]. While, Near-infrared (NIR) spectroscopy technique for whole wheat hardness measurement was used by a few researchers in this field. Where, [39] reached to that the hardness of whole wheat grain measured by NIR reflectance is not with the same degree of accuracy as in the case of ground grain. In contrast, [40] confirmed that using visible and near-infrared reflectance spectroscopy (550-1690 nm) was quantitatively predicted hardness values of soft and hard wheat (R2= 0.88). While the value of RPD = 2.5 indicated that the model is useful for screening purposes. Hence, the VIS-NIR reflectance spectroscopy has the potential as a rapid and nondestructive measurement of bulk wheat grain hardness. Therefore, the overall objective of this investigation is to apply and discuss infrared technique as a non destructive method to assess whole wheat grain hardness.
2. Materials and Methods
2.1. Samples
The wheat samples used were kindly provided by Crop Production Institute, Szent István University, Hungary. Where, the Samples were taken from field experiment including three winter wheat (Triticum aestivum L.) varieties, Mv Magdalena (ØM), Mv Suba (ØS), and Mv Toldi (ØTo), it was carried out in 2014, under six different levels of nitrogen fertilization as follows 0 (ØMØ, ØSØ, ØToØ), 80, 80-40, 120, 120-40 and 160 kg N.ha-1. Where, the fertilization treatments 80-40 and 120-40 were implemented by adding 80, 120 to the soil at tillering and 40 kg N.ha-1 at heading stage.
2.2. Physical Characteristics
The physical characteristics of the wheat samples were determined as follow, moisture content was determined at a temperature 105± 5°C according to the procedure of standard method (44-15 A.) [32]. Also, geometric mean diameter (GMD) was calculated through measuring the seeds dimensions length (L), width (W) and thickness (T) using digital vernier caliper with accuracy of 0.01 mm according to [41]. Also, the mass of wheat kernel was determined by using an electronic digital balance having a sensitivity of 0.001 g. For each treatment, 30 wheat grains were randomly selected to measure the GMD and mass. The obtained data of the samples were statistically analyzed to assess the range, average value, standard deviation (SD), and coefficient of variation (CV).
2.3. Reference Hardness Methods
2.3.1. Single-Kernel Characterization System (SKCS)
method 55-31 [32] by using the instrument Perten Single Kernel Characterization System (SKCS, model 4100) developed by [42]. Where, the SKCS isolates individual wheat grain and determines the mass, diameter and moisture content for every single kernel. Then, The SKCS crushes single kernels between a narrowing crescent-shaped gap and toothed rotor in order to obtain the crushing force and electrical conductivity between the rotor and crescent. Data output for 300 samples single wheat grains were processed by the integrated computer software to provide the means and standard deviations of grain hardness index, weight, diameter, and moisture content as described by [7].
2.3.2. Instron Universal Testing Machine (IUTM)
Dual Column Tabletop Testing Systems (Model 5965), static testing systems that perform compression testing was used to determined wheat grain hardness. The instrument measures the compression force on the wheat kernel, where due to the way that the pressure head has taken. Where, the capacity of the instrument (model 5965) 5 kN, with a maximum speed of 3000 mm/min and an even greater return speed of 3200 mm/min. The machine records data during the measurement and draws the load-extension curve between compressive extension (mm) on the X-axis and compression force (N) on the Y-axis. For each treatment, 30 wheat grains were randomly selected to determine the force-deformation.
2.4. Nondestructive Near Infrared (NIR) Technique
Wheat grain hardness determination within near-infrared wavelength range was performed by using NIR instrument, Perten DA7200 NIR analyzer (Perten Instruments, Huddinge, Sweden) equipped with a diode array detector (950-1650 nm wavelength range) with 2 nm resolution. A sufficient quantity of wheat grain was taken to fill the sample cup. The spectrum of each sample was the average of four successive scans. Then, the spectral data were exported for chemometric analysis to the Unscrambler software (version 10.2 CAMO ASA, Oslo, Norway). The all spectra of 180 samples (80% and 20% for calibration and validation set randomly separated) were preprocessed by Savitzky–Golay smoothing (SG). Partial least squares (PLS) regression was used to developed wheat grain hardness calibration model through the data of reference methods and the NIR spectral data. The usual calibration model and prediction statistics were recorded as following coefficient of determination (R2), standard error of cross validation (SECV), standard error of prediction (SEP) and the relative prediction deviation (RPD) ratio of the standard deviation to standard error of prediction is a measurement of the ability of an NIRS model to predict performance efficiency [43-44].
3. Results and Discussion
3.1. Destructive Methods for Estimating Wheat Grain Hardness
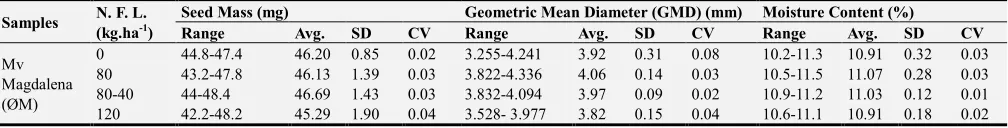
A summary of physical characteristics of each wheat varieties treatment under study was presented in Table 1. Briefly illustrated from the physical characteristics listed in table I that that the maximum average values of wheat grain mass found at variety Mv Magdalena (ØM) (80+40 kg.ha-1) was (46.69±1.43). While the minimum average value of seed mass was 37.56±6.22 at Mv Subha (ØS) with zero N fertilization in addition to that the minimum average value of moisture content 9.49 ± 0.60 was recorded at the same variety and the same Ntreatment. Also, there were a clear differences in geometric mean diameter (GMD) for grain of wheat varieties at the levels of nitrogen fertilization under study, where the lowest mean value of (GMD) (3.82±0.15) was observed at variety Mv Magdalena (ØM 120 kg.ha-1), likewise the highest mean value of (GMD) was (4.06 ± 0.14) at the same variety with different nitrogen fertilization treatment (ØM 80 kg.ha-1). Having considered physical characteristics of different wheat grain, it is also responsible to assess hardness characteristic of wheat grain. Where, the single-kernel characterization system (SKCS) showed that the hardest variety was Mv Suba (ØS) at fertilization treatment 120 kg.ha-1 where mean value of hardness index (HI) was (65.58) as shown in Figure (1). Likewise the highest values of (HI) appeared in the other two varieties Mv Magdalena (ØM) and Mv Toldi (ØTo) at the same fertilization treatment (80+40 kg.ha-1) were 64.10 and 61.49 respectively. While the minimum value of (HI) was 55.8 was noted at Mv Toldi (ØTo) with zero fertilization treatment (ØToØ). These results largely confirmed by the curves of compression force and compressive strength of the instron machine instrument as shown in Figure (2). As a consequence, the maximum mean compression force was 132.99 (N) noted at Mv Suba (ØS) treatment with 120 kg.ha-1 with a slight increase than the fertilization treatment (80+40). As well the maximum values of compression force curves for Mv Magdalena (ØM) and Mv Toldi (ØTo) were 126.95 and 112.13 N respectively at treatment (80+40 kg.ha-1). These differences in grain hardness are due to nitrogen fertilization as well as the genotypes where the proper nitrogen fertilization treatment was 120 kg.ha-1., whether, it will be added in one or two stages where lead to high concentration of protein content which in turn increases the grain hardness as interpreted by [4, 22, 24-25].
Table 1. Shows some physical characteristics of wheat varieties samples.
Samples N. F. L. (kg.ha-1)
Seed Mass (mg) Geometric Mean Diameter (GMD) (mm) Moisture Content (%)
Range Avg. SD CV Range Avg. SD CV Range Avg. SD CV Mv
Magdalena (ØM)
0 44.8-47.4 46.20 0.85 0.02 3.255-4.241 3.92 0.31 0.08 10.2-11.3 10.91 0.32 0.03
80 43.2-47.8 46.13 1.39 0.03 3.822-4.336 4.06 0.14 0.03 10.5-11.5 11.07 0.28 0.03
80-40 44-48.4 46.69 1.43 0.03 3.832-4.094 3.97 0.09 0.02 10.9-11.2 11.03 0.12 0.01
Samples N. F. L. (kg.ha-1)
Seed Mass (mg) Geometric Mean Diameter (GMD) (mm) Moisture Content (%)
Range Avg. SD CV Range Avg. SD CV Range Avg. SD CV
120-40 42.8-46.8 44.93 1.39 0.03 3.688-4.215 3.91 0.16 0.04 10.5-11.2 10.98 0.22 0.02
160 43.2-47.6 45.33 1.22 0.03 3.338-4.184 3.95 0.23 0.06 10.7-11.3 10.97 0.19 0.02
Mv Suba (ØS)
0 21.4-42.8 37.56 6.22 0.17 3.539-4.192 3.95 0.17 0.04 8.2-10.3 9.49 0.60 0.06
80 37.8-41 39.02 1.10 0.03 3.643-4.233 3.87 0.19 0.05 8.5-10.2 9.49 0.63 0.07
80-40 37.4-39.4 38.60 0.77 0.02 3.730-4.271 3.95 0.18 0.04 8.3-10.4 9.54 0.71 0.07
120 37.4-39.4 38.60 0.77 0.02 3.956-4.246 4.03 0.10 0.02 9.2-10.7 9.91 0.50 0.05
120-40 37.4-40 38.40 0.88 0.02 3.588-4.270 3.96 0.21 0.05 9-10.5 9.83 0.54 0.05
160 36-40.6 37.87 1.36 0.04 3.808-4.148 3.98 0.11 0.03 9.2-10.7 9.87 0.49 0.05
Mv Toldi (ØTo)
0 40.2-44.6 42.76 1.31 0.03 3.469-4.277 3.88 0.26 0.07 10.8-11 10.87 0.07 0.01
80 38.8-42.8 41.00 1.32 0.03 3.765-4.171 4.02 0.13 0.03 10.8-11.3 11.03 0.14 0.01
80-40 41-43 42.09 0.58 0.01 3.511-4.131 3.97 0.17 0.04 10.7-11.1 10.97 0.14 0.01
120 37.2-42.2 40.11 1.79 0.04 3.743-4.243 3.98 0.18 0.05 10.8-11.2 10.99 0.12 0.01
120-40 37.2-42.6 40.49 1.84 0.05 3.726-4.189 3.94 0.15 0.04 10.7-11.1 10.93 0.13 0.01
160 38.4-42.4 40.84 1.26 0.03 3.664-4.278 4.02 0.19 0.05 10.8-11.2 11.01 0.12 0.01
N. F. L.: Nitrogen Fertilization Levels, Avg.: Average, SD: Standard Deviation, CV: Coefficient of Variation.
Figure 1. Illustrated the results of the SKCS instrument for the hardness index of wheat varieties under different fertilization doses.
Figure 2. Shows compression force Vs. compressive strength curves of wheat grain varieties under different fertilization doses.
It is noted from the hardness grain results that the treatment of fertilization with the highest concentration (160 kg.ha-1) did not positively affect the hardness of grain. Consequently, this dose of nitrogen fertilization is considered to be excessive which negatively affects the quality of grain hardness. In addition to, that it leads to increase potential adverse environmental effects such as excessive nitrate leaching and increase of greenhouse gases emissions associated with nitrogen fertilization as mentioned by [45-47].
3.2. Nondestructive Near Infrared Technique
characteristics of the wheat samples tested which associated mainly to moisture content, proteins, lipids and carbohydrates as mentioned by [48-51]. It could be seen from the shapes of NIR curves that there are variations between all wheat treatments. This confirms that different levels of nitrogen fertilization have different absorbance light in the range of NIR 950-1650 nm., band and hence led to differences in concentration of chemical components between the samples of wheat varieties which associated with the hardness characteristic this analysis is compatible with both [4, 22, 43, 48]. From this concept, it could be highlighted the spectral peaks in the range of NIR, where were monitored at wavelengths 995 nm., second overtone N– H and O–H stretching, 1205 nm., second overtone C–H stretching and 1470 nm., first overtone N–H and O–H stretching which related to moisture and protein content as mentioned [47, 48, 52].
NIR technique has the potential and ability to develop a calibration model for the quantification of grain hardness. It was used all wheat samples for the construction of the model and its validation. Where the spectrum range (950-1650 nm) used in the experiment was divided into four domains in addition to the total range as follow, 950-1150, 1150-1350, 1350-1650, 1150-1650 and the total range from 950 to 1650 nm. In order to reach the best prediction and validation models to assess the wheat grain hardness characteristic at the best spectral peak located in the best spectral range. The calibration model was applied to all wheat samples under different fertilization levels in two ways the first without any treatment and the second with pretreatment method Savitzky-Golay (SG) second derivative with an optimal number of principal components (PCs =6) was determined by the lowest mean square error of cross-validation. The results of wheat
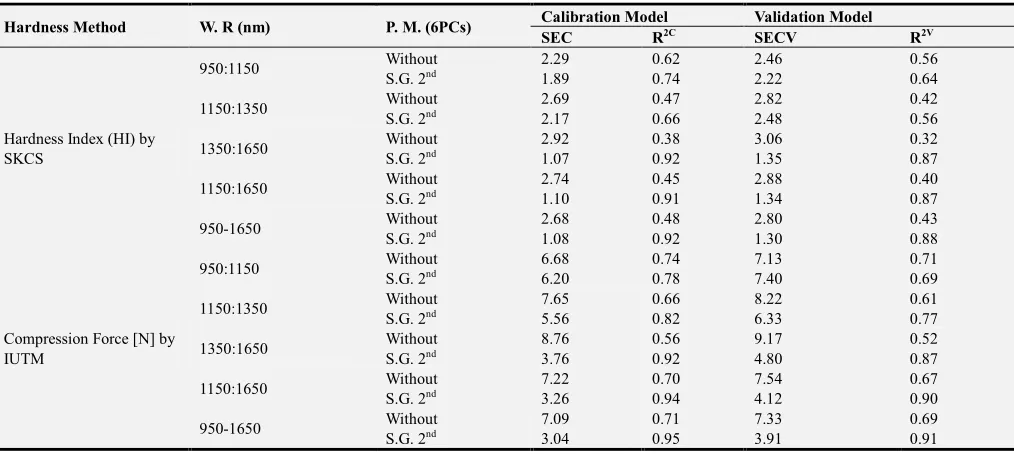
hardness calibration and validation model were presented in Table 2. According to Table 2, there are differences between the values of square error of cross-validation (SECV) and coefficient of determination for validation (R2V) of the calibration and cross-validation model for assess hardness of wheat grains treated by different nitrogen fertilization levels, where it was found that the lowest SECV and the largest R2V to predict the (HI) were 1.30 and 0.88 within wavelength range 950-1650 nm. While the minimum value of SECV and the maximum value of R2V to predict the hardness of wheat grains based on the compression force (N) were 3.91 and 0.91 located within the same wavelength range from 950 to 1650 nm.
Figure 3. Illustrated NIR wavelength curves for all wheat varieties samples.
Table 2. Partial least squares algorithm analysis (PLS) of hardness characteristic for wheat grain by NIR technique.
Hardness Method W. R (nm) P. M. (6PCs) Calibration Model Validation Model
SEC R2C SECV R2V
Hardness Index (HI) by SKCS
950:1150 Without 2.29 0.62 2.46 0.56
S.G. 2nd 1.89 0.74 2.22 0.64
1150:1350 Without 2.69 0.47 2.82 0.42
S.G. 2nd 2.17 0.66 2.48 0.56
1350:1650 Without 2.92 0.38 3.06 0.32
S.G. 2nd 1.07 0.92 1.35 0.87
1150:1650 Without 2.74 0.45 2.88 0.40
S.G. 2nd 1.10 0.91 1.34 0.87
950-1650 Without 2.68 0.48 2.80 0.43
S.G. 2nd 1.08 0.92 1.30 0.88
Compression Force [N] by IUTM
950:1150 Without 6.68 0.74 7.13 0.71
S.G. 2nd 6.20 0.78 7.40 0.69
1150:1350 Without 7.65 0.66 8.22 0.61
S.G. 2nd 5.56 0.82 6.33 0.77
1350:1650 Without 8.76 0.56 9.17 0.52
S.G. 2nd 3.76 0.92 4.80 0.87
1150:1650 Without 7.22 0.70 7.54 0.67
S.G. 2nd 3.26 0.94 4.12 0.90
950-1650 Without 7.09 0.71 7.33 0.69
S.G. 2nd 3.04 0.95 3.91 0.91
The results recorded in Table 2 show that the best prediction of the hardness of the grains under study at the three spectral peaks shown in Figure 3 was the spectral peak of 1470 nm., first overtone N–H and O–H stretching which concerned to chemical bonds related protein bonds and moisture content together where the value of R2V were 0.87 for calibration model of hardness index (HI) and compression force (N). Over these results, the calibration model was
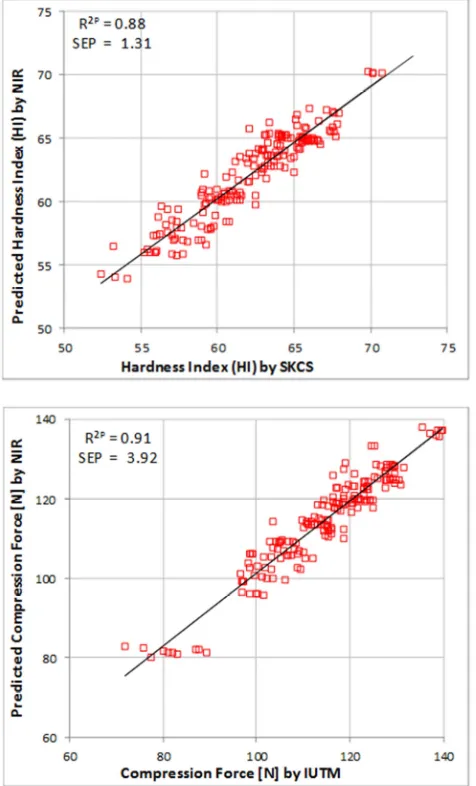
examined through an external validation treatment in order to verify the accuracy of this model to prediction the value of hardness of wheat grains. The data obtained showed good accuracy for (HI) and compression force within spectral region from 950 to 1650 nm., as shown in Table 3 and the graph of predicted hardness values against measured was illustrated in Figure 4.
Table 3. Showed external validation data of wheat grains hardness at the best range of NIR wavelength.
Hardness Method W.R. (nm) P.M. (6PCs) External Validation
Mean SD SEP R2P RPD
SKCS (HI) 950-1650 S.G. 2nd 62.12 3.70 1.31 0.88 2.83
IUTM (CF[N]) 950-1650 S.G. 2nd 114.61 13.14 3.92 0.91 3.35
SKCS (HI): Single-Kernel Characterization System (Hardness Index), IUTM: Instron Universal Testing Machine (Compression Force [N]), W.R.: Wavelength range, P.M.: Pretreatment method, PCs: principal components, S.G. 2nd: Savitzky-Golay second derivative, SD: standard deviation of the data in the validation set, SEP: standard error of prediction, R2P: coefficient of prediction, RPD: ratio of the standard deviation to standard error of prediction.
Figure 4. Illustrated the predicted hardness values against measured of the NIR model for hardness index (HI) by SKCS and compression force [N] by IUTM.
In general, the PLS results showed that there clear differences in calibration and validation statistics for Single-Kernel Characterization System (Hardness Index) and Instron Universal Testing Machine (Compression Force [N]) in order to wheat grains hardness prediction. Where, the higher correlation between the best NIR Wavelength 950-1650 nm., and universal testing machine for determination compression force [N] as indicator to wheat grain hardness was achieved at the lowest value of standard error of prediction (SEP) 3.92 N, and the maximum values of coefficient of prediction (R2P) and the relative prediction deviation (RPD) ratio of the standard deviation to standard error of prediction were 0.91 and 3.35 respectively.
While the obtained results of coefficient of prediction R2P 0.88 for SKCS (HI) were in consistent with near-infrared prediction models of hardness values of soft and hard wheat by [40]. The calibration model for compression force [N] was more efficient than those obtained from Single-Kernel Characterization System (Hardness Index) as indicated by RPD more than 3. This can be believed to be attributed to the accuracy of the device and the large variability attained in the validation samples as shown by high SD. This level of accuracy is sufficient to use NIRS as a tool for screening of wheat grains hardness in a diverse of wheat varieties treated by different levels of nitrogen fertilization in the obtained range according to [44, 53]. These results prove the ability of NIR technique to assess wheat grain hardness accurately without the need for destructive methods to measure.
4. Conclusions
Characterization System (HI) model didn't provide an accurate model for predicting single kernel hardness of wheat varieties compared to the predictive model of grain hardness based on the compression force [N] measurement by using Instron Universal Testing Machine instrument. The three spectral peaks 995, 1205 and 1470 nm., located in the spectral range from 950 to 1650 nm., that contributed to the potency of the calibration and prediction model to assess the hardness of wheat grains were related to the chemical bonds of protein compounds and moisture content, where it is known that both basically determine the value of wheat grain hardness. Further studies should be carried out infrared technique as a non-destructive and cost-effective for developing NIRS calibration and prediction models in order to assess hardness of wheat grains using many other wheat varieties.
References
[1] Koga, S., Böcker, U., Uhlen, A. K., Hoel, B., Moldestad, A., 2016. Investigating environmental factors that cause extreme gluten quality deficiency in winter wheat. Acta Agriculturae Scandinavica Section B: Soil and Plant Science 66(3), 237-246.
[2] Nakamura, K., Taniguchi, Y., Taira, M., Ito, H., 2012. Investigation of soft wheat flour quality factors associated with sponge cake sensory tenderness. Cereal Chemistry 89(2), 79-83.
[3] Salmanowicz, B. P., Adamski, T., Surma, M., Kaczmarek, Z., Karolina, K., Kuczyńska, A., Banaszak, Z., Ługowska, B., Majcher, M., Obuchowski, W., 2012. The relationship between grain hardness, dough mixing parameters and bread-making quality in winter wheat. International Journal of Molecular Sciences 13, 4186-4201.
[4] Pasha, I., Anjum, F. M., Morris, C. F., 2010. Grain Hardness: A Major Determinant of Wheat Quality. Food Science Technology International 16(6), 511- 522.
[5] Faměra, O., Hrušková, M., Novotná, D., 2004. Evaluation of methods for wheat grain hardness determination. Plant soil environment 50(11), 489-493.
[6] Wan, Y. N., 2002. Kernel handling performance of an automatic grain quality inspection system. Transactions of the American Society of Agricultural Engineers 45(2), 369-377.
[7] Gaines, C. S., Finney, P. F., Fleege, L. M., Andrews, L. C., 1996. Predicting a hardness measurement using the single-kernel characterization system. Cereal Chemistry 73(2), 278-283.
[8] Chen, F., Yu, Y., Xia, X., He, Z., 2007. Prevalence of a novel puroindoline b allele in Yunnan endemic wheats (Triticum aestivum ssp. Yunnanense King). Euphytica 156, 39-46.
[9] Martin, J. M., Meyer, F. D., Morris, C. F., Giroux, M. J., 2007. Pilot scale milling characteristics of transgenic isolines of a hard wheat overexpressing puroindolines. Crop Science 47, 497-504.
[10] Cane, K., Spackman, M., Eagles, H., 2004. Puroindoline genes and their effects on grain quality traits in southern Australian wheat cultivars. Australian Journal of Agricultural Research 55, 89-95.
[11] Anjum, F. M., Walker, C. E., 1991. Review on the significance of starch and protein to wheat kernel hardness. Journal of the Science of Food and Agriculture 56, 1-13.
[12] Shewry, P., 2009. Review paper: Wheat. Journal of Experimental Botany 60(6), 1537-1553.
[13] Morris, C. F., Bettge, A. D., Pitts, M. J., King, G. E., Pecka, K., McCluskey, P. J., 2008. Compressive strength of wheat endosperm: comparison of endosperm bricksto the single kernel characterization system. Cereal Chemistry 85(3), 359-365.
[14] Campbell, K. G., Bergman, C. J., Gualberto, D. G., Anderson, J. A., Giroux, M. J., Hareland, G., Fulcher, R. G., Sorrels, M. E., Finney, P. L., 1999. Quantitative trait loci associated with kernel traits in soft and hard wheat cross. Crop Science 39, 1184-1195.
[15] Pomeranz, Y., Williams, P. C., 1990. Wheat hardness: its genetic, structural, and biochemical background, measurement, and significance. In: Dickinson. E and Stainsby. G. (eds). Advances in Cereal Science and Technology. Elsevier Applied Science publishsers Ltd., London. Chapter 8.
[16] Hansen, A., Poll, L., 1997. Raavarekvalitet: Frugt, Groensager, Kartofler og Korn. Copenhagen: DSR Forlag. Cited by [4].
[17] Kent, N. L., Evers, A. D., 1994. Technology of Cereals, 4th edn. Oxford: Pergamon Press.
[18] Morris, C. F., 2002. Puroindolines: The molecular genetic basis of wheat grain hardness. Plant Molecular Biology 48, 633-647.
[19] Dobraszczyk, B. J., Whitworth, M. B., Vincent, J. F. V., Khan, A. A., 2002. Single kernel wheat hardness and fracture properties in relation to density and the modelling of fracture in wheat endosperm. Journal of Cereal Science 35, 245-263.
[20] Turnbull, K. M., Rahman, S., 2002. Endosperm texture in wheat. Journal of Cereal Science 36, 327-337.
[21] Sirisomboon, P., Kitchaiya, P., Pholpho, T., Mahuttanyavanitch, W., 2007. Physical and mechanical properties of Jatropha curcas L. fruits, nuts and kernels. Journal of Food Engineering 97, 201-207.
[22] Blandino, M., Marinaccio, F., Vaccino, P., Reyneri, A., 2015. Nitrogen Fertilization Strategies Suitable to Achieve the Quality Requirements of Wheat for Biscuit Production. Agronomy Journal 107(4), 1584-1594.
[23] Gooding, M. J., Devis, W. P., 1997. Wheat production and utilization. CAB International, Wallingford.
[24] Dupont, F. M., Altenbach, S. B., 2003. Molecular and biochemical impacts of environmental factors on wheat grain development and protein synthesis. Journal of Cereal Science 38, 133-146.
[25] Johansson, E., Prieto-Linde, M. L., Svensson, G., 2004. Influence of nitrogen application rate and timing on grain protein composition and gluten strength in Swedish wheat cultivars. Journal of Plant Nutrition and Soil Science 167, 345-350.
[26] Cobb, N. A., 1896. The hardness of the gram m the principal varieties of wheat. Agricultural Gazette of NSW 7, 279-299.
[28] Stenvert, N. L., 1974. Grinding resistance. A simple measure of wheat hardness. Flour Anim. Feed Milling 7, 24-27.
[29] Chung, C. J., Clark, S. J., Lindholm, M. C., McGinty, R. J., Watson, C. A., 1977. The pearlograph technique for measuring wheat hardness. Transactions of the ASAE 18, 185.
[30] Williams, P. C., Sobering, D. C., 1986. Attempts at standardization of hardness testing of wheat. II. The near infrared method. Cereal Foods World 31, 417-420.
[31] Norris, K. H., Hruschka, W. R., Bean, M. M., Slaughter, D. C., 1989. A definition of wheat hardness using near infrared reflectance spec-troscopy. Cereal Foods World 34, 696-705.
[32] AACC, 2000. Approved methods of the American Association of Cereal Chemists, 10th Ed. Methods 14-15A, 39-70A, 55-30 and 55-31. The Association: St. Paul, MN.
[33] Osborne B. G., Turnbull K. M., Anderssen R. S., Rahman S., Sharp P. J., Appels, R., 2001. The hardness locus of Australian wheat lines. Australian Journal of Agricultural Research 52, 1275-1286.
[34] Miller, B. S., Afework, S., Pomeranz, Y., Bruinsma, B. L., Booth, G. D., 1982. Measuring the hardness of wheat. Cereal Foods World 27, 61-64.
[35] Ohm, J. B., Chung, O. K., Deyoe, C. W., 1998. Single-kernel characteristics of hard winter wheats in relation to milling and baking quality. Cereal Chemistry 75(1), 156-161.
[36] Randall, P. G., Krieg, H. M., McGILL, A. E. J., 1992. Calibration companson between South African and Federal Grain Inspection Service and European calibrations. S. Afr. J. Food Sci. Nutr., 4, 33-35.
[37] Williams, P. C., 1979. Screening wheat for protein and hardness by near infrared reflectance spectroscopy. Cereal Chemistry 56, 169-172.
[38] Delwiche, S. R., 1993. Measurement of single-kernel wheat hardness usmg near infrared transmittance. Trans. ASAE. 36, 1431-1437.
[39] Manley, M., 1995. Wheat hardness by near infrared (NIR) spectroscopy: New insights. Ph. D. Seale-Hayne Faculty of Agriculture, Food and Land Use. University of Plymouth, United Kingdom.
[40] Maghirang, E. B., Dowell, F. E., 2003. Hardness measurement of bulk wheat by single-kernel visible and near-infrared reflectance spectroscopy. Cereal Chemistry 80(3), 316-322.
[41] Mohsenin, N. N., 1986. Physical Properties of Plant and Animal Materials. Gordon and Breach Science Publishers, New York.
[42] Martin, C. R., Rousser, R., Brabec, D. L., 1993. Development of a single-kernel wheat characterization system. Trans ASAE. 36(5), 1399-1404.
[43] Williams, P. C., Norris, K., 2001. Near-infrared technology in the agricultural and food industries. American Association of Cereal Chemists, St Paul, MN, 296p.
[44] Williams, P. C., Sobering, D. C., 1996. How do we do it: a brief summary of the methods we use in developing near infrared calibrations. In: Davies, A. M. C., Williams, P. C. (Eds.), Near Infrared Spectroscopy: The Future Waves. NIR Publications, Chichester, 185–188.
[45] Beman, J. M., Arrigo, K. R., Matson, P. A., 2005. Agricultural runoff fuels large phytoplankton blooms in vulnerable areas of the ocean. Nature (434), 211-214.
[46] Orloff, S., Wright, S., Ottman, M., 2012. Nitrogen Management Impacts On Wheat Yield And Protein. Proceedings, California Alfalfa and Grains Symposium, Sacramento, CA, December, 11-12. http://alfalfa.ucdavis.edu
[47] Ibrahim, A., Csúr-Varga, A., Jolánkai, M., Mansour, H., Hamed, A., 2018. Monitoring some quality attributes of different wheat varieties by infrared technology. Agricultural Engineering International: CIGR Journal 20(1), 1-10.
[48] Miller, C. E., 2001. Chemical principles of near infrared technology. In: Near Infrared Technology in the Agricultural and Food Industries. St. Paul, Minnesota, USA: American Association of Cereal Chemists, Inc.
[49] Siesler, H. W., 2002. Introduction. In: Near Infrared Spectroscopy: Principles, Instruments, Applications. pp. 1-10. Weinheim, Germany: Wiley-VCH Verlag GmbH.
[50] Nicolaï, B. M., Beullens, K., Bobelyn, E., Peirs, A., Saeys, W., Theron, K. I., Lammertyn, J., 2007. Nondestructive measurement of fruit and vegetable quality by means of NIR spectroscopy: a review. Postharvest Biology and Technology 46, 99-118.
[51] Shenk, J. S., Workman, J. J., Westerhaus, M. O., 2007. Application of NIR spectroscopy to agricultural product. In E. W. Ciurczak, and D. A. Burns (Eds.), Handbook of near-infrared analysis (3rd ed.). 347-386.
[52] Stuart, B. H., 2004. Infrared Spectroscopy: Fundamentals and Applications. 1st ed. Hoboken, NJ: Wiley and Sons.