http://www.sciencepublishinggroup.com/j/mlr doi: 10.11648/j.mlr.20190403.11
ISSN: 2637-5672 (Print); ISSN: 2637-5680 (Online)
Using Deep Learning and Machine Learning to Detect
Epileptic Seizure with Electroencephalography (EEG) Data
Haotian Liu
1, Lin Xi
1, Ying Zhao
2, Zhixiang Li
3, *1
Northeast Yucai Foreign Language School, Shenyang, China
2Department of Engineering Science and Applied Math, Northwestern University, Evanston, the United States 3
Department of Biomedical Engineering, Shenyang Pharmaceutical University, Shenyang, China
Email address:
*
Corresponding author
To cite this article:
Haotian Liu, Lin Xi, Ying Zhao, Zhixiang Li. Using Deep Learning and Machine Learning to Detect Epileptic Seizure with Electroencephalography (EEG) Data. Machine Learning Research. Vol. 4, No. 3, 2019, pp. 39-44. doi: 10.11648/j.mlr.20190403.11
Received: October 14, 2019; Accepted: November 15, 2019; Published: November 21, 2019
Abstract:
Epileptic seizure is associated with significant morbidity diseases and mortality. An early identification of seizure activity can help prevent patients from adverse outcomes. Electroencephalography (EEG) raw data is a good source to recognize epileptic seizure from other brain activities. Numerous previous studied have applied feature engineering techniques to extract clinical meaningful features in order to indentify Seizure from EEG raw data. However, these techniques required intensive clinical, radiology and engineering expertise. In this study, we applied 6 machine learning algorithms (including naïve bayes, logistic regression, support vector machine, random forest and K-nearest neighbours and gradient boosting decision trees) and 3 deep learning architecture (including convolutional neural network (CNN), long-short term network (LSTM) and Gated Recurrent Unit (GRU)) to conduct binary and multi-label brain activities classification. Our best results of binary classification yielded that ensemble classifiers can classify seizure from other activities with a high accuracy and AUC over 0.96. In multi-label classification, both GRU and RNN yielded an averaged accuracy over 0.7. A compared study was also presented to analyze the performance of each configuration. In conclusion, machine learning and deep learning demonstrated their potential usage in epileptic seizure identification using EEG raw data. Future work may be experimented in a larger dataset to enable the seizure identification at a timely manner.Keywords:
Epileptic Seizure Detection, Machine Learning, Electroencephalography, Convolutional Neural Network, Recurrent Neural Network1. Introduction
The Electroencephalography (EEG) is a widely used technology for measuring and monitoring human brain activities [1, 2]. It is a noninvasive electrophysiology monitoring method, which records the electrical activity of human brain using the electrode placed along the scalp [3]. Because of the voltage fluctuations caused by ion currents in brain neurons, EEG can measure the activity of cerebral cortex. It is a graphic display of the voltage difference between both sides of brain along time. It represents the ratio measurement of activity. As a result, EEG data shown as a continuous time sequence waveform of extremely tiny
voltage signal always have micro wave amplitude [4]. Although waveform recording is at cerebral cortex, it was influenced by the activity from deep subcortical [5].
introduced new ideas for seizure forecasting and recognizing. Applying machine learning model onto the predication of epileptic seizure could help us obtain a better seizure recognition and understand the signal pattern with in EEG [9]. In this study, we would like to identify epileptic seizure from 5 brain activities using machine learning classifiers and deep learning networks. A comparative study between different algorithms were also conducted and discussed.
2. Related Works
Numerous prior studies have been focused on extract meaningful features from EEG to estimate seizure activities. Feature extraction has been drawn great attraction to generate automatic seizure detection systems. However, most of these studies made great effort on the extraction of engineering feature [10-12]. They had the preference of converting EEG signal in frequency domain with Fast Fourier transformation so that energy, skewness, average and the combination of other domain-based features could be used to describe EEG patterns. However, those works have encountered following challenges. First, they are sensitive to sharp variation of EEG signals. As those statistical features cannot describe the non-stationary nature of EEG data [13]. Secondly, EEG data contains multiple artifact activities such as eye movement and environmental noises. Solely application of engineering features in EEG activities identification are biased by those noises [14].
With the development of machine learning and deep learning recently, more researchers started to apply those techniques into seizure recognitions with EEG data. These studies have made sufficient progress on identify seizure in a timely manner. While, these researches either focused on the usage of a new promising algorithms [15, 16] or applied traditional machine learning classifiers into engineering features or time series data [17]. We noticed that a comprehensive comparative study was ignored. To this end, we applied 5 machine learning classifiers and 3 promising deep learning networks to recognize seizure activity from other 4 brain activities using EEG raw data. A detailed
discussion and comparison among these models were analyzed.
3. Methods
3.1. Dataset
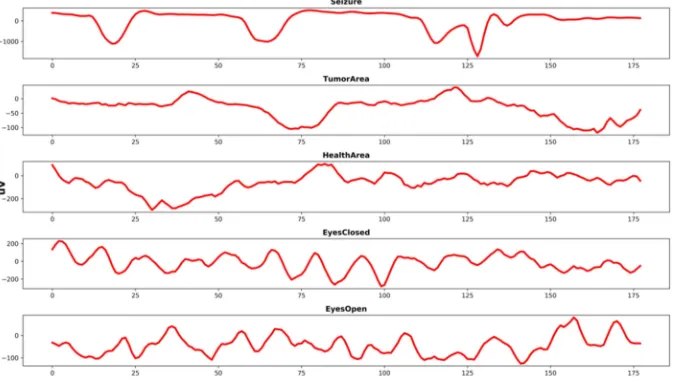
The dataset for this study is generated from the Epileptic Seizure Recognition Data Set under UCI Machine Learning repository [18]. The dataset contains 500 patients' 4097 electroencephalograms (EEG) readings over 23.5 seconds. The 4097 data points are reshaped into 23 chunks with each chunk including 178 voltage signals corresponding to the brain activity within one second. Consequently, this multivariate time series dataset has 11500 subjects with each subject having a brain activity label regarding 178 features. 5 kinds of brain activities are seen in the dataset. We randomly select an instance under each category and visualize it in Fig. The detailed description of each activity can be found below. We also denote each class an abbreviation name:
Seizure: Seizure activity is recorded.
Tumor Area: Subject is diagnosed with tumor, and the EEG is collected from these epileptic brain areas.
Health Area: Subject is diagnosed with tumor however the EEG is collected from non-epileptic brain area.
Eyes Closed: Collected from the healthy subject when the eyes are keeping closed.
Eyes Open: Collected from the healthy subject when the eyes are keeping open.
3.2. Pre-processing
The dataset was pre-processed in the next step in order to downstream to the classifiers. We first investigate the missing data. As the data source is well organized and the EEG is carefully recorded, no missing data is found. As can be seen from Figure 1, the voltage distribution of an EEG reviews inconsistent range among different classes. The lowest point of Seizure is much lower compared with other classes. We standardized the voltage into the interval of [-1, 1].
Our objective is in two-fold. In one fold, we would like to recognize Seizure from other activities. This is a binary classification task. We easily unified the labels other than Seizure into a single label. In the other fold, we aimed at validating whether machine learning and deep learning can be used in EEG recordings multi-labels classification. Hence, we kept the original label for this part. We also found that the dataset is balanced, which means each class is one-fifth of the overall. No further imbalanced-against method is needed in the multi-label task. For the binary classification, some techniques were applied to adjust the weights of majority class.
The entire dataset was stratified split into 8:2, training: testing. We applied different validation methods in machine learning and deep learning, which will be introduced later in the following sections.
3.3. Machine Learning Classifiers
We employed machine learning classification methods to build the predictive model. Following classifiers were experimented: 2 linear classifiers: Supply Vector Machine with linear boundary (denoted as LinearSVM) and Logistic Regression (LR); 2 ensemble classifiers: Random Forest (RF) and Gradient Boost Decision Trees (GBDT); 1 probabilistic classifier: Naive Bayes (NB) and K Nearest Neighbors (KNN). 5-fold cross-validation was preformed to avoid over-fitting and tune parameters:
3.3.1. K Nearest Neighbors
KNN is a very intuitive model. The sample is classified based on the labels of its K nearest neighbors. Another advantage of the model is time efficiency. There is almost no training time due to its principle. Euclidean distance was used to determine the neighbors.
3.3.2. Logistic Regression
Logistic regression is a type of generalized linear model. In logistic regression, the model is always trying to find a hyperplane to distinguish positive instance from negative. We applied L2-regularization to avoid over-fitting. One-versus-All scheme was used in the multi-labels classification. Weights of majority class were adjusted to compensate the imbalance.
3.3.3. LinearSVM
An SVM model is a representation of the examples as points in space, mapped so that the examples of the separate categories are divided by a clear gap that is as wide as possible. L2-regularization, One-versus-All were also applied. As there is non-probabilistic, we converted the distance to decision boundary to form a probabilistic output.
3.3.4. Random Forest
A random forest consists of multiple decision trees, which
bootstrap from subset randomly sampled entire dataset, to reduce the probability of over-fitting. We also limited the feature amounts under the square root of the complete set. Given that random forest classifier has many parameters to tune, we only tune two mainly factors: amount of estimators and max depth of each tree.
3.3.5. Gradient Boosting Decision Tree
Gradient Boosting is another method to ensemble decision trees. GBDT focus on using gradient optimization to reduce the error of previous generated parameters. Compared with random forest, GBDT is expected to have faster speed as it usually builds trees with smaller depth.
3.4. Deep Learning Neural Networks
Recently, deep learning neural network such as convolutional neural network (CNN), recurrent neural network (RNN) and etc. show promising performance on one dimensional classification or prediction, such as speech recognition, stock price prediction [19]. Therefore, we considered that using deep learning architecture to classify EEG recording. In this part, we will introduce 3 neural networks we deployed. As mentioned above, 20% has been set to be the held-out test set. We further stratified split training set into 8:2, to form a validation set. As our objective is to validate that deep learning can be useful in the EEG prediction, instead of pursuing the best model to yield a state-of-the-art result. We didn't make all of our efforts to design the configuration of layers, tune parameters.
3.4.1. Convolutional Neural Network
Figure 2. The CNN model. Architecture contained 11500-long 1-D list as input layers, 1-D convolution layers, fully connected layers, max-pooling layers and 5 probabilistic results as output layers.
3.4.2. Recurrent Neural Network
Recurrent Neural Network (RNN) is widely used in the classification or prediction with sequential data, such as stock price prediction and speech recognition. The strength of RNN is that it can 'memorize' the 'history' of sequential data and make accurate prediction. However, standard RNN network has drawback at vanishing gradient and incapable of memorizing long-distance input. Gated Recurrent Unit (GRU) and Long-Short Term Memory Network (LSTM) were designed to address the aforementioned drawback, respectively. In the experiment, we adopted both GRU and LSTM with same architecture. The only difference was how internal neurons were connected. We applied two layers of LSTM/GRU with 32 neurons followed by 2 fully connected layers to give classification results. A drop-out rate of 0.5 was set to avoid over-fitting. Batch size was also 32.
3.5. Evaluation
In the binary classification, as the labels are imbalanced, besides accuracy, we adopted area under the receiver operating characteristic (AUC) to evaluate the performance. In the
multi-label classification, we employed precision on each class and an overall averaged accuracy to estimate our classifiers.
3.6. Tools
Our pipeline was built on Python version 3.6.3. Machine learning classifiers, cross-validation, data pre-processing, parameters tuning was implemented by Scikit Learn package. We designed the architecture of deep neural networks with PyTorch. All experiments were deployed on Google CoLaboratory, which has dual CPU kernels and a GPU to expedite the computation time.
4. Results
4.1. Results and Analysis
In this section, we will report and compare the performance of 6 machine learning classifiers and 3 deep learning architectures on the held-out test set according to the evaluation methods mentioned in the previous section. As our experiments were 2-fold, Figure 3 shows the results of binary classification, Table 1 demonstrates multi-label performance.
Table 1. The performance of 6 machine learning classifiers and 3 deep learning networks on multi-label EEG classification. Precision on each label and average accuracy were reported. The best performance on seizure label and average accuracy were highlighted with bold-font.
Seizure Tumor Area Health Area Eyes Closed Eyes Open Overall Accuracy
Machine Learning
Naive Bayes 0.991 0.367 0.340 0.856 0.304 0.572
Logistic Regression 0.431 0.252 0.223 0.236 0.229 0.275
LinearSVM 0.347 0.242 0.188 0.257 0.211 0.251
KNN 0.991 0.367 0.340 0.856 0.304 0.572
Random Forest 0.935 0.652 0.571 0.632 0.355 0.629
GBDT 0.966 0.574 0.522 0.773 0.632 0.695
Deep Learning
CNN 0.901 0.574 0.642 0.707 0.663 0.703
GRU 0.962 0.688 0.450 0.779 0.641 0.704
LSTM 0.943 0.603 0.721 0.673 0.682 0.724
We first investigated results of binary classification. All 9 configurations yielded accuracy over 0.8. Except 2 linear methods, LR and linearSVM, all other had a competitive accuracy over 0.90. GBDT yielded the best performance of accuracy: 0.973 and AUC: 0.996, followed by RF’s performance of accuracy: 0.965 and AUC 0.995. The ideal performance of these 2 classifiers inspired us that ensemble models of decision trees are a good fit for the seizure recognition. On the contrary, linear classifiers such as LR and linearSVM may not suitable for this task. As there were 11,500 features for one subject, linear models were easy to over-fit. The competitive results of both accuracy and AUC validated machine learning and deep learning models are useful in the seizure recognition.
We then revealed the performance of multi-label classification. Except, LR, linearSVM and KNN, all other configuration did a good work on distinguishing Seizure from other brain activities. They all yielded a high precision on Seizure of over 0.9. It is reasonable as all these configurations were well-performed in binary classification. Three deep neural networks all yielded an average accuracy over 0.70 while other machine learning classifiers didn’t. GBDT had the best performance among machine learning classifiers with precision on Seizure: 0.966 and average accuracy 0.695. Three deep learning configurations had a higher average accuracy but were moderate at seizure recognition. The results demonstrated that if we were planning to recognize Seizure from all other brain activities, GBDT was the best fit. However, if we aimed at EEG classification, deep neural networks were the better candidate classifiers.
Next, we compared the difference among three deep neural networks. GRU and LSTM outperformed CNN on EEG classification in both seizure precision and average accuracy. It is reasonable as these two recurrent networks are good at handling time series data and could take both long and short memory data into consideration. However, these two recurrent networks were highly time-consuming. CNN spent less than 30 seconds to yield this result. Although we deployed our configuration on Google Colaboratory with GPU on back-end, both recurrent networks need more than 30 minutes training time. We admitted that the results of our deep networks were biased due to the limitation of computational power. We didn't
spend enough efforts in parameter tuning and architecture design. While, current results still demonstrated that deep neural networks were better approaches to EEG classification compared with tradition machine learning algorithms.
4.2. Limitations and Future Work
There are also some limitations in our work that can be improved in the future. First, we aimed at recognizing epileptic seizure in a one-second time range. However, in real study, it has more clinical meaning to identify seizure activity in real-time base. Second, we didn't make abundant efforts in the refinement of neural network. If the deep learning architecture is better designed, a better performance in multi-label classification is expected. Moreover, engineering features are widely involved in the EEG recording interpretation. We are planning to extract more engineering features, such as characteristics in frequency domain. A combination of features in both time and frequency domain can convey more information towards the classifiers. Finally, we plan to enlarge the population of our dataset to yield a more robust, reasonable and reliable result.
5. Conclusion
References
[1] Khushaba, R. N., et al., Consumer neuroscience: Assessing the brain response to marketing stimuli using electroencephalogram (EEG) and eye tracking. Expert Systems with Applications, 2013. 40 (9): p. 3803-3812.
[2] Teplan, M., Fundamentals of EEG measurement. Measurement science review, 2002. 2 (2): p. 1-11.
[3] Paller, K. A., M. Kutas, and H. K. McIsaac, Monitoring conscious recollection via the electrical activity of the brain. Psychological Science, 1995. 6 (2): p. 107-111.
[4] Burch, N. R., Automatic analysis of the electroencephalogram: a review and classification of systems. Electroencephalography and clinical neurophysiology, 1959. 11 (4): p. 827-834.
[5] Allison, T., et al., Potentials evoked in human and monkey cerebral cortex by stimulation of the median nerve: a review of scalp and intracranial recordings. Brain, 1991. 114 (6): p. 2465-2503.
[6] Annegers, J. F., W. A. Hauser, and S. B. Shirts, Heart disease mortality and morbidity in patients with epilepsy. Epilepsia, 1984. 25 (6): p. 699-704.
[7] Qu, H. and J. Gotman, A patient-specific algorithm for the detection of seizure onset in long-term EEG monitoring: possible use as a warning device. IEEE transactions on biomedical engineering, 1997. 44 (2): p. 115-122.
[8] Van de Vel, A., et al., Non-EEG seizure-detection systems and potential SUDEP prevention: state of the art. Seizure, 2013. 22 (5): p. 345-355.
[9] Mirowski, P., et al., Classification of patterns of EEG synchronization for seizure prediction. Clinical neurophysiology, 2009. 120 (11): p. 1927-1940.
[10] Subasi, A. and M. I. Gursoy, EEG signal classification using PCA, ICA, LDA and support vector machines. Expert systems with applications, 2010. 37 (12): p. 8659-8666.
[11] Ocak, H., Automatic detection of epileptic seizures in EEG using discrete wavelet transform and approximate entropy. Expert Systems with Applications, 2009. 36 (2): p. 2027-2036.
[12] Liang, N.-Y., et al., Classification of mental tasks from EEG signals using extreme learning machine. International journal of neural systems, 2006. 16 (01): p. 29-38.
[13] Sharma, M., et al., An automatic detection of focal EEG signals using new class of time–frequency localized orthogonal wavelet filter banks. Knowledge-Based Systems, 2017. 118: p. 217-227.
[14] Vorobyov, S. and A. Cichocki, Blind noise reduction for multisensory signals using ICA and subspace filtering, with application to EEG analysis. Biological Cybernetics, 2002. 86 (4): p. 293-303.
[15] Petrosian, A., et al., Recurrent neural network based prediction of epileptic seizures in intra-and extracranial EEG. Neurocomputing, 2000. 30 (1-4): p. 201-218.
[16] Liu, L., W. Chen, and G. Cao. Prediction of neonatal amplitude-integrated EEG based on LSTM method. in 2016 IEEE International Conference on Bioinformatics and Biomedicine (BIBM). 2016. IEEE.
[17] Petrosian, A. A., et al. Classification of epileptic EEG using neural network and wavelet transform. in Wavelet Applications in Signal and Image Processing IV. 1996. International Society for Optics and Photonics.
[18] Asuncion, A. and D. Newman, UCI machine learning repository. 2007.