This may be the author’s version of a work that was submitted/accepted for publication in the following source:
McKenzie, Kirsten,Gow, Kathryn, &Schweitzer, Robert (2004)
Exploring First-Year Academic Achievement Through Structural Equation Modelling.
Higher Education Research and Development,23(1), pp. 95-112. This file was downloaded from: https://eprints.qut.edu.au/23666/
c
Consult author(s) regarding copyright matters
This work is covered by copyright. Unless the document is being made available under a Creative Commons Licence, you must assume that re-use is limited to personal use and that permission from the copyright owner must be obtained for all other uses. If the docu-ment is available under a Creative Commons License (or other specified license) then refer to the Licence for details of permitted re-use. It is a condition of access that users recog-nise and abide by the legal requirements associated with these rights. If you believe that this work infringes copyright please provide details by email to [email protected]
Notice:Please note that this document may not be the Version of Record (i.e. published version) of the work. Author manuscript versions (as Sub-mitted for peer review or as Accepted for publication after peer review) can be identified by an absence of publisher branding and/or typeset appear-ance. If there is any doubt, please refer to the published source.
Exploring first year academic achievement through structural equation modelling.
*Kirsten McKenzie, Kathryn Gow and Robert Schweitzer
School of Psychology and Counselling,
Queensland University of Technology
*Address for Correspondence: Dr Kirsten McKenzie
School of Public Health, Victoria Park Rd, QUT,
KELVIN GROVE, Australia, 4059
Ph. 07 3864 5873
Fax. 3864 5515
Title: Exploring first year academic achievement through structural equation modelling.
Abstract
The purpose of this research was to develop and test a multicausal model of the individual
characteristics associated with academic success in first-year Australian university students. This
model comprised the constructs of: previous academic performance, achievement motivation,
self-regulatory learning strategies, and personality traits, with end-of-semester grades the dependent
variable of interest. The study involved the distribution of a questionnaire, which assessed
motivation, self-regulatory learning strategies and personality traits, to 1193 students at the start of
their first year at university. Students’ academic records were accessed at the end of their first year
of study to ascertain their first and second semester grades. This study established that previous
high academic performance, use of self-regulatory learning strategies, and being introverted and
agreeable, were indicators of academic success in the first semester of university study.
Achievement motivation and the personality trait of conscientiousness were indirectly related to
first semester grades, through the influence they had on the students’ use of self-regulatory learning
strategies. First semester grades were predictive of second semester grades. This research provides
valuable information for both educators and students about the factors intrinsic to the individual that
The first year at university is arguably the most crucial year affecting the academic achievement of
students, as it is during their first year of university that their attitudes towards the course,
approaches to learning, and self-perceptions are developed. This study addressed academic
performance in first-year university students, and focused on identifying the important individual
characteristics of academically successful students, through the use of structural equation
modelling. This study explored the ‘individual characteristics’ of successful students, as distinct
from examining the environment, or external influences, on achievement. More specifically, the
emphasis of the research was on variables intrinsic to the student, such as their personality
characteristics, their motivational beliefs, and the learning strategies they employed in order to
perform.
Australian universities, like most universities internationally, base a large portion of
entrance-making decisions on the previous academic performance of the applicant (Andrich & Mercer,
1997), as previous academic performance is considered to be one of the best predictors of an
individual’s achievement at university. The majority of individuals (both school leavers and
mature-age students) applying for entry into an Australian university are awarded a tertiary entrance
rank (QUT, 2002). This rank is generally based on the previous academic performance of the
applicant and is calculated from academic qualifications, including high school grades and grades
from other tertiary institutions. This tertiary entrance rank is then used as an estimate of academic
potential at university and is utilised to determine who will be offered a place in the university.
Murphy, Papanicolaou, and McDowell (1999) reported on a study, carried out over a three-year
period, from 1995 to 1998, at the Royal Melbourne Institute of Technology, that examined the
relationship between tertiary entrance rank (TER) and academic performance at university. They
found that three different patterns emerged in the relationship between TER and grades at
significant relationship between TER and grades (r = 0.4). For students with an average to high TER (40 to 80), there was no statistically significant relationship between TER and grades. For
students with a low TER (less than 40), there was a variable relationship between TER and grades.
Murray-Harvey and Keeves (1994) established that entrance ranks have a limited utility for
predicting success at university, because once university grades are available (i.e., after the first
semester or first year of study), these become the most important predictors of future performance
at university.
Murphy, Papanicolaou and McDowell (1999, p.2) suggested that these results provided “strong
encouragement to students, academics, schools and the wider community that students with a range
of achievement in their final year of secondary school (Year 12) can and do succeed in demanding
courses in higher education”. Mouw and Khanna (1993) believed that academic achievement
depends not only on whether one ‘can’ do it, but whether one ‘will’ do it. They suggested that
willingness to perform was just as important, if not more important, when considering students’
academic achievement at university. DeRaad and Schouwenburg (1996, p. 313) concluded,
“achievement through ability alone is the exception rather than the rule. Most tasks demand more
than brilliance”.
Over the last decade, there has been an increasing emphasis on independent learning, and students
have been encouraged to take personal responsibility for their studies. Moses and Ramsden (1992)
highlight one of the values of modern Australian universities as encouraging students to be
independent learners and to develop a desire for life-long learning. With the increasing recognition
of the importance of students taking personal responsibility for their learning, came a growing
interest in the concept of self-regulated learning. Self-regulation is now seen as a vital ingredient to
performance in educational settings (Wolters & Rosenthal, 2000; Zimmerman, 1990a, 1990b,
Zimmerman (1990b, p. 4)) has argued that self-regulated learners are metacognitively,
motivationally, and behaviourally active participants in their own learning”. When examining
regulation, Zimmerman (1990b) distinguished between regulatory processes and
regulatory strategies. Self-regulatory processes refer to motivational characteristics such as
self-efficacy and values, whereas self-regulatory strategies refer to specific behaviours utilised to
effectively achieve the task. Zimmerman (1990a) believed that while ‘most students’ would
exercise self-regulatory processes, it is the utilisation of self-regulatory strategies that differentiates
‘most students’ from self-regulated learners. It is vital that students view the outcome of the task as
favourable/beneficial if they are to apply self-regulatory strategies to achieve the task. Zimmerman
(1994) stated that the two most important determinants of self-regulation are self-motivation and
effective use of learning strategies. Self-motivation consists of factors such as self-efficacy, goals,
values, and attributional processes, while learning strategies include such behaviours as time
management and planning.
Recently, self-regulation theory has been criticised for failing to take into account more stable
aspects of the individual such as personality. Matthews et al. (2000) viewed traits as important
aspects of self-knowledge, and they suggested that these influenced self-regulation. Motivational
beliefs were viewed as stemming from the more stable enduring personality traits of the individual.
Demetriou (2000) supported this view, pinpointing the need for ‘self’ theories to be encapsulated in
a theory of self-regulation. Demetriou suggested that personality traits influenced an individual’s
development of preferences for activities and characteristic approaches to tasks. He conceptualised
the link between personality, motivation and behaviours as existing at three levels: personality is
viewed as a high level concept influencing the intermediate level of motivation, which in turn
Previous research utilising modelling approaches to examine academic achievement have found a
complex interrelationship exists between individual characteristics, learning strategies and
academic achievement. Murray-Harvey (1993) developed a causal path model of academic
achievement using the predictor variables of: approach to learning motives and strategies, learning
style, age, sex, locus of control, metacognitive capability, and students self rated performance. It
was found that metacognitive capability was the most important variable identifying successful
students. Drew and Watkins (1998), using structural equation modelling, examined the relationship
between affective variables, learning approaches and academic achievement. They showed that
academic achievement was influenced both by causal attributions and self-concept. Internal locus of
control was negatively related to a surface approach which was in turn negatively related to
academic achievement, meaning that if one were to have an internal locus of control they would be
less likely to use the surface learning strategies that lead to poorer grades. High self concept of
ability was related to a deeper approach to learning which was in turn related to higher academic
achievement, meaning that students with high self concepts were more likely to use deep strategies
that lead to higher grades. It was explained that deeper learning approaches were related to higher
internal locus of control and higher self-concept of ability as students hold a sense of control over
the learning situation.
This research examines the relationship between previous academic performance, personality traits,
motivational beliefs, learning strategies and academic achievement in first-year university students,
using a structural equation modelling approach. While previous academic performance is the most
important factor in entrance decisions for most universities, it is the contention of the authors that
Method
Participants
The participants in this study were 1193 first-year university students across 8 faculties at the
Queensland University of Technology (QUT) (this sample size represented approximately a 76%
response rate from the approached sample of 1560). Five hundred and seventy five males, 603
females, and 15 people who did not indicate their gender participated in the study. Ages ranged
from 16 to 58 (M =21.44, SD=7.09).
Materials
The initial student questionnaire assessed personality, achievement motivation, self-reported
learning strategies and obtained demographic details about participants. Academic data was
obtained by accessing the student records held by the university (students provided informed
consent for their records to be accessed when they completed the initial questionnaire).
Academic Records
Academic records showed each student’s entrance rank and these were used as an index of previous
academic performance. For school leavers, an Overall Position (OP) score was available. This OP
ranks students in relation to others on a scale from 1 to 25, with 1 being the highest and 25 being
the lowest. For mature-age students, a Queensland Tertiary Admission Centre (QTAC) rank was
available. This rank places students on a scale from 1 to 99 with 99 being the highest and 1 being
the lowest. As it was important to place all students on a comparable scale, a conversion table from
QTAC (QUT, 2002) was used to convert QTAC ranks to their equivalent OP score.
For a measure of academic achievement, grade point averages (GPA’s) were accessed from student
records. GPA’s are a measure of a student’s average performance across all subjects in which they
distinction, a grade of 6 being a distinction, a grade of 5 being a credit, a grade of 4 being a pass, a
grade of 3 being a low pass, a grade of 2 being a fail, and a grade of 1 being a low fail.
It is important to note that while an OP of 1 is the highest entrance rank, a grade of 1 at QUT is the
lowest grade, therefore a negative relationship is expected between these two variables. However,
for ease of interpretation in the structural equation modelling section, negative signs are removed
and entrance rank is referred to as previous performance, with better previous performance
predicted to positively relate to higher achievement at university.
Achievement Motivation
Five scales from the Motivated Strategies for Learning Questionnaire (MSLQ), developed by
Garcia and Pintrich (1995) were used to assess academic self-efficacy (8 items), control of learning
beliefs (4 items), intrinsic goal orientation (or learning goals) (4 items), extrinsic goal orientation
(or performance goals) (4 items), and task value (6 items). The academic self-efficacy scale
measures the extent to which one believes that one has the ability to succeed in a given academic
task. The control of learning beliefs scale measures the degree to which students attribute outcomes
to factors within their own control, rather than to external agents. The intrinsic goal orientation
scale measures a desire for learning and mastery, while the extrinsic goal orientation scale measures
a desire for high grades. Task value beliefs refer to the students’ interest in the subject and their
views about the use and importance of the subject. Participants respond to a series of statements on
a seven point likert scale, ranging from 1 (not at all true of me) to 7 (very true of me).
Self-Regulated Learning Strategies
Five sub-scales from the Learning Strategies scale from the MSLQ were also used. The full
learning strategies scale consists of the three sub-scales: cognitive learning strategies,
elaboration and organisation sub-scale from the cognitive learning scale, the metacognitive
self-regulation scale, and the time management and effort self-regulation sub-scale from the resource
management scale. The meaning of each of the learning strategy scales is as follows. The
elaboration scale refers to paraphrasing and summarising. The organisation scale involves outlining
the major points and using tables to illustrate points. The metacognitive self-regulation scale
measures goal setting, observing one’s understanding of the task, and task-dependent regulation.
The time management scale involves appropriate use of one’s time. Effort regulation refers to
delaying gratification and persisting in tasks, regardless of difficulty. These sub-scales were chosen
because the authors concluded that they best encapsulated Zimmerman’s (1990b) definition of
self-regulation, and that they were all reflective of deep learning approaches.
Personality Traits
The Neuroticism Extraversion Openness Five Factor Inventory (NEO-FFI) which is a short version
of the NEO Personality Inventory-Revised (NEO-PI-R), developed by Costa and McCrae (1992),
was used to assess the big five personality traits of neuroticism, extraversion, openness to
experience, agreeableness, and conscientiousness. The NEO-FFI consists of 60 items with 12 items
per personality-trait scale. Participants rate their level of agreement with a series of statements on a
five point Likert scale (1 = strongly disagree to 5 = strongly agree).
High scores on neuroticism indicate a tendency to experience disruptive emotions and irrational
thoughts, whereas low scores on neuroticism indicate a level of emotional stability. High scores on
openness to experience indicate an active imagination, intellectual curiosity and independence in
judgements, whereas low scores indicate conventional behaviours and narrow outlooks. High
scores on agreeableness indicate a degree of altruism and sympathy for others, while low scores on
agreeableness indicate a level of antagonism and scepticism. High scores on conscientiousness
conscientiousness indicate apathetic behaviour and a level of hedonism. Finally, high scores on
extraversion indicate a tendency for sociability and a general liking of people and groups, while low
scores on extraversion indicate a level of introversion or a more reserved, independent individual.
It is important to note, that while ‘introversion’ is hypothesised to be positively related to
achievement outcomes, the NEO-FFI scale measures ‘extraversion’. As the NEO-FFI
conceptualises introversion and extraversion to be two ends of the one continuum (Costa &
McCrae, 1992), for ease of interpretation in the structural equation modelling section, the
extraversion scale is referred to as introversion, and negative signs are removed.
Procedure
Participants were recruited to participate in the study in one of three ways: (1) in lecture time (n =
841), (2) as part of a credit for research program in a first year psychology subject (n = 185), and
(3) via a mail-out survey (n = 167). For procedure (1) and (2), the questionnaire was distributed to
students and students were given adequate time to complete the questionnaire and return it to the
researcher in class time. For procedure (3), an email was sent to all students enrolled at the
university, and students who indicated their interest in participating were mailed a copy of the
questionnaire to complete and return.
Results
Statistical Approach
A two-step approach to structural equation modelling (SEM) was used in this research, as
recommended by Anderson and Gerbing (1988). The measurement models were specified and
tested prior to the testing of the full structural model. The aim in developing the measurement
models prior to the full structural model was to assess the validity and reliability of the constructs
Measurement Models Constructs
In the development of the measurement models, one-factor congeneric measurement models were
calculated for each of the achievement motivation constructs (academic self-efficacy, locus of
control, learning goals, performance goals, and task value) and for each of the self-regulatory
strategy constructs (elaboration, organisation, self-regulation, time management, and effort
regulation). Lisrel 8.3 (Jöreskog and Sörbom, 1996) was used to perform these analyses and the
following procedure was used in calculating each of these factor congeneric models. The
one-factor model was initially calculated using all items from the relevant sub-scale from the MSLQ,
using maximum likelihood estimation. Standardised lambda coefficients and standardised error
terms were inspected to identify those items considered most important in the one-factor model and
those variables considered least important as a measure of the latent construct (i.e., with small
lambda coefficients and large error variance according to the specifications provided by
Holmes-Smith, 2001). If items were identified as poor measures of the latent construct, they were removed
from subsequent model development for the sake of parsimony. Table 1 shows the results of each
of these one factor model analyses.
Insert Table 1
Factor scores from these one-factor models were used to create a composite variable. After this
stage, the achievement motivation constructs and the self-regulatory strategy constructs were
treated slightly differently. For the achievement motivation constructs, the maximised reliability
were calculated in SPSS using the fitted covariance matrix, error matrix and factor scores. With the
standard deviation and variance of the composite variable, and the maximised reliability value,
lambda x parameter coefficients and error coefficients for the composite variable were calculated.
Holmes-Smith’s (2001) recommendations. However, as the elaboration, organisation,
self-regulation, time management, and effort regulation constructs were to be used as indicators of a
latent construct of self-regulatory strategies, there was no need to set the lambda y coefficients and
error coefficients, because these variables would load on a second order latent construct.
As the NEO-FFI is a standardised psychometric measure, all the personality composite variables
(i.e., neuroticism, extraversion, conscientiousness, openness to experience, and agreeableness) were
constructed using the recommended approach detailed by Costa and McCrae (1992), rather than
constructing one-factor models. However, the lambda x parameter coefficients and error
coefficients were calculated in a similar manner to that described previously for the one-factor
congeneric measurement models. As one-factors models were not calculated for the personality
factors, alpha coefficients were used as a measure of reliability. Measurement of these constructs
was then fixed for all subsequent structural model analyses. (Note: While the NEO-FFI scale
measures Extraversion, Extraversion has a negative relationship with achievement. For the sake of
clarity, all negative signs have been removed from the models that follow, and the current study
refers to the ‘Extraversion’ scale as the ‘Introversion’ scale.)
Finally, the error coefficients were fixed for the three academic achievement measures, previous
performance, GPA Semester One, and GPA Semester Two. The estimation of these constructs with
less than three indicators is problematic, as it may result in negative values/matrices that are not
positive definite, and this will result in the construct not being identified. These are known as
‘Heywood cases’ and the solution that is recommended in dealing with these cases is to fix the error
coefficient for these variables to a small positive value (0.05), to enable the model to be identified
Table 2 reports the observed variable path and error coefficients for those values that were fixed
from calculations of the measurement models. These values remain fixed for all subsequent
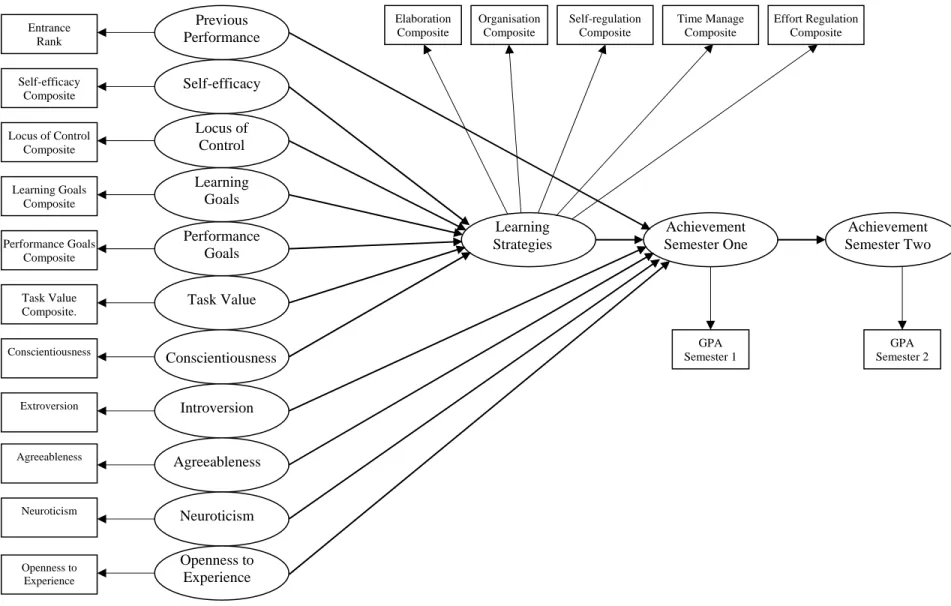
structural model analyses, and therefore will only be reported in this section. Figure 1 illustrates the
initial model of academic achievement. Both directly observed variables and latent constructs are
highlighted in this model. All subsequent models will only illustrate structural paths and
standardised coefficients for these paths. As can be seen in Figure 1, only one indicator for each of
the independent constructs is used in the full model, and these are based on results from the first
step of the analysis - the measurement model analysis. From this analysis, it can be seen that there
are eleven indicators of 11 independent latent constructs, five indicators of a latent construct of
self-reported self regulatory strategies, and two indicators of 2 dependent latent constructs.
Insert Table 2 and Figure 1 Here
Descriptive Results
The means and standard deviations for all variables in the study for the total sample of students who
obtained grades of a pass or above, males/females, and school leavers/mature-age students are
shown in Table 3. Table 4 depicts the correlation matrix for all variables of interest, with
statistically significant correlations being indicated by an asterisk.
Insert Table 3 and 4 Here
Structural Equation Model of Academic Achievement
Prelis 2.3 (Jöreskog and Sörbom, 1996) was used to prepare the data for use in structural equation
modelling (using Lisrel 8.30). On initial screening of the data for the structural equation model, the
following information was found. The number of participants with complete data for all variables
had two missing values. For 104 participants, an entrance rank was not available, and for 48
students a GPA for second semester was not available.
The full structural model as depicted in Figure 1 was tested in the first instance. Maximum
likelihood estimation was used with a Santorra Bentler adjustment (Holmes-Smith 2001), to take
into account non-normal data. Table 5 reports the goodness-of-fit measures and squared multiple
correlations for the endogenous variables.
Insert Table 5 Here
While the chi square value and NNFI were less than satisfactory, all other fit indices showed either
a satisfactory fit (RMSEA, CFI, and GFI) or a good fit (RMR) according to the specification
provided by Holmes-Smith (2001). Modification indices specified no statistically significant
improvements to the model by addition of any parameters. Based on the goodness-of-fit indices
and lack of statistically significant modification indices, this model was accepted as showing
satisfactory fit. Thus, the adjustment made to the next stage of the model was to remove all
non-significant paths from the model estimation.
Three paths were non-significant in this model. The structural path between academic self-efficacy
and self-reported learning strategies was not statistically significant (academic self-efficacy
accounted for only 3% of the variance in learning strategies), indicating that academic self-efficacy
was not a statistically significant predictor of self-reported learning strategies. The structural paths
between the two personality traits of openness to experience and neuroticism to achievement in
Semester One were also not statistically significant (openness to experience and neuroticism
accounted for only 4% and 6% of the variance in learning strategies respectively), indicating that
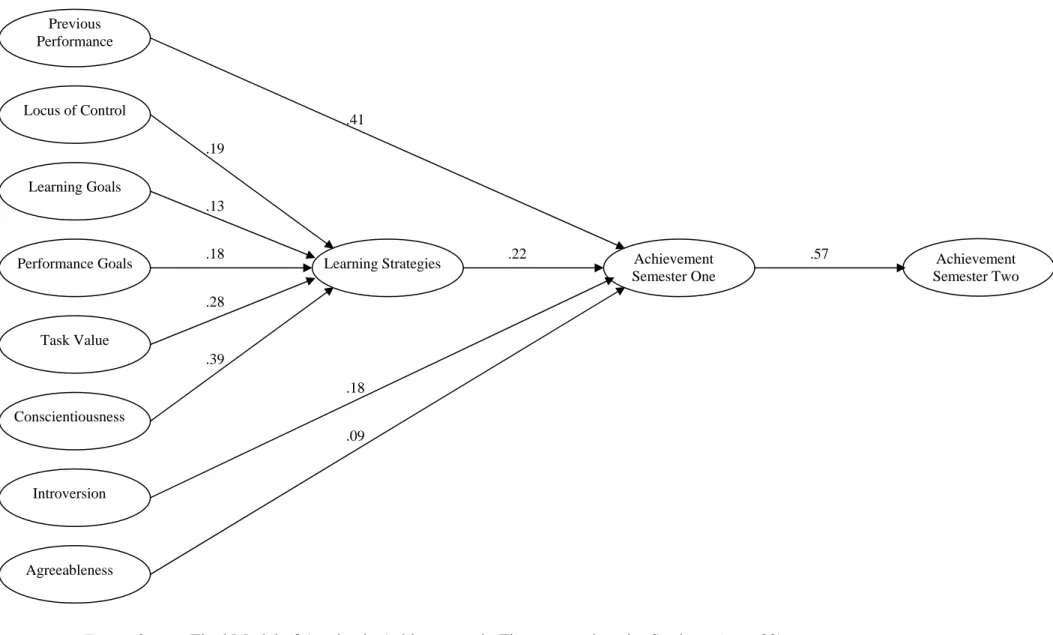
Table 5 reports the statistics and Figure 2 illustrates the results for the final model. The model was
not negatively affected by removing the non-significant paths from the model and, while the model
was not significantly improved by removing these paths, the final model is a more parsimonious
model. This adjusted model was accepted as the final model of achievement for first-year
university students. The final model accounts for a total of 64% of the variance in self-reported
learning strategies, 26% of the variance in Semester One achievement, and 33% of the variance in
Semester Two achievement. Previous performance was the most important predictor of
achievement in Semester One, accounting for 16.8% of the variance in Semester One grades.
Self-reported self-regulatory learning strategies were the second most important predictor of
achievement in Semester One, accounting for 4.8% of the variance. Introversion, followed by
agreeableness, were the next most important predictors of achievement in Semester One,
accounting for 3.2% and 0.81% of the variance, respectively. Self-reported self-regulatory learning
strategies were best predicted by conscientiousness, which accounted for 15.2% of the variance.
Task value accounted for 7.8% of the variance in self-reported learning strategies and locus of control accounted for 3.6% of the variance in self-reported learning strategies. Performance goals
were the next most important predictors, followed by learning goals, which accounted for 3.2% and
1.7% of the variance in self-reported learning strategies respectively. Achievement in Semester
One was found to account for 33% of the variance in second semester achievement.
Insert Table 5 and Figure 2 Here
Discussion
The model of academic achievement proposed in this research was found to be an acceptable
representation of the relationships between constructs in the research. The majority of predicted
paths were found to be statistically significant. The most important construct affecting achievement
variance in Semester One grades overall. Students who had previously attained high grades
(resulting in high university entrance ranks) were more likely to attain high grades at university
than students with poorer previous performance. This construct was more important than the
student’s self-reported use of learning strategies and more important than their personality traits.
Knowledge of a student’s self-reported use of learning strategies enhanced the prediction of that
student’s grades in first semester, accounting for 4.8% of the variance in Semester One grades.
Students who reported a greater use of effective learning strategies were more likely to achieve
higher grades than students who reported a low use of effective learning strategies. This finding
provided support for previous research, which identified the positive effect that self-regulatory
strategies had on academic performance (Garcia & Pintrich, 1996; Pintrich & DeGroot, 1990). It is
not surprising that students who manage their time effectively, who regulate the amount of effort
they expend on tasks, who self-monitor their comprehension, who draw connections between
readings and lecture material, and who effectively organise course material attain higher grades
than students who do not practise such behaviours.
Conscientiousness was the most important predictor of learning strategy use, accounting for 15.2%
of the variance. Students who displayed high levels of conscientiousness were more likely to report
that they utilised learning strategies than students with a more lackadaisical nature. Valuing the
task was the second most important predictor of self-reported self-regulatory learning strategies,
accounting for 7.8% of the variance. It would be expected that students who believed the task they
were performing was an inherently useful and beneficial learning exercise would utilise behaviours
that maximise their chances of understanding the material. An internal locus of control was the
third most important predictor of self-reported learning strategies, accounting for 3.6% of the
variance, with students who had an internal locus of control, rather than believing that their
strategies. Intrinsic learning goals accounted for 1.7% and extrinsic performance goals accounted
for 3.2% of the variance in self-reported learning strategies. However, a negative relationship was
hypothesised between extrinsic performance goals and self-reported learning strategies which was
not supported. In fact, endorsement of goals that focused on one’s performance were more
important predictors of learning strategy use than the endorsement of goals oriented toward
learning. Firstly, it is likely that the performance goals measured in this study reflected
performance-approach goals, and recent research has suggested that performance-approach goals
are conducive to positive outcomes (Eccles & Wigfield, 2002). Secondly, the nature of assessment
in the university environment may also influence the relationship between goals and strategies. If
students have heavy workloads and restricted time to complete tasks, a focus on the practicalities of
learning only what is needed to achieve high grades, rather than learning for the purpose of a deep
understanding of the material, may be more conducive to performance. Students may become
strategic in their approach to learning, and while they may report that they use a variety of learning
strategies, the aim of employing these strategies is focused on the achievement of high grades,
rather than a deep appreciation of the material.
In terms of personality, introverted and agreeable students were more likely to attain higher grades
than students who were more extraverted and antagonistic in their personalities. Introversion
accounted for 3.2% of the variance in Semester One achievement, and was the third most important
predictor of achievement in the model. Introversion has been identified as an important trait in
academia, with introverts presumed to be less socially preoccupied, showing better concentration
and being more organised in previous research (Entwistle, 1983; Goff & Ackerman, 1992). A
student’s level of agreeableness was related to achievement, with more agreeable students attaining
higher first semester grades than students who were more antagonistic in their personality. This
construct accounted for approximately 1% of the variance in first semester grades. It is plausible
environment, accept, and hence complete the requirements of their courses, and are less likely to
antagonise their lecturers, all of which may contribute to their higher achievement at university.
The relationship between academic self-efficacy and self-reported learning strategies was not
statistically significant, suggesting that the level of academic efficacy was not related to
self-reported utilisation of learning strategies. There are several reasons why academic self-efficacy
may not have been predictive of self-reported learning strategies or achievement in the model of
achievement. Firstly, as academic self-efficacy was measured at the beginning of the first year of
university, students may not have yet formed an accurate perception of their own ability to perform
in the university environment. Secondly, the measure of academic self-efficacy may have been too
general to detect any relationship between self-efficacy and self-reported learning strategies or
grades in the model of achievement. Pajares (1996) cautioned that one of the inherent problems
with self-efficacy research lies in the specificity of the self-efficacy construct being measured.
Thridly, level of academic self-efficacy may not be as important a predictor of self-reported
learning strategies and achievement as previous research suggests. Pajares (1996) reported that the
majority of students are overconfident about their abilities, and he believes that this is conducive to
higher performances as this increases the students’ persistence on tasks. Schunk (1994) proposed
that low academic self-efficacy is not necessarily detrimental to the utilisation of self-regulatory
strategies. He suggested that low academic self-efficacy might result in the student exerting more
effort and adopting effective learning strategies to compensate for their perceived lack of ability.
The path between neuroticism and achievement was not important, signifying that a students’ level
of neuroticism or emotional instability does not directly affect the grades attained in the first
semester. It is possible that neuroticism has a differential effect across groups of students. For
them to channel effort into their studies, while for other students neuroticism may have a
detrimental effect on performance.
A student’s openness to experience was not related to achievement, with students who were more
open to their experiences attaining similar grades to students who were narrower in their outlook.
While limited previous research has supported the relationship between openness to experience and
academic achievement (Rothstein, Paunonen, Rush and King, 1994), the findings from the current
research suggest further work is needed in this area.
Summary and Conclusion
The purpose of this research was to develop and test a prospective multi-causal model of academic
achievement in first-year university students. The model of academic achievement was developed
based largely on self-regulation theory, and from empirical findings in relation to previous
academic performance and personality traits. This model was tested using structural equation
modelling, and was accepted with some minor modifications as a satisfactory representation of the
data. This research has demonstrated that, for students to achieve high levels of academic success
during the difficult transition period that is evident in the first year at university, having both the
skill to perform and the will to succeed are important. The first year of university signals a new
learning environment for the majority of students, and while previous demonstrated ability may
have been important in the university selection process, students also need to be motivated to
References
Anderson, J. C., & Gerbing, D. W. (1988). Structural equation modeling in practice: A review and
recommended two-step approach. Psychological Bulletin, 103(3), 411-423.
Andrich, D., & Mercer, A. (1997). International perspectives on selection methods of entry into
higher education. Canberra: Higher Education Council.
Bollen, K. A. (1989). Structural equations with latent variables. New York: Wiley.
Costa, P. T., & McCrae, R. R. (1992). NEO PI-R Professional Manual. Odessa: Psychological
Assessment Resources.
Demetriou, A. (2000). Organisation and development of self-understanding and self-regulation. In
M. Boekaerts & P. R. Pintrich & M. Zeidner (Eds.), Handbook of self regulation. Sydney:
Academic Press.
DeRaad, B., & Schouwenburg, H. C. (1996). Personality in learning and education: A review.
European Journal of Personality, 10, 303-336.
Drew, P. Y., & Watkins, D. (1998). Affective variables, learning approaches and academic
achievement: A causal modelling investigation with Hong Kong tertiary students. British Journal of
Educational Psychology, 68, 173-188.
Eccles, J. S., & Wigfield, A. (2002). Motivational beliefs, values and goals. Annual Review of
Psychology, 53, 109-132.
Garcia, T., & Pintrich, P. R. (1996). Assessing students' motivation and learning strategies in the
classroom context: The Motivated Strategies for Learning Questionnaire. In M. Birenbaum & F. J.
R. C. Dochy (Eds.), Alternatives in Assessment of Achievements, Learning Processes and Prior
Knowledge (pp. 319-339). Boston: Kluwer Academic Publishers.
Goff, M., & Ackerman, P. L. (1992). Personality-intelligence relations: Assessment of typical
intellectual engagement. Journal of Educational Psychology, 84, 537-552.
Holmes-Smith, P. (2001). Applied Structural Equation Modeling. Canberra: School Research,
Evaluation and Measurement Services.
Jöreskog, K. G. and Sörbom D. (1996). LISREL 8: User's Reference Guide, Chicago: Scientific
Software International.
Matthews, G., Schwean, V. L., Campbell, S. E., Saklofske, D. H., & Mohamed, A. A. R. (2000).
Personality, self-regulation, and adaptation: A cognitive-social framework. In M. Boekaerts & P. R.
Pintrich & M. Zeidner (Eds.), Handbook of self regulation (pp. 171-207). Sydney: Academic Press.
Mouw, J. T., & Khanna, R. K. (1993). Prediction of academic success: A review of the literature
and some recommendations. College Student Journal, 27(3), 328-336.
Murray-Harvey, R. (1993). Identifying characteristics of successful tertiary students using path
analysis. Australian Educational Researcher, 20(3), 63-81.
Murray-Harvey, R., & Keeves, J. P. (1994). Students' learning processes and progress in higher
Pajares, F. (1996). Self-efficacy beliefs in academic settings. Review of Educational Research, 66(4), 543-578.
Pintrich, P. R., & DeGroot, E. V. (1990). Motivational and self regulated learning components of
classroom academic performance. Journal of Educational Psychology, 82(1), 33-40.
QUT. (2002). Making inroads: A guide to undergraduate entry 2002. Brisbane: Queensland
University of Technology.
Rothstein, M. G., Paunonen, S. V., Rush, J. C., & King, G. A. (1994). Personality and cognitive
ability predictors of performance in graduate business school. Journal of Educational Psychology,
86(4), 516-530.
Schunk, D. H. (1994). Self-regulation of self-efficacy and attributions in academic settings. In D. H.
Schunk & B. J. Zimmerman (Eds.), Self-regulation of learning and performance: Issues and
educational implications (pp. 75-99). New Jersey: Lawrence Erlbaum Associates.
Wolters, C. A., & Rosenthal, H. (2000). The relation between students' motivational beliefs and
their use of motivational regulation strategies. International Journal of Educational Research, 33,
801-820.
Zimmerman, B. J. (1990a). Self-regulated academic learning and achievement: The emergence of a
social cognitive perspective. Educational Psychology Review, 2(2), 173-201.
Zimmerman, B. J. (1990b). Self-regulated learning and academic achievement: An overview.
Zimmerman, B. J. (2000). Attaining self-regulation: A social cognitive perspective. In M. Boekaerts
& P. R. Pintrich & M. Zeidner (Eds.), Handbook of self regulation (pp. 13-39). Sydney: Academic
Table 1
Results of One-Factor Congeneric Measurement Model Analyses (N = 1193) Statistic Chi
Square
RMSEA1 NNFI2 CFI3 RMR4 GFI5
Self-efficacy 127.51
(p= .00)
0.13 0.95 0.97 0.03 0.95
Locus of control 45.44
(p= .00)
0.16 0.84 0.95 0.05 0.97
Learning goals 10.47
(p= .00)
0.07 0.95 0.98 0.03 0.99
Performance goals 14.84
(p= .00)
0.09 0.93 0.98 0.03 0.99
Task value 70.24
(p= .00)
0.20 0.88 0.96 0.03 0.96
Elaboration 79.21
(p= .00)
0.09 0.93 0.96 0.04 0.97
Organisation 9.75
(p= .00)
0.07 0.97 0.99 0.02 0.99
Self-regulation 187.12
(p= .00)
0.08 0.90 0.93 0.04 0.95
Time management 101.57
(p= .00)
0.11 0.90 0.94 0.04 0.96
Effort regulation 1.92
(p= .16)
0.03 0.99 1.00 0.00 1.00
Table 2
Value of Fixed Path and Error Coefficients for Use in Structural Model
Statistic Path Coefficient Error Coefficient
Previous performance Free 0.05
Self-efficacy 1.04 0.07
Locus of control 0.76 0.16
Learning goals 0.85 0.25
Performance goals 0.98 0.36
Task value 0.98 0.12
Conscientiousness 0.93 0.15
Introversion 0.88 0.11
Agreeableness 0.85 0.27
Openness to experience 0.85 0.27
Neuroticism 0.92 0.13
GPA Semester One Free 0.05
Table 3
Descriptive Results Across the Total Sample, Gender and Age
Mean
Variables in Study Males
n = 575
Females
n = 603
School
Leavers
n = 587
Mature-age
Students
n = 600
Total Sample
N = 1193
Entrance Ranka 5.74 (2.61) 6.36 (2.96) 6.19 (2.98) 5.87 (2.53) 6.07 (2.82) 1st Semester GPA 5.18 (0.79) 5.13 (0.71) 5.10 (0.73) 5.20 (0.76) 5.15 (0.75) 2ndSemester GPA 4.70 (1.42) 4.77 (1.36) 4.70 (1.38) 4.79 (1.40) 4.74 (1.39) Motivation
Self-efficacy 5.08 (0.97) 4.73 (1.08) 4.81 (1.01) 5.00 (1.08) 4.90 (1.05) Locus of Control 5.47 (0.88) 5.52 (0.75) 5.45 (0.84) 5.57 (0.91) 5.50 (0.87) Task Value 5.13 (1.09) 5.43 (1.07) 5.19 (1.13) 5.43 (1.02) 5.30 (1.09) Learning Goals 4.77 (0.99) 4.68 (1.11) 4.60 (1.03) 4.87 (1.07) 4.72 (1.06) Performance Goals 4.67 (1.18) 4.67 (1.18) 4.74 (1.17) 4.60 (1.19) 4.68 (1.18) Learning Strategies
Elaboration 4.71 (0.85) 4.93 (0.93) 4.74 (0.86) 4.95 (0.87) 4.83 (0.90) Organisation 4.70 (1.02) 5.09 (1.04) 4.82 (1.04) 5.04 (1.05) 4.92 (1.05) Metacognitive SRb 4.32 (0.84) 4.41 (0.93) 4.33 (0.87) 4.43 (0.92) 4.37 (0.89) Time Management 4.89 (0.93) 5.20 (1.01) 5.01 (0.96) 5.14 (1.02) 5.07 (0.99) Effort Regulation 4.84 (1.04) 5.12 (1.01) 4.93 (1.06) 5.10 (0.99) 5.00 (1.04) Personality
Neuroticism 20.26 (7.96) 23.62 (7.98) 22.31 (7.91) 21.86 (8.41) 22.11 (8.14) Extraversion 28.69 (6.29) 30.50 (5.78) 30.03 (5.95) 29.20 (6.20) 29.66 (6.08) Openness 27.79 (6.57) 29.97 (5.75) 27.99 (6.15) 30.23 (6.11) 28.98 (6.23) Agreeableness 29.96 (5.52) 32.10 (5.45) 31.19 (5.55) 31.13 (5.67) 31.17 (5.60) Conscientiousness 30.29 (6.74) 31.75 (6.68) 30.53 (6.65) 31.84 (6.73) 31.11 (6.71)
a
Higher entrance ranks academically are signified by lower numeric values b
Table 4
Correlation Matrix of All Variables in Study (N = 1193)
Entra n ce Ra n k GP A Se m 1 GP A Se m 2 Self-e fficac y Loc u s of C o nt ro l
Task Value Learni
ng Goal s Performa nce Goals Elab or ation Or ga ni sat io n Self-Re gulatio n
Time Ma
nage men t Effo rt Regu latio n N euro ticism Extra v ersi on Ope n ness Agreea bleness C onsci en ti o u sness
Entrance Rank 1.00
GPA Sem 1 -.42* 1.00
GPA Sem 2 -.23* .52* 1.00
Self-efficacy -.19* .19* .02 1.00
Locus of Control -.07* .13* .04 .59* 1.00
Task Value -.02 .14* .05 .47* .45* 1.00
Learning Goals -.14* .10* .00 .55* .40* .48* 1.00
Performance .12* -.04 -.02 .24* .25* .19* .08* 1.00
Elaboration -.09 .17* .11* .47* .46* .49* .45* .19* 1.00
Organisation -.03 .13* .09* .38* .35* .43* .29* .29* .69* 1.00
Self Regulationa -.05 .12* .07* .41* .34* .40* .40* .30* .70* .65* 1.00
Time -.04 .19* .15* .42* .39* .43* .31* .24* .63* .66* .60* 1.00
Effort Regulation -.02 .15* .13* .38* .33* .38* .26* .28* .53* .51* .53* .64* 1.00
Neuroticism .06 -.00 -.03 -.35* -.18* -.08* -.26* .03 -.16* -.11* -.16* -.15* -.20* 1.00
Extraversion .02 -.10* .01 .16* .16* .10* .18* .09* .19* .16* .16* .12* .16* -.35* 1.00
Openness -.07 .10* .06 .22* .19* .27* .36* -.12* .28* .12* .14* .10* .09* -.03 .12* 1.00
Agreeableness -.06 .07* .08* .02 .07 .09* .04 -.08* .14* .14* .11* .17* .19* -.20* .29* .13* 1.00
Conscientiousnes -.11* .14* .18* .27* .16* .23* .18* .12* .34* .41* .38* .52* .53* -.27* .25* -.01 .24* 1.00
Table 5
Goodness-of-Fit and Squared Multiple Correlations for Initial and Final Model (n = 682)
Initial Model Final Model
Goodness-of-fit Measures Value Value
Chi Square Value
Chi Square p
431.33
<0.05
433.66
<0.05
RMSEA 0.080 0.079
CFI 0.92 0.92
NNFI 0.84 0.85
RMR 0.038 0.038
GFI 0.93 0.92
Squared Multiple Correlations
Learning Strategies 0.65 0.64
GPA Semester One 0.26 0.26
GPA Semester Two 0.33 0.33
Figure 1: Proposed Model of Academic Achievement in First-year university Students. Self-efficacy Performance Goals Task Value Conscientiousness Introversion Agreeableness Previous Performance Locus of Control Learning Goals Learning Strategies Achievement Semester One Achievement Semester Two Neuroticism Openness to Experience Elaboration Composite Organisation Composite GPA Semester 1 GPA Semester 2 Locus of Control
Previous Performance
Locus of Control
Learning Goals
Performance Goals
Task Value
Conscientiousness
Introversion
Agreeableness
Learning Strategies Achievement
Semester One
Achievement Semester Two .41
.19
.13
.18
.28
.39
.18
.09
.22 .57