19TH
ANNUAL PACIFIC-RIM REAL ESTATE SOCIETY CONFERENCE MELBOURNE AUSTRALIA, 13-16 JANUARY 2013
INDUSTRY PERCEPTIONS OF PROPERTY HOLDING COSTS AND THE
ASSOCIATED EFFECTIVENESS OF ELECTRONIC DEVELOPMENT
APPLICATION INSTRUMENTS
ABSTRACT
The impact of holding costs on greenfield residential housing developments is becoming increasingly recognised as a major factor affecting housing affordability. This has led a number of jurisdictions throughout Australia to examine methods of streamlining procedures and processes (“red tape”) in ways that curtail otherwise protracted regulatory appraisal procedures along the property development pipeline. Using a structured anonymous questionnaire, one major initiative in Queensland seeking to redress “red tape” - the development of electronic development application processes – is tested by gauging industry participant’s perceptions of their effectiveness. This information is also used to examine linkages that exist between various planning instruments, the length of regulatory assessment periods, and perceptions concerning housing affordability more generally. In addition, these results are able to be triangulated against quantitative data modelling focussed on the consequences of extended assessment periods as a typically critical component of holding costs.
19th Annual PRRES Conference, Melbourne, Australia, 13-16 January 2013 2
INTRODUCTION
Background
It is well established in the literature that an important factor impacting housing affordability, having particular application in the case of new housing “greenfield” development, is that relating to holding costs. Although perhaps in some ways less transparent than other factors, for some time now holding costs have been widely held to impact housing affordability (for example, 2007; Bourassa, 1992; Brown et al., 1986; Eagles, 2008; Gurran et al., 2009; Marshall, 2010; Set, 2007; Tse, 1998; ULDA, 2010; Yardney, 2007). There are potentially a multitude of significant costs associated with “holding” that inevitably act to drive up prices, and therefore impact housing affordability.
These costs cannot always be easily identified: In its simplest form, holding costs commence with a calculation of the interest or opportunity cost of land holding. However, there is significantly more complexity for major new developments. This particularly applies in the case of greenfield property developments which typically involve intricate multi-stage, multi-phase staging over relatively long periods of time. A strong relationship with opportunity cost provides further complexity because of its interdependent relationship with prevailing inflation and / or interest rates. Furthermore, large scale developments are often run in tandem with geographically diverse or otherwise unrelated projects in order to accommodate corporate operations and manoeuvring - particularly that related to financial arrangements. All these factors do not assist the computation of holding costs.
Nonetheless, strong evidence exists that demonstrate even small shifts in primary factors impacting holding costs can appreciably affect housing affordability (Garner, 2012). It may not therefore be too surprising that whilst the ultimate impact has not hitherto been rigorously quantified, there has been an unprecedented level of attention given by policy makers over recent years. This may be evidenced by the establishment of significant new entities specifically designed to address holding cost related problems. Examples include the Australian Government’s Housing Affordability Fund, and at a more local level, the embedding of specific strategies to address burgeoning holding costs in Queensland (and particularly those cost savings associated with streamlining regulatory assessment) within bodies like the Urban Land Development Authority, statutory instruments such as the Queensland Housing Affordability Strategy, and elements within the South East Queensland Regional Plan.
Changes in the regulatory framework for new property development projects in Queensland
One of the most recent attempts at reform to the regulatory environment existing in Australia may be seen in the Productivity Commission’s Inquiry into Performance Benchmarking of Australian Business Regulation: Planning, Zoning Productivity Commission and Development Assessments (Productivity Commission, 2010). The Issues paper outlines its intention to continue the program of performance benchmarking of Australian business regulation relating to the states and territories’ planning and zoning systems and land development assessments (DAs). This benchmarking study includes the housing supply and affordability reform agenda, and reforms of development assessment processes to reduce the costs of development. Holding costs form an integral part of the inquiry since it recognises key factors including the ease with which development approvals can be sought, and the length of time taken for assessments. These are identified by the Commission as being some of the key factors influencing “the competitiveness implications and cost of DA processes” (Productivity Commission, 2010, p. 14). Possible sources of unnecessary regulatory burdens include excessive time delays in obtaining responses and decisions from regulators; this could include administration and operational costs beyond those needed to meet planning, zoning and DA requirements (e.g. when the planning, zoning and DAs are not orderly, timely, consistent, effective or efficient). The primary issue identified here is whether DAs conducted in a timely manner, i.e. what aspects of the DA process (for example, pre-application assistance, tracking systems, appeals and external agency referrals) could be improved without compromising the integrity of the decision-making process? Furthermore, what form could such improvements take (for example, greater use of exempt or self-assessment approval tracks) (Productivity Commission, 2010, p. 22)?
In their submission to the productivity Commission, the Planning Institute of Australia had some strong words to say concerning the effectiveness of the planning regime as it exists, with a focus on the position in NSW. They contend that “good planning” is not necessarily hindering economic development – but at the same time legislation needs to be repealed and be replaced to reflect “good planning” (PIA, 2010, p. 3). Furthermore:
19th Annual PRRES Conference, Melbourne, Australia, 13-16 January 2013 3 Moreover, the PIA contend that zoning for the purpose of regulating and prescribing order to development and societal outcomes has a long history in traditional planning legislation, and has developed into a very rigid and time-consuming exercise as an effective mechanism for development concept appraisal and preliminary viability analysis.
It may be observed there are a number of initiatives already in train that are addressing some of these problems – especially concerning timeliness - such as the Federal Government’s eDA (Electronic Development Assessment) Tools program under the auspices of the Housing Affordability Fund (HAF). Related to this is the Next Generation Planning Project, and the HAF Target 5 Days (T5) Project, the latter which has been described as a continuous process reform claimed to eventually reduce assessment timeframes for 95% of residential development assessment applications, and establish a 75% reduction in approval timeframes for residential developments (COMSEQ, 2010, p. 5).
METHODS (RESEARCH DESIGN)
Overview
This research essentially revolves around the conduction of an anonymous survey involving various industry participants (primarily town planners and property developers). Its primary objective is to examine the effectiveness of Electronic Development Assessment (eDA) tools and issues related to holding costs more generally. Examining the effectiveness of eDA tools in streamlining the assessment, planning and development processes within councils assists in evaluating their contribution towards improved housing affordability. Thus, the survey obtains feedback, both quantitative and qualitative, on development assessment tools and processes within Queensland, as well as the role of holding costs in housing affordability. A particular focus of the survey is to ascertain the extent to which holding costs are understood by industry participants to affect housing prices. Thus, this information enables the triangulation input of data from a range of sources and perspectives into quantitative modelling – although the latter is outside the scope of this paper. Various aspects of holding costs and the development processes related to housing affordability are also tested.
The industry survey was facilitated through the Housing Affordability Fund who engaged the support of key relevant industry organisations such as the UDIA, PCA and HIA in order to assist dissemination to property development and related organisations, i.e. town planners, property developers and a limited number of other related organisations. The survey was designed to elicit two primary pieces of information that can be used to inform this study, namely:
1. Quantitative and qualitative information that facilitates the evaluation of the effectiveness of Electronic Development Assessment (eDA) tools in Queensland to reduce time-frames in the development assessment process, and as a consequence determining the role this plays in reducing holding costs and therefore improving housing affordability; and
2. Quantitative and qualitative information that facilitates the dimensions of holding costs as it applies to various industry participants, and additionally, the extent to which holding costs are understood by industry participants to affect housing prices.
Obtaining feedback on development assessment tools and processes within Queensland, as well as taking into account industry’s understanding of the scope of holding costs more generally, enables different perspectives to be taken into account.
Research Limitations
This research has an intentionally narrow focus, involving mid-sized greenfield residential property developments projects in South East Queensland. This approach provides a foundation for conducting the investigation by defining parameters for which the research has application. Property development projects are by their nature extremely variable, and restricting the nature, size, purpose and scope maximises the potential for homogeneity - subsequently providing higher confidence levels in outcomes.
Participants in the Industry Survey
19th Annual PRRES Conference, Melbourne, Australia, 13-16 January 2013 4
Survey Instrument
This research project involves implementing a survey instrument containing a questionnaire, known as the “Development Assessment (DA) and Holding Cost Survey”. This involved utilisation of “Key Survey” – a web-based survey creation and management system that enabled the development and distribution of a sophisticated online survey.
The survey required the completion of an online survey by participants that sought mainly qualitative data in relation to respondents experience with development assessment instruments; in particular new electronic instruments (primarily designed to reduce holding costs by saving time) being introduced into Councils throughout many parts of Queensland by the Housing Affordability Fund (HAF). This survey, although anonymous, by design disallows duplicates, and captures the locale, organisational type and professional occupation of the respondent, thereby enabling a focussed and selective interpretation of results.
The qualitative data relates firstly to participants experience in using electronic development assessment (eDA) tools including usefulness, awareness of their availability, benefits, etc. and secondly issues associated with development assessment processes within Queensland, and the role of holding costs in housing affordability. In particular, this survey is designed to establish the extent to which holding costs are understood by industry participants to affect housing prices. A small quantum of quantitative data was also collected to assist in estimating the economic benefits of eDA tools (and therefore likely impact on holding costs), and quantification of holding costs more generally including that proportion incurred during the development assessment and other regulatory processes. This information was aggregated and thus captured ready for “coding” via the importing and transcribing facilities built into NVivo.
RESULTS & ANALYSIS
Survey composition / profile
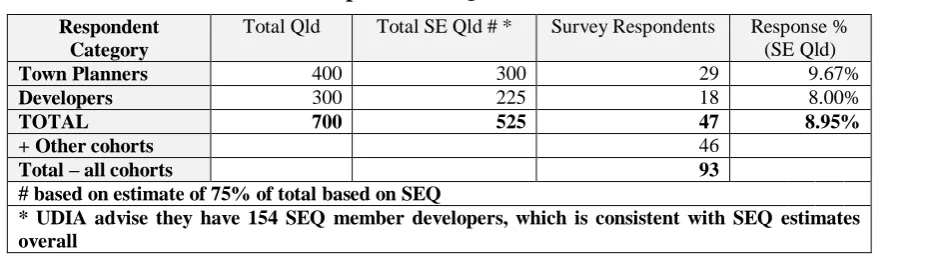
Respondents to the survey represent a cross section from industry and professional organisations related to property development in Queensland, derived from the estimated 525 organisations involved in town planning and property development disciplines in south-east Queensland (refer Table 1). It was conducted on line and anonymously, meaning that the survey proponents were unable to personally identify respondents by the information provided in responses. The population sample involved collected data from a total of 93 anonymous respondents, representing 34% of state-wide eDA contemplators / users (Table 2), and 45% of eDA contemplators / users town planner and developer organisations operating in South East Queensland (Table 3). Over half of the respondents are either town planners or developers. The balance of respondents comprises a mixture of engineers, architects, surveyors, builders and building designers.
The survey therefore provides a logical cross section of those involved in the property development industry in South East Queensland, with an appropriate bias towards developers and town planners and those using - or contemplating using - eDA tools. Throughout this analysis, responses from Property Developers and Town Planners are compared against each other, and also against the balance of the sample. This is done to expose differences between the cohorts in terms of both attitudes and certain quantitative elements.
Considering only those directly involved in the property development industry, the base population sample size (i.e. Town Planner & Developer cohorts only, operating in SE Queensland) is estimated to be in the order of 105 organisations, i.e. only those organisation whom are eDA users, or contemplators and eDA users, or just eDA contemplators, The resultant indicative response rate is 44.8%as shown on Table 3.
Table 1 Town Planners & Developers in SE Queensland
Respondent Category
Total Qld Total SE Qld # * Survey Respondents Response % (SE Qld)
Town Planners 400 300 29 9.67%
Developers 300 225 18 8.00%
TOTAL 700 525 47 8.95%
+ Other cohorts 46
Total – all cohorts 93
# based on estimate of 75%of total based on SEQ
19th Annual PRRES Conference, Melbourne, Australia, 13-16 January 2013 5
Table 2 Response rates based on eDA tool user adjustments & organisational "doubling up"
ALL RESPONDENTS Respondent Group
Number (Organisations) eDA
tools users estimate only *
Respondents Response %
UDIA 121 32 26.5%
PIA 23 21 91.0%
PCA 40 12 29.9%
HIA 36 7 19.3%
Top 36 users eDA 36 14 38.9%
Other 15 7 46.7%
Total 271 93 34.3%
* estimate based on 20% organisations eDA users, and less allowance of 7.92% for organisation "doubling up" (i.e. respondents belonging to more than one association / industry group)
Table 3 Town Planners & Developers in SE Queensland using eDA Tools
Respondent Category
Total SE Qld# Number (Organisations) eDA tools users estimate only *
Survey Respondents
Response % (eDA users)
Town Planners 300 60 29 48.33%
Developers 225 45 18 40.00%
TOTAL 525 105 47 44.76%
* estimate based on 20% organisations eDA users: derived from eDA awareness statistics
Industry survey: objectives and approach
The industry survey was undertaken during the period August and September 2010, focussing on development assessment and holding costs as noted previously. Whilst its primary objective was to examine the effectiveness of Electronic Development Assessment (eDA) tools, the opportunity was also taken to query participants on the topic of holding costs more generally. These two aspects both relate to housing affordability: the former, potentially assisting councils in the evaluation of their participative contribution towards improved housing affordability, and the latter providing an examination of industry participants understanding of the role of holding costs in the housing affordability matrix.
Linkages that exist between various planning instruments, the length of regulatory assessment
periods, and housing affordability
eDA awareness
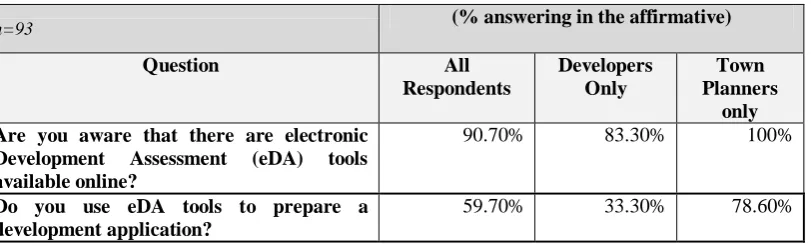
Most respondents (over 91%) were aware that there are electronic Development Assessment (eDA) tools available online (e.g. Smart eDA service, PDOnline, ePlanning Townsville) – refer Table 4. However developers are slightly less aware of Development Assessment (eDA) tools than other groups, with only 83% awareness. All town planners indicate that they are aware of Development Assessment (eDA) tools.
19th Annual PRRES Conference, Melbourne, Australia, 13-16 January 2013 6 The relatively high level of awareness amongst survey respondents of the availability of electronic Development Assessment (eDA tools), may also be more reflective of those participating in the survey, rather than the wider industry. Therefore, the extent of this awareness amongst industry participants more generally is not known. Anecdotally though, it would be reasonable to conclude that based on the survey results the number of town planners (and to a lesser extent developers) in Queensland that are aware of the existence of eDA tools is considerable.
Table 4 eDA Usage and awareness
n=93 (% answering in the affirmative)
Question All Respondents
Developers Only
Town Planners
only Are you aware that there are electronic
Development Assessment (eDA) tools available online?
90.70% 83.30% 100%
Do you use eDA tools to prepare a development application?
59.70% 33.30% 78.60%
Use of eDA tools
60% of respondents reportedly use eDA tools to prepare a development application; in contrast to developers where only 33% of respondents report that they use them. The primary reason developers do not use eDA tools (if that is the case) is because “Council doesn’t offer the services” (40%), and a range of other reasons (50%). The primary reason town planners report that they do not use eDA tools (if that is the case) is because they “Don’t like them” (50%), and a range of other reasons.
The reasons considered to least explain why respondents do not use eDA tools are “don’t have the equipment or internet” (4.5%), together with “staff not confident / competent in their use”, “didn’t know they existed”, or “don’t like them” (9% of all respondents in each case).
For those respondents already using eDA tools, there is a wide variety of opinion concerning what respondents think would encourage them to increase usage of eDA tools. The most popular reason (71% of respondents) is “ability to lodge any type of development application”, followed by “improved reduction in time in getting a decision on an application “(66%) and “availability in more councils across Queensland” (54%).
For those respondents not currently using eDA tools, there is also a reasonably wide variety of opinion concerning what might encourage them to start using eDA tools. However, one reason stood out above all others, being the availability of “a consistent system available across Queensland” (69% of all respondents). It is noteworthy that this is rated well ahead of the next most popular reason, being “financial savings” (40%), closely followed by “ability to save time” (37%). “Training in the use if the tools” (31%), and “more information about the eDA” (22%) are also significantly rated.
Developers agree with other categories of respondents that the availability of “a consistent system available across Queensland” (69% of all developer respondents) is the most important thing that might encourage them to use eDA tools. This aligns with the response from the Town Planner cohort, where 94% of respondents in this category rate the availability of “a consistent system available across Queensland” as the most important issue.
It may therefore be concluded that the majority of those who are aware of eDA tools existence use them – particularly town planners. However, dependent upon the cohort profile there are a large proportion who do not use eDA tools – e.g. only one third of developers use eDA tools. For those using eDA tools, the vast majority indicate that they regularly use eDA tools - and many, “always”. Indications are that those early adopters of eDA technology have strongly embraced the technology and use it as a commonplace work tool. This particularly applies to town planners.
19th Annual PRRES Conference, Melbourne, Australia, 13-16 January 2013 7 Usefulness of eDA tools
Overall responses indicate that most of the tools developed for eDA are being utilised by most users for a wide range of purposes. However, developers have a much stronger, more stratified pattern of eDA tool usage. For example, without exception, all developer respondents use eDA tools for “Tracking Progress of DA’s”. The next most popular reason for developers is “Keeping informed about development in my area” (67%). One third of developer respondents utilise eDA tools for the remaining reasons (including “Saving Time”), with the exception of preparing or lodging applications which is not used by developers at all (it is assumed that developers rarely lodge their own applications; and utilise town planners and related professionals for this purpose).
Town Planners overwhelming (90% response) use eDA tools to lodge an application, with other popular uses (responses over 70%) being “save time” (80%), “prepare an application” (75%), “tracking progress of DA’s” (75%), and “avoid printing” (70%).
Those tools reported as being most useful by all cohorts are Development Application tracking (86% rated as “useful” or better than neutral), Electronic lodgement (78%), Electronic processing of applications (69%) and Electronic referrals (72%). State Assessment Search (64%) and Electronic payment (61%) are also considered to be useful tools. However, “Electronic payments” rating is dichotomous since it also has a disapproval rating of 17% “not useful”, or less than neutral.
Perhaps the reason for the apparent contradictory results for Electronic payment ratings is that many of the respondents (e.g. town planners) would not be directly paying DA fees on behalf of their clients, and therefore this functionality is not required for them. However, this explanation is not fully supported when considering developer only results which indicate that this group is mostly neutral about the usefulness of electronic payments (67% rate the tool as “neutral”, and only 33% consider the tool “useful”.). Another possible explanation is the usability or functionality of the tool itself, or the lack of confidence in terms of the level of security when undertaking transactions: this aspect requires further research.
Those tools regarded most poorly by respondents (rated as “not useful”, or less than neutral) include Development Enquiry (17% rated as “not useful”), Planning Scheme online and Electronic well made wizards (both 14%). Developers all consider the Property Enquiry tool, Development Enquiry tool, and the Development Application tracking tool as being the most useful (100% rate each of these tools as “useful”). Town Planners find the “Electronic lodgement” and “Electronic Referrals” tools the most useful at 85% and 70% “useful” response rates. “Development application tracking” also received a 70% response. The least popular tool for town planners is the “Planning Scheme online” tool, where only 30% recorded this tool as being useful, 40% neutral, and 15% either “not useful” or moderately not useful.
Although eDA tools are clearly being used for a wide range of purposes, the majority of respondents use eDA tools for lodging a development application and the ability to track DA’s and preparing an application. Ability to save time is once again a consistent theme here. Although separately listed as a purpose for using eDA tools in its own right, this is strongly related to eDA preparation, lodgement, and tracking.
There is strong disagreement with the suggestion that the Smart eDA preparation tool helps to reduce the number of Information Requests received. This will need to be seriously considered by bureaucracies whom seek to use these tools as a means to overcome this particular difficulty.
Benefits from using eDA tools
Respondent’s strongest agreement in relation to benefits derived from eDA tools relates to the ability to save time (47% “strongly agree” plus 36% agreeing, totalling 83%). Only 3% disagreed with this proposition. Perceived time benefits are also borne out in relation to more specific questions relating to application preparation and response time by decision makers. The next highest rating in relation to benefits derived from eDA tools, relates to the ability to access information (34% “strongly agree” plus 26% agreeing, totalling 60% in agreement). However, 9% of respondents disagree with this proposition.
The suggestion that most respondents disagree with is in relation to the proposition that eDA tools help in identifying suitable sites for particular development (over 37% of respondents strongly disagree, and 14% disagree). Together with 29% of neutral respondents, this implies that 81% of respondents are unconvinced that there are any benefits to be gained in this area. This tool as has one of the strongest disagreement ratings for eDA tool benefits.
19th Annual PRRES Conference, Melbourne, Australia, 13-16 January 2013 8 one third recording that there is no or negative difference, and two thirds reporting either up to half a day, or more than one days benefit in time.
In terms of the cost of staff time involved in preparing applications, broad / indicative calculations of the above time benefits can be demonstrated top show that eDA tools have resulted in a typical time saving of approximately 2 ¼ hours which may be valued as a direct cost saving to an organisation of around $303 per development application. However, results vary considerably (a standard deviation of 6.38 hours, or $865), and time savings well beyond the median amount are achievable for particular situations. For example, high estimate suggests savings of 12 hours and beyond, or $1,626 per application.
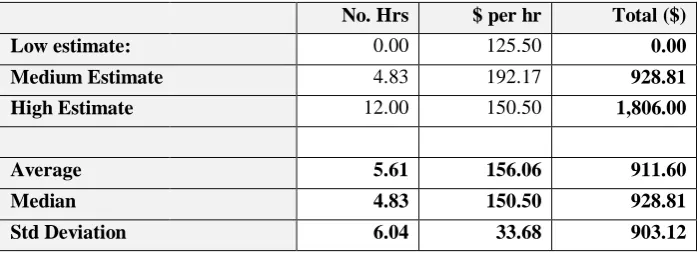
In the case of developers, the perceived level of time savings by using eDA tools is higher than for others. For this cohort, eDA tools result in a typical time saving of approximately 4 ¾ hours which may be valued as a direct cost saving to an organisation of around $928 per development application – refer Table 5. The reason why this amount is higher than for respondents overall is in part due to the higher cost of staff time, but mostly due to over double the time saved, compared to respondents overall, in DA preparation. As for respondents overall, results vary considerably (a standard deviation of 6.04 hours, or $903 is indicated); similarly, time savings well beyond the median amount are achievable for particular situations.
Table 5 Time Saving calculation: DA Preparation (Developers only)
No. Hrs $ per hr Total ($) Low estimate: 0.00 125.50 0.00 Medium Estimate 4.83 192.17 928.81 High Estimate 12.00 150.50 1,806.00
Average 5.61 156.06 911.60 Median 4.83 150.50 928.81 Std Deviation 6.04 33.68 903.12
In relation to the amount of time saved in receiving a decision for a typical development application, as a direct result of the release of eDA tools (i.e. overall timeline - application preparation to decision), respondents are very positive in their answer to this question. 80% of respondents indicate that the time saving is at least up to half a day or more. 25% of all respondents indicate a time saving of 2 days, with over 14% reporting time savings of up to one week for each application. However, the response from developers strongly contrasts with other categories of respondents. For example, 67% of developers believe that there is no difference in the amount of time saved in receiving a decision for a typical development application, as a result of eDA tools availability.
Overall, it may be concluded that respondents perceive the amount of time saved in receiving a decision, as a result of utilising eDA tools, is typically 13.5 hours or approximately 1 ¾ days. As in the case of direct cost savings to an organisation involved in the preparation of a development application outlined previously, based on the spread of results, and comments received from respondents, individual results vary considerably and time savings well beyond these amounts are achievable for particular situations. This variation is evident with a standard deviation of 20.62 hours and a median of only 13.51 hours. The high estimate by respondents indicates a time saving of 40.5 hours or 5.06 days.
Results in relation to estimated time savings due to application preparation and response by regulators, reinforce respondents strong agreement in relation to the ability to save time as a major overall benefit derived from the use of eDA tools (83% of all respondents are in agreement with that suggestion). However, developers in general remain to be convinced of the extent of such time savings – with 67% of respondents reporting “no difference”. Nonetheless, as is the case for respondents generally, individual results vary considerably and time savings well beyond these amounts might be achievable for particular situations. The high estimate by developer respondents is the same for all respondents, indicating a time saving of 40.5 hours or 5.06 days.
The results here show that time saving is consistently rated as the chief benefit gained by using eDA tools. However, estimating how much time is saved varies considerably. For developers, the perceived level of time savings is higher than for other cohorts, but as for respondents overall, results vary considerably. Individual situations may result in achieving time savings well above median levels.
19th Annual PRRES Conference, Melbourne, Australia, 13-16 January 2013 9 results vary considerably and time savings well above median levels repoorted are indicated for particular situations. It is noteworthy that developers in general are sceptical of the extent of such time savings.
Combined estimated time savings due to application preparation and response by regulators reinforce strong agreement in relation to the ability to save time as a major overall benefit derived from the use of eDA tools.
Specific holding cost issues
The final section of the industry survey diverts from the specifics of eDA tools, embracing a broader perspective on the wider impacts of delays in the property development pipeline. This is regardless of improvements that might or might not be gained by eDA tools and / or DA processing generally. Its focus is to find out how much respondents know about holding costs and holding cost theory, their perception of the economic impact of holding costs and the pervasiveness of development assessment processes in the wider context of holding costs; and finally, whether they believe that holding costs are passed on to end-users.
Identification of holding costs and their relative importance
Respondents were asked to identify whether specified "holding" costs are typically incurred by them (either personally, or by their organisation) when undertaking a property development project. Since not all respondents are directly involved in funding property development projects, it may be reasonably expected that not all holding costs identified would be specifically incurred by the respondent. However, at least 40% of respondents indicated that they incurred holding costs as specified in the question, with by far the highest response received in relation to “staff time incurred due to participation in planning processes”. Approximately 40% of respondents believed they incur specific holding costs, namely, interest paid (or foregone) on land purchase / acquisition or financial commitment; interest paid (or foregone) during the development assessment process; other government fees and charges during acquisition and development (e.g. land tax, rates); other costs relating to delays leading to reduced or cancelled financial returns ; and delayed payment of professional fees .
As might be expected, the developer cohort have much higher response rates overall when asked whether specified "holding" costs are typically incurred by them (either personally, or by their organisation) when undertaking a property development project. The two highest responses received were for “regulatory fees for development, e.g. DA application fees, statutory approvals”; and “staff time incurred due to participation in planning processes” (both 94% of respondents in this category). The latter issue is also the highest response received overall, as noted previously.
Whilst there appears to be some measure of uncertainty by respondents as to whether or not they are incurring certain categories of holding costs, as indicated by the lack of recognition of their likely incurrence and the accompanying commentary provided, the position of developers is that they exhibit greater certainty in identifying holding costs typically incurred when undertaking a property development project.
There is a pre-occupation with the costs of staff time and regulatory fees as a significant contributor towards holding costs, by both developers and all other respondent categories. However, surprisingly less recognition is given in respect of those holding costs likely to be most pervasive, i.e. interest paid on land purchase / acquisition / commitment, and other costs relating to delays leading to reduced or cancelled financial returns. Whilst this may be understandable in relation to the non-developer cohort who is much less likely to have a direct financial interest in this area, and accordingly rated as one of the lowest rated impacts, this would not apply in the case of most developers. Nonetheless, most developers rate this highly, but not as highly as the aforementioned, and not even as high as the interest paid (or foregone) during the development assessment process.
Pre-occupation with staff time, along with “delayed payment of professional fees” is particularly evident with the town planner cohort, with over 70% of respondents in this cohort group indicating that these are the most predominant holding costs, and, unlike most other cohorts, they do not believe that interest paid (or foregone) on land purchase / acquisition or financial commitment, along with interest paid (or foregone) during the development are significant. This result is logical since the majority of town planners do not involve themselves in property development funding (hence interest costs will not, by and large, be relevant to them). However, delayed payment of professional fees is likely to be most relevant, along with unpaid staff time incurred due to (typically early) participation in the planning process with their clients.
Quantification of holding costs
19th Annual PRRES Conference, Melbourne, Australia, 13-16 January 2013 10 acquisition and development (e.g. land tax, rates), staff time incurred due to participation in planning processes, other costs relating to delays leading to reduced or cancelled financial returns; delayed payment of professional fees; and other.
Approximately one third of respondents, regardless of their grouping (i.e. their business or profession) indicate that this calculation is too variable or difficult to calculate (37% of all respondents, and 31% of developers). The relative significance is quite obvious when viewed alongside other possible responses to this question, indeed many respondents are unsure about how to estimate this cost. 52% of all respondents were either unsure, or otherwise unable to calculate an estimate of holding costs (i.e. identify "holding" costs typically incurred when undertaking a property development project).
For those respondents able to articulate an estimate of the holding costs typically incurred (i.e. 48% of respondents overall), the most popular range equates to "over $200 per day (over $6,000 per month)" - accounting for 17% of respondents. This is similarly the most popular range selected by developers, but to a much greater extent since this is selected by proportionally over double the number of respondents (38% of developers). The next most popular range comprised fewer than 10% of respondents who selected “$76 to $100 per day (up to $3,000 per month)”. These results indicate that whilst many respondents are unsure or unable to calculate the extent of holding costs incurred, the vast majority who are able to articulate impact indicate that it is pervasive, i.e. over $200 per day or $6,000 per month. This not only applies for developers, but other respondent groups as well. Developers exhibit greater certainty in their ability to calculate holding costs than other cohorts.
It can be calculated that all holding costs typically incurred by respondents (i.e. those able to articulate impact), equates to approximately $149 per day, or $4,532 per month. This may be compared with Garner’s Holding Cost Economic Model (Garner, 2012) which indicates that holding costs “typically incurred” for a 200 lot development amount to $16 per day, or $501 per month on a per lot basis. Additional comparisons - against case studies in the research conducted by Garner - are shown at Table 6. The case studies show great disparities on a “per development” basis, ranging from almost $3,000 per month to almost $59,000 per month; results being largely dependent upon the size of development. Therefore results are best compared on a “per lot” basis which shows a greater level of homogeneity with a median of $501 per month . Bearing in the mind the significant number of respondents in the survey who indicated that they could not calculate holding costs (“too variable, too difficult”, or “unsure”), the significantly different result derived from the survey amount of $4,532 per month may be explained by several considerations: either there was a high degree of respondent inaccuracy, or the actual difference encountered was genuinely widely disparate; or a combination of both.
Table 6 Holding Cost Comparison with data modelling and case studies
HOLDING COSTS
$AUD
Base case scenario
Case Study A
Case Study
B
Case Study C
Case Study D
median average
No of lots 200 83 17 142 20 83 92 PER LOT BASIS
per day $16.48 $16.52 $31.85 $13.54 $4.84 $16.48 $16.65
per month $501 $503 $969 $412 $147 $501 $506
PER DEVELOPMENT BASIS (200 lots)
per day $3,296.13 $1,371.43 $541.50 $1,923.29 $96.81 $1,371.43 $1,445.83
per month $100,257 $41,714 $16,470 $58,499 $2,945 $41,714 $43,977 Source: Garner (2012)
Respondents estimate that holding costs could range from a low of around $5 per day, or $152 per month, to a high estimate that exceeds $300 per day, or $9,125 per month (see Table 7). Considerable variability therefore exists with results, as indicated by a standard deviation of $4,487 with a median of $4,526 per month equivalent as shown at Table 7 which provides low, medium and high estimates based on the moving averages of weighted response ranges. This extreme variability in results may be reflective of the variability of impact depending upon individual situations; however this could also reflect widespread misunderstanding about the nature and composition of holding costs.
19th Annual PRRES Conference, Melbourne, Australia, 13-16 January 2013 11 Table 8 calculates that all holding costs typically incurred by Developer respondents, equates to approximately $205 per day, or $6,200 per month (weighted median). This is moderately higher than that indicated for all respondents generally. As for respondents generally, considerable variability exists with results for the Developer cohort, as indicated by a standard deviation of $4,580 per month equivalent as shown at Table 9 which provides low, medium and high estimates based on the moving averages of weighted response ranges.
Table 7 Holding Cost Calculation - low, medium, high estimates (all respondents)
All Holding Costs
n=93
$ per day $ per month equivalent
Low estimate: $5.00 $152.08
Medium Estimate $148.81 $4,526.24
High Estimate $300.00 $9,125.00
Average $151.27 $4,601.11
Median $148.81 $4,526.24
Standard Deviation $147.52 $4,486.93
Table 8 Holding costs estimates ($ per day) - all costs (developers)
Response Revised response weighting*
Range (low)
Range (high) Average Median Weighted Median #
0.00% 0% $0.00 $10.00 $5.00 $5.00 $0.00
6.20% 9% $11.00 $20.00 $15.50 $15.50 $1.40
0.00% 0% $21.00 $40.00 $30.50 $30.50 $0.00
6.20% 9% $41.00 $50.00 $45.50 $45.50 $4.11
0.00% 0% $51.00 $75.00 $63.00 $63.00 $0.00
6.20% 9% $76.00 $100.00 $88.00 $88.00 $7.95
12.50% 18% $101.00 $200.00 $150.50 $150.50 $27.42
37.50% 55% $200.00 over# $300.00 $300.00 $163.99
31.20% variable/difficult
0.00% unsure
Total 100% 100% $87.25 $54.25 $204.88 Standard Deviation $56.67 *Response weighted after deletion of respondents returning “variable/difficult” or “unsure” response
# Median weighted in accordance with revised response rate
Proportion of holding costs incurred during the DA process
In order to determine the specific impact of the DA process, respondents were asked to provide an estimate of the proportion of total holding costs incurred during the development assessment process. The highest response (47% of all respondents) was “don't know or too difficult to estimate”. This response is even higher than respondents indicating their inability to calculate holding costs moregenerally (36.5%), but compares to an amalgamation with those “unsure” respondents which total 51.9% of all respondents. It is these respondents that may be generally regarded as being uncertain. Accordingly, the level of uncertainty with regards calculation or breakdown of holding costs is very high.
19th Annual PRRES Conference, Melbourne, Australia, 13-16 January 2013 12 the developer cohort acts with greater levels of certainty, an even wider span of opinion is evident as to what the level may be. Only 12.5% of developers indicate “don't know or too difficult to estimate”. Approximately 19% of developer respondents indicate that the proportion of total holding costs that are incurred during the development assessment process is either between 5%-10% of total holding costs. There is a relatively even spread of opinion given for the other ranges for developers. The result here infers that either developers in fact experience a very wide range of holding costs proportionate to holding costs overall, or they have significantly differing opinions in this regard.
Table 9 Holding Cost Calculation - low, medium, high estimates (Developers only)
All Holding Costs $ per day $ per month equivalent
Low estimate: $5.00 $152.08
Medium Estimate $204.88 $6,231.89
High Estimate $300.00 $9,125.00
Average $169.96 $5,169.66
Median $204.88 $6,231.89
Standard Deviation $150.57 $4,579.80
Table 10 provides a summary of the proportion of holding costs estimated by respondents to represent that due to the Development Assessment. Table 11 provides calculations that combine responses relating to the quantum of holding costs more generally, and the proportion due to the DA process, in order to arrive at a costing of the median estimate of the direct economic impact of the DA process. These tables indicate that the median proportion of holding costs due to the DA process is in the order of 30% of all holding costs. This equates to approximately $44 per day or $1,351 per month. However results are extremely variable, with respondents indicating estimates from a low of $4 per month, to a high estimate of $7,984 per month. The standard deviation of $4,272 with a median of only $1,351 indicates that either results vary enormously depending upon the situation, or alternatively respondents have an inability to provide estimates that have even a modicum of consistency.
With regards the developer cohort, it may be calculated that the median proportion of holding costs due to the DA process is in the order of 38% of all holding costs (this compares to 30% for all respondents). This equates to approximately $78 per day or $2,383 per month. However as for all respondents generally, results are extremely variable. The standard deviation of $4,097 with a median of only $2,383 indicates, as for the respondents overall, similar extreme variation.
Table 10 Proportion of holding costs due to DA assessment (all respondents)
Response
n=93
Revised response weighting*
Range (low)
Range (high) Average Median Weighted Median #
7.50% 14% 0.0% 5.0% 2.5% 2.5% 0.4%
15.10% 29% 6.0% 10.0% 8.0% 8.0% 2.3%
5.70% 11% 11.0% 20.0% 15.5% 15.5% 1.7%
7.50% 14% 21.0% 40.0% 30.5% 30.5% 4.3%
7.50% 14% 41.0% 50.0% 45.5% 45.5% 6.5%
1.90% 4% 51.0% 75.0% 63.0% 63.0% 2.3%
7.50% 14% 75.0% 100.0% 87.5% 87.5% 12.5%
47.20% variable/difficult
Totals 100% 36.07% 30.50% 29.86% *Response weighted after deletion of respondents returning “variable/difficult” or “unsure” response
19th Annual PRRES Conference, Melbourne, Australia, 13-16 January 2013 13
Table 11 Calculation of the impact of the DA process on holding costs (all respondents)
Holding Costs due to DA
n=93
Proportion (%) $ per day $ per month equivalent
Low estimate: 2.50% $0.13 $3.80
Medium Estimate 29.86% $44.44 $1,351.73
High Estimate 87.50% $262.50 $7,984.38
Average 39.95% $102.36 $3,113.30 Median 29.86% $44.44 $1,351.73 Standard Deviation 43.39% $140.45 $4,271.97
Passing on holding costs
An important part of the holding cost equation relates to a critical question that seeks determination as to which party or parties actually absorb holding costs – and in particular, whether such holding costs are passed on to end user clients (i.e. home buyers). To this end, respondents were asked a final question as to the extent to which “the majority of holding costs are typically passed on to end users (clients)”. Possible alternatives were “always”, “often”, “sometimes”, or “rarely”. 69% of all respondents indicated that holding costs are either “always” passed on (31%), or “often” passed on (38%). A further 16% indicate that holding costs are “sometimes” passed on. Only 16% suggested that holding costs are rarely passed on.
This indicates that overwhelmingly, industry participants recognise that in most cases, holding costs are passed on to end users. The response is even more pronounced in the case of the developer cohort. In this instance, 75% of all respondents indicate that holding costs are either “always” passed on (44%), or “often” passed on (31%). A further 19% indicate that holding costs are “sometimes” passed on, and only 6% suggest that holding costs are rarely passed on. However, the response is less pronounced in the case of the town planner cohort. In this instance, 67% of all respondents indicate that holding costs are either “always” passed on (40%), or “often” passed on (27%). A further 20% indicate that holding costs are “sometimes” passed on. However a larger response compared to other cohorts (13%) suggest that holding costs are rarely passed on. This demonstrates overwhelming evidence regarding industry’s perception that holding costs are mostly passed on to home buyers.
Inconsistencies in holding cost related issues
There is considerable inconsistency in relation to responses received generally for matters relating to the identification, quantification and / or breakdown of holding costs, irrespective of the respondent cohort grouping. For the majority of respondents, holding costs are either unknown, or too difficult or variable to estimate; many respondents are also unsure how to calculate them. The only consistency exists in relation to the high level of difficulty in trying to quantify holding costs – a theme expressed by many respondents, and all respondent groups generally. This result is in many respects understandable, since not all respondent groups are directly involved in funding property development projects.
For those respondents having the confidence to calculate impact, a significant variance of opinion exists in relation to the nature, quantum and breakdown of holding costs regardless of whether they are due to the development assessment process or otherwise. However, despite a wide variance of opinion, somewhat less uncertainty exists in the case of the developer respondent cohort.
Nearly half of all respondents identify specific forms of holding costs that apply to them, and of those over three quarters recognised “staff time incurred due to participation in the planning process” as a significant holding cost. Regulatory fees for development (e.g. DA application fees and charges related to statutory approvals) are also recognised by many respondents as holding costs.
19th Annual PRRES Conference, Melbourne, Australia, 13-16 January 2013 14 financial returns. These holding costs are amongst the lowest rated impacts for the non-developer cohort – a logical outcome for a cohort much less likely to have a direct financial interest in funding a project.
Considerable variability exists with results relating to the estimated indicative level of holding costs typically incurred. Estimated holding costs typically incurred by Developer respondents are moderately higher than that indicated for all respondents generally, however, as for respondents generally, considerable variability exists with results. This extreme variability in results is, at least in part, reflective of the variability of impact depending upon individual situations. However, given the widespread inability to provide estimates, the indicated level of uncertainty with regards calculation, taken together with comments provided separately by respondents; it is also possible to conclude that it is equally likely to reflect widespread misunderstanding about the nature and composition of holding costs.
Although it would seem that developers act with greater levels of certainty, the vast majority of respondents have significant difficulty in assessing the proportion of holding costs that relate specifically to the DA process; and therefore identifying the extent of its true impact. Therefore, any conclusions reached here must be viewed with considerable uncertainty and scepticism, and are at best indicative.
Finally, respondents from all cohorts overwhelming believe that holding costs are always, or nearly always, passed on. Although not quite as pronounced in the case of town planners, three quarters of developers indicate this.
CONCLUSIONS
Linkages with housing affordability
This survey indicates that those who are aware of the existence of Electronic Development Assessment (eDA) tools use them primarily for the reason of saving time. The recurrent theme of time having a discernible economic impact was a consistent theme expressed throughout. There are some restrictions however in that, although the tools have been by and large strongly embraced by those who have awareness of their availability, their usefulness is largely limited to less complex developments. This therefore may not augur well for the target of this research, i.e. specifically, property developments involving in mid -sized developments (i.e. between 15-200 residential greenfield lot developments) in South East Queensland. This is because by and large it would be expected that these sized developments involve a reasonable to considerable degree of complexity. Nonetheless, issues related to time and more particularly “the ability to save time” (including further time reductions in application preparation, or obtaining a decision on an application), regardless of the size or complexity of the development, are very important themes persistently expressed. Since the perceived time savings are strongly expressed as the primary benefit of using eDA tools, their introduction to the Queensland property development / planning community has therefore been well received. Time saving is perceived as being achieved by both completing and processing of DA’s, as well as the receiving of decisions by regulatory authorities.
With regards the identification, quantification and breakdown of holding costs, the evidence presented by the survey respondents indicates considerable inconsistency. Not only are many industry participants (including property developers) unable to articulate the quantum of holding costs but they are also unsure as to how to calculate or even identify them. Somewhat paradoxically, they are aware of their existence, and also aware that they carry considerable impact.
A significant variance of opinion also exists in relation to calculation of holding costs regardless of whether they are due to the development assessment process or otherwise. However, less uncertainty exists in the case of the developers who are more likely to identify specific forms of holding costs. Many are able to identify holding costs such as: staff time incurred due to participation in the planning process, regulatory fees for development (e.g. DA application fees and charges related to statutory approvals); interest paid (or foregone) on land purchase / acquisition or financial commitment; interest paid (or foregone) during the development assessment process; other government fees and charges during acquisition and development (e.g. land tax, rates); other costs relating to delays leading to reduced or cancelled financial returns; and, delayed payment of professional fees. Nonetheless, even developers tend to be less cognitive of those holding costs likely to be most economically persistent, e.g., interest paid on land purchase / acquisition / commitment, and other costs relating to delays leading to reduced or cancelled financial returns.
Attempts to quantify the level of holding costs typically incurred by property development projects resulted in median calculations of $149 per day, or $4,532 per month, with some estimates exceeding $300 per day, or $9,125 per month. Considerable variability exists with results – there are indications that they are not statistically consistent or robust. However, this extreme variability in results is at least partly reflective of the variability of individual situations.
19th Annual PRRES Conference, Melbourne, Australia, 13-16 January 2013 15 greater variability. For this reason, considerable uncertainty exists. The median calculation for property developers indicate a higher proportion of holding costs due to the DA (in the order of 38% of all holding costs – equating to approximately $78 per day or $2,383 per month); however as for all respondents generally, results are extremely variable.
Finally, the response to a critical question, which goes to the very heart of this research, indicates that industry participants overwhelming believe that holding costs are always, or nearly always, passed on. It is noteworthy that this perception is most strongly held in the case of property developers.
Relative potential for holding cost reduction by eDA tools
The variability and extent of the assessment periods may be seen the largely qualitative (unverified) evidence presented herein. However, it is recognised that whilst the assessment period is a major contributor to overall property development time frames, it is not the only contributor. However, the dimension of regulatory assessment as part of the “development pipeline” establishes firm connections between holding costs and housing affordability. Most noteworthy is the impact of the assessment period. It can be very significant, as it is for any delay experienced in the course of a property development project - irrespective of the reason. Furthermore, it is logical that delays encountered in later stages become more costly since as time goes on, the developer becomes more and more exposed, and therefore “carries” increasing levels of holding costs as the project progresses.
It is recognised that finding ways to reduce or offset the commercial / corporate interest rate regime applying for property developers undertaking midsized greenfield residential development projects holds the single most significant promise for reduction of holding costs. However, on the basis that holding costs are ultimately passed on to end users, there can be little doubt that he reduction of red tape, and therefore the timelines involved in property development projects, also represent significant potential for reducing holding costs.
Opportunities for streamlining the existing planning framework used in South East Queensland hold promise for significantly reducing holding costs. Although implementation of eDA tools by HAF is a step in this direction, it is not generally a suitable option for more complex projects typical of larger, midsized greenfield residential development projects. Emerging schemes such as that being implemented by the ULDA are better geared to solving issues relating to time consuming “red-tape” procedures; however it is still too early for that particular format to fully demonstrate its benefits.
Recommendations for further research
1. Whilst acknowledging the difficulties in obtaining information because of commercial confidentiality and sensitivity, obtaining case study material from participants within the geographical location could be used to further validate the largely qualitative findings presented in this paper.. This would provide, inter alia, greater reliability and therefore increased confidence levels in the findings.
2. There is considerable variation between various planning instruments (geographically), and the length of regulatory assessment periods. This implies the need for a case study approach collecting empirical evidence based on various group relationship data. Broader analysis across multiple regional areas may be preferable in determining the overall nature of holding cost patterns. It has yet to be demonstrated whether the findings contained herein can be replicated in other geographic locations, and in different target market sizes.
REFERENCES
Barnes, T. (2007). NSW Planning System Adds Massive Holding Costs. Retrieved from http://www.urbantaskforce.com.au/attachment.php?id=615
Bourassa, S. C. (1992). Economic effects of taxes on land: A review. American Journal of Economics & Sociology, 51(1), 109-113.
19th Annual PRRES Conference, Melbourne, Australia, 13-16 January 2013 16 COMSEQ. (2010). Strategic Submission to the Productivity Commission on the Performance Benchmarking of
Australian Business Regulation: Planning, Zoning Productivity Commission and Development Assessments Issues Paper / Dealing with the challenges of growth: Position Paper: Council of Mayors South East Queensland.
Eagles, P. (2008). The Urban Land Development Authority and Affordability. Urban Developer(01 2008), 1.
Garner, G. O. (2012). The significance of financial barriers caused by holding costs in greenfield residential development. Paper presented at the European Real Estate Society 19th Annual Conference 13th-16th June 2012 (Refereed Paper), Edinburgh, Scotland, United Kindom.
Gurran, N., Ruming, K., & Randolph, B. (2009). Counting the costs: planning requirements, infrastructure contributions, and residential development in Australia: Australian Housing and Urban Research Institute.
Marshall, G. (2010, Tuesday, 14 September 2010 5:37 PM). [Effect of holding costs on affordability: eDA Survey and Benefits Activity - microeconomic and productivity implications of land holding (Personal communication) ].
PIA. (2010). Submission: Productivity Commission: Performance Benchmarking of Australian Business Regulation: Planning, Zoning Productivity Commission and Development Assessments: Planning Institute of Australia (NSW Division).
Productivity Commission. (2010). Performance Benchmarking of Australian Business Regulation: Planning, Zoning Productivity Commission and Development Assessments Issues Paper. Canberra: Australian Government Retrieved from http://www.pc.gov.au/projects/study/regulationbenchmarking/planning.
Set, R. (2007, Apr 19, 2007 12:10pm AEST ). Developers fear council mergers may harm property boom, ABC Radio. Retrieved from http://www.abc.net.au/news/stories/2007/04/19/1901341.htm
Tse, R. Y. C. (1998). Housing Price, Land Supply and Revenue from Land Sales. Urban Studies, 35(8), 1377-1392.
ULDA. (2010). Submission to the Productivity Commission - Performance Benchmarking of Australian Business Regulation: Planning, Zoning Productivity Commission and Development Assessments. Brisbane: Urban Land Development Authority.
Yardney, M. (2007). The Risks Related to Property Development. Retrieved from