https://doi.org/10.5194/amt-11-2821-2018 © Author(s) 2018. This work is distributed under the Creative Commons Attribution 4.0 License.
Folded tubular photometer for atmospheric measurements
of NO
2
and NO
John W. Birks1, Peter C. Andersen1, Craig J. Williford1, Andrew A. Turnipseed1, Stanley E. Strunk1, Christine A. Ennis1, and Erick Mattson2
12B Technologies, Inc., 2100 Central Ave., Suite 105, Boulder, CO 80301, USA
2Colorado Dept. of Public Health and Environment, Air Pollution Control Division/Technical Services Program, 4300 Cherry Creek Drive South, Denver, CO 80246, USA
Correspondence:John W. Birks (johnb@twobtech.com)
Received: 22 January 2018 – Discussion started: 12 February 2018
Revised: 17 April 2018 – Accepted: 20 April 2018 – Published: 14 May 2018
Abstract. We describe and characterize a modular folded tubular photometer for making direct measurements of the concentrations of nitrogen dioxide (NO2) and specify how this method could be extended to measure other pollutants such as sulfur dioxide (SO2), ozone (O3), and black carbon particulate matter. Direct absorbance measurements using this photometer can be made across the spectral range from the ultraviolet (UV) to the near infrared. The absorbance cell makes use of modular components (tubular detection cells and mirror cubes) that allow construction of path lengths of up to 2 m or more while maintaining low cell volumes. The long path lengths and low cell volumes enable sensi-tive detection of ambient air pollutants down to low part-per-billion levels for gas species and aerosol extinctions down to 1 Mm−1, corresponding to∼0.1 µg m−3for black carbon particulates. Pressure equalization throughout the stages of the absorbance measurement is shown to be critical to ac-curate measurements of analyte concentrations. The present paper describes the application of this photometer to direct measurements of nitrogen dioxide (NO2) and the incorpo-ration of design features that also enable measurement of nitric oxide (NO) in the same instrument. Excellent agree-ment for ambient measureagree-ments along an urban roadside was found for both NO2and NO measured by the folded tubular photometer compared to existing standard techniques. Com-pared to commonly used methods for measurements of NOx
species, the advantages of this approach include (1) an abso-lute quantification for NO2based on the Beer–Lambert law, thereby greatly reducing the frequency at which calibrations are required; (2) the direct measurement of NO2
concentra-tion without prior conversion to NO as is required for the commonly used chemiluminescence method; (3) the use of modular components that allow construction of absorbance detection cells of varying lengths for extending the dynamic range of concentrations that can be measured; (4) a more economical instrument than other currently available direct measurement techniques for NO2; and (5) the potential for simultaneous detection of additional species such as SO2, O3, and black carbon in the same instrument. In contrast to other commercially available direct NO2 measurements, such as cavity-attenuated phase-shift spectroscopy (CAPS), the folded tubular photometer also measures NO simulta-neously in the same apparatus by quantitatively converting NO to NO2with ozone, which is then detected by direct ab-sorbance.
1 Introduction
rou-tinely measured both in ambient air and from direct industrial emissions (e.g., smokestack and fenceline monitoring). Lim-its on both pollutant emissions and ambient concentrations are regulated by the US Environmental Protection Agency (EPA). Concentrations of these pollutants are regulated by many other countries as well. There are also non-regulated species that are known to increase health risks and affect climate, such as black carbon particulates (BC, a subset of PM). Pollutant species can be either produced directly by various combustion processes (i.e., NO2, SO2, and BC) or formed by secondary photochemistry from other precursor chemicals. For example, it has been known since the 1950s that ozone is a secondary pollutant formed in the interaction of sunlight with volatile organic compounds and oxides of nitrogen (NOx=NO+NO2) (Haagen-Smit and Fox, 1954;
Birks, 1998). Nitric oxide (NO) is also of great significance since it is the principal precursor to NO2and serves as a cat-alyst in the atmosphere for formation of ozone. Therefore, it is expected that measurements of O3, NO2, NO, SO2, and black carbon will be required far into the future.
It is critical to obtain reliable, long-term interference-free measurements of these atmospheric pollutants, ideally with instruments that require little maintenance and minimal need for re-calibration. Currently, a variety of methods are used to monitor these different species, each having its own advan-tages and problems. Many of the current methods need fre-quent calibration or rely on indirect methods. For example, NO2is most commonly measured indirectly by conversion of NO2to NO, which is then measured by chemiluminescence (Parrish and Fehsenfeld, 2000). Absorption photometry is a direct measurement technique that is based on the intrinsic absorption characteristics (wavelength-dependent absorption cross sections) of the species of interest. Ozone, NO2, SO2, and black carbon all absorb at various wavelengths in the ul-traviolet, visible, and/or near infrared (IR). Light absorbance is governed by the Beer–Lambert law:
[I] [Io]
=e−σ lc or c= 1 σ lln
I
o I
, (1)
whereIois the light intensity passing through the absorbance cell with no analyte (e.g., O3, NO2, SO2, black carbon) present, I is the intensity of light passing through the ab-sorbance cell when the analyte is present, σ is the extinc-tion coefficient of the analyte (absorpextinc-tion cross secextinc-tion in cm2molec−1for gases; mass extinction coefficient in m2g−1 for particulates), l is the path length through the detection cell (cm or m), andcis the concentration of analyte within the detection cell (molec cm−3 for gases; µg m−3 for par-ticulates). Gas-phase concentrations are typically converted to mixing ratios by measuring the temperature and pressure within the absorbance cell and applying the ideal gas law. Light absorbance is an especially attractive technique, since it relies only on knowingσ, which is an intrinsic property of the molecule in the case of gas-phase species; the path length, which is easily measured; and the ability to measure relative
light intensities. Key to using absorption photometry is un-derstanding the limits to the analytical precision (relying on the magnitude ofσ, the minimum detectable absorbance, and the path length) and ensuring adequate selectivity over po-tential interferences (by selection of analytical wavelength(s) not significantly absorbed by other species and/or by selec-tive scrubbing of the analyte).
For ozone, the most common measurement method is by absorbance of the 253.7 nm line of a low-pressure mercury lamp. Here, co-absorbing interferences are small due to the large O3 absorption cross section (e.g., Turnipseed et al., 2017). Atmospheric measurements are easily made because the required precision (low ppb) can be achieved with practi-cal path lengths (l, Eq. 1). The absorbance, ln(Io/I ), can be measured in modern photometers with a precision (standard deviation or root mean square noise) of typically∼3×10⁻⁶. Combining this with the absorption cross section and optical path length, Eq. (1) can be rearranged to determine the over-all precision expected for measurement of a given analyte:
Precision(ppb)∼= 3×10 −6
σ l(P / kT ) ×10
9. (2)
Here,P and T are the absorbance cell pressure and tem-perature, respectively, andk is the Boltzmann constant. For ozone,σ253.7 nm=1.15×10⁻¹⁷cm2molec−1(Burkholder et al., 2015) and the precision is calculated to be 0.7 ppb for a path length of 15 cm or 0.35 ppb for a path length of 30 cm. These are in good agreement with the performance of com-mercially available ozone monitors.
Pollutants such as NO2, SO2, and black carbon absorb much less strongly than ozone in the spectral region where stable light sources exist (λ> 250 nm), thus requiring much longer path lengths. For NO2, with an absorption cross sec-tion of∼6×10⁻¹⁹cm2molec−1at 405 nm (near the peak of the NO2 absorption spectrum; Burrows et al., 1998) and assuming the same minimum measurable absorbance (3×10⁻⁶), a path length of∼203 cm is required to obtain a precision of 1 ppb. This is similar to that of SO2 if mea-sured at 290 nm (σ∼7×10⁻¹⁹cm2 molec−1; Vandaele et al., 1994). The mass extinction coefficient used for black carbon absorption at 880 nm is 7.7 m2g−1(Drinovec et al., 2015). Using this value and again assuming the precision in the measurement of absorbance to be 3×10⁻⁶, a path length of 3.9 m (390 cm) would be required to obtain a precision of 0.1 µg m−3for black carbon mass concentration.
have significant structure in the absorption spectrum so that absorptions can be extracted via fitting algorithms.
Closed-path, in situ absorption photometers have typically relied on using mirrors to “fold” the path length within the detection cell, with up to 100 or more reflections to increase the absorption path length. Of these, the White cell (White, 1942) is the most common. However, even miniaturized ver-sions of White cells have relatively large volumes, typically 180 cm3and larger, so that the flush times for typical flow rates of 1.8 L min−1are long. Also, the cell shapes required by the mirror arrangements exacerbate the problem, requir-ing multiple flush times to exchange 99 % of the cell contents (∼4.6 flush times assuming exponential dilution). Thus, for a cell volume of 180 cm3 (volume of a currently commer-cially available White cell with 2 m path length) and flow rate of 1.8 L min−1, the total required flush time is 27.6 s. To obtain the low absorbance precisions of 3×10⁻⁶stated ear-lier, it is important to measure the reference light intensity (Io) every 5 to 10 s due to small intensity fluctuations in typ-ical light sources. This requires total cell flush times of 2.5 to 5 s (to measure bothIandIo), which is incompatible with White cells unless excessively large (and hence impractical) flow rates are used (> 10 L min−1). Other folded-path con-figurations can be flushed more rapidly (e.g., Herriott cells; Herriott and Schulte, 1965) but require a collimated light source, which is noisier compared to uncollimated sources such as light-emitting diodes (LEDs) or low-pressure mer-cury lamps, thus largely offsetting the advantage in sensitiv-ity gained by the longer path lengths.
More recent advances employ high-reflectivity cavities to generate long path lengths. Cavity-enhanced absorption spectroscopy (CEAS) and variants such as cavity ring-down spectroscopy (CRDS) and cavity-attenuated phase-shift (CAPS) spectroscopy have been successfully used to measure numerous atmospheric constituents in the visible and IR regions (Paldus and Kachanov, 2004; Crosson, 2008; Kebabian et al., 2005). However, these high-reflectivity cav-ities are often expensive, and care must be taken such that mirror reflectivity does not degrade over time (resulting in a changing sensitivity and hence a need for frequent re-calibration). Furthermore, they tend to operate over a fairly narrow wavelength range limited by the mirror reflectivities of the cavity.
Here we describe a new approach, a folded tubular pho-tometer, for measurements of a pollutant or other species in a gas such as air. The use of modular mirror cubes in combina-tion with tubular flow cells allows the path to be folded, mak-ing it compact enough for a several-meters-long detection cell to fit into a conventional rack-mount-sized or smaller enclosure that can be produced relatively inexpensively com-pared to other optical techniques. Further, the design makes it possible to reduce the cell volume and therefore also the flush times significantly, allowing a newIorIomeasurement to be made once every 5 s or less. Because those measure-ments are made close together in time, variations in the lamp
intensity between measurements is small, resulting in higher precision relative to a White cell or Herriott cell of the same path length. Using this approach, measurements of ambient concentrations of NO2, SO2, and black carbon by direct ab-sorbance in the gas phase become feasible and economical.
This paper presents a design of the folded tubular pho-tometer that enables rapid measurements of both NO2 and NO within the same instrument and temporally separated by only a few seconds. NO2is measured by direct absorption at 405 nm. NO is measured by addition of ozone to convert NO to NO2with nearly 100 % conversion by the reaction:
NO+O3→NO2+O2. (3)
Subsequent measurement of the increase in NO2 concen-tration upon addition of ozone provides a highly accurate measurement of NO. The results described here show that this method provides a viable approach for measuring both NO2 and NO at atmospheric levels. Alternative commer-cially available methods for measuring NO2based on direct absorbance (CRDS or CAPS) currently measure NO2 but not NO. Therefore, the folded tubular photometer described here provides a relatively inexpensive alternative that mea-sures both NOx species required for air quality compliance
and predictive modeling. The folded tubular photometer de-sign also will be discussed as it pertains to direct absorbance measurements of other atmospheric species such as SO2and BC.
2 Experimental
2.1 Generalized folded tubular photometer
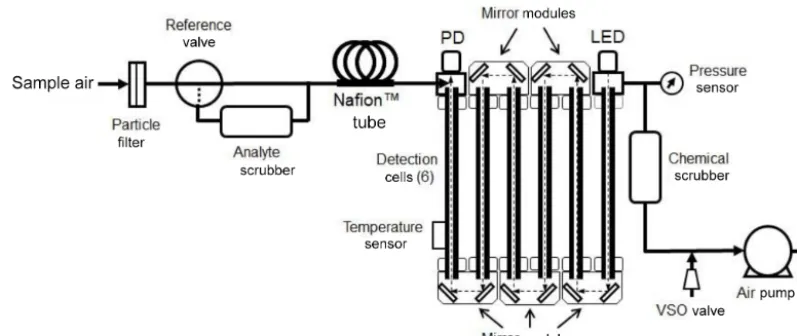
opti-Figure 1.Schematic diagram of a folded tubular photometer for measuring the concentrations of gas-phase species such as O3, NO2, and SO2and particulates such as black carbon, based on the absorbance of UV (O3, SO2), visible (NO2, black carbon), or infrared (black carbon) light.
cal bench (described below). This allows for two complete flushes of the cell volume within the initial 3 s followed by averaging of the light intensity for the final 2 s.
Sample air next passes through one or more parallel tubes composed of Nafion™. Nafion membranes selectively trans-port water molecules across the tube wall and bring the hu-midity inside the tube to approximately the same level as in the surrounding air. Wilson and Birks (2006) first demon-strated for ozone monitors that small changes in humidity during ozone-scrubbed (I) and unscrubbed (Io) measure-ments resulted in light transmission changes through the op-tical cell due to adsorption of differing amounts of water va-por on the cell wall. They further showed that use of a Nafion tube just prior to entering the detection cell eliminated this water vapor interference by equilibrating humidity between theI andIocycles. Although Nafion can be used to dry the sample (e.g., if the surrounding air has been dried), it is only necessary to equilibrate the water vapor level with the sur-rounding air to provide equal humidity during both measure-ment cycles. This has the advantage of not altering the mix-ing ratio of an analyte by removal of atmospheric water va-por. For the examples given here where the typical flow rate is 1.8 L min−1, four 25 cm long, 1.07 mm i.d., 1.35 mm o.d. tubes of Nafion (total of 1 m length) plumbed in parallel were found to effectively remove any interference from rapid changes in relative humidity of sampled air. Use of higher flow rates require proportionally larger internal surface areas (longer Nafion tubes at constant i.d.) to prevent humidity in-terferences. It should be noted that the use of Nafion tubing is not required for particle measurements since the analyte scrubber can be a hydrophobic particle filter of very low sur-face area, which absorbs or desorbs very little water vapor. Also, Nafion tubing may cause losses of particles, thereby biasing measurements.
The air flow next enters the optical bench, which is com-posed of one or more tubular detection cells (six shown in Fig. 1) and an appropriate number of mirror modules (five shown in Fig. 1), each containing two mirrors oriented at 45◦ to the flow path. The mirror modules allow sample air to flow through them and to enter the subsequent detection cell. The mirrors direct the light along the same path as the air flow (in either the same or opposite direction – shown in Fig. 1 as counter to the air flow). The mirrors fold the optical path so as to increase the path length and, thus, the sensitivity of the measurement.
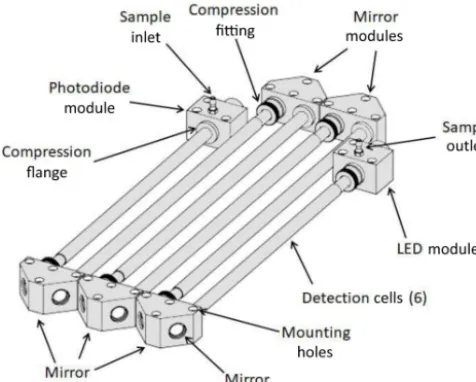
Figure 2.Perspective drawing showing the various modular com-ponents of a folded tubular photometer.
At the end of the optical bench, the light is detected by a photodiode. Typically a large fraction of the light (> 90 %) from the LED source is lost to partial reflection at the cell walls and mirrors, and the fraction of light arriving at the photodiode depends on a number of factors such as the inten-sity and degree of collimation of the light source, reflectivity of the cell walls and mirrors, humidity of the sample, and the pressure inside the detection cell. These losses have no ef-fect on the measurement of the analyte concentration so long as they remain constant during measurements ofIo(analyte scrubbed) andI (analyte present). However, these losses do place a limit on the overall path length that is achievable at a given wavelength.
The concentration of the analyte (typically in units of molec cm−3for gases) is calculated from the Beer–Lambert law (Eq. 1) from the absorption cross section averaged over the bandwidth of the light source; the path length of the light beam, calculated from the dimensions of the optical bench; and the electrical signals (current or voltage) of the photodi-ode, which are proportional to IoandI. SinceIoandI are not measured at exactly the same time (typically 5 s apart), one can average the values ofIomeasured before and after the measurement ofI in order to increase the precision and accuracy of the measurement. Temperature and pressure are measured within the detection cell for the purpose of calcu-lating a mixing ratio of the analyte in typical units of ppm or ppb.
The voltage sensitive orifice (VSO) valve of Fig. 1 serves a particularly important role. It is used to admit air to the flow-ing stream after the optical bench and prior to the air pump. Adding air at this point both reduces the flow rate through the optical bench and increases the average pressure. Because the analyte scrubber is more restrictive than the bypass, the pres-sure within the detection cells is lower when the air is being
drawn through scrubber (Io being measured). To compen-sate, the VSO valve is adjusted in a feedback loop to increase the cell pressure. The VSO valve is adjusted to equalize the pressure of the sample air within the optical bench during I andIomeasurements to within an error of 0.1 mbar. This eliminates a potentially large error resulting from the effect of pressure on the transmission of light through the optical bench, which is discussed in Sect. 3.1 below. The flow rate during theIomeasurement is also reduced, but only by≤5 % and does not significantly impact the degree of cell flushing. Pressure adjustment is made during the first 2 s of the 5 s cy-cle, during which the optical cell is also being flushed. The values ofI andIoare measured in the final 2 s of the corre-sponding 5 s cycles after the pressure adjustment is achieved and the cell has been thoroughly flushed.
2.2 Modular optical bench
A more detailed perspective drawing of the modular opti-cal bench, as used in the work described here, is shown in Fig. 2. Six tubular detection cells and five mirror modules are shown, although other numbers of tubular detection cells and mirror modules could be used. In this example, not all of the detection cells are of the same length, so as to make room on the optical bench for both the LED light source and the photodiode detector. Tubing connections for the air inlet and air outlet are shown. The flow could be reversed with no effect on the analyte measurement. Each mirror module con-tains two mirrors. The optical bench constructed for use in the examples that follow made use of Viton O-rings to seal the two ends of the tubular detection cells to the mirror mod-ules, LED module, and photodiode module. The mirror, light source, and light detector modules are mounted to a vibra-tionally isolated, rigid optical bench. The modular nature of the optical bench allows the path length to be increased or de-creased by adding or removing tubular cells and mirror mod-ules as desired for measurements of analytes in varying ab-sorbance ranges. Also, as shown in Fig. 2, tubular cells may be of different lengths, making a wide range of path lengths possible. The materials used for construction of the detection cells should be inert toward the analyte being measured, with no significant loss of the analyte to exposed surfaces. The ex-amples given below made use of an optical bench constructed of aluminum. To increase transmission of light, the interiors of the cell were polished using either a cylinder hone or a metal bristle brush of the type used to clean gun barrels.
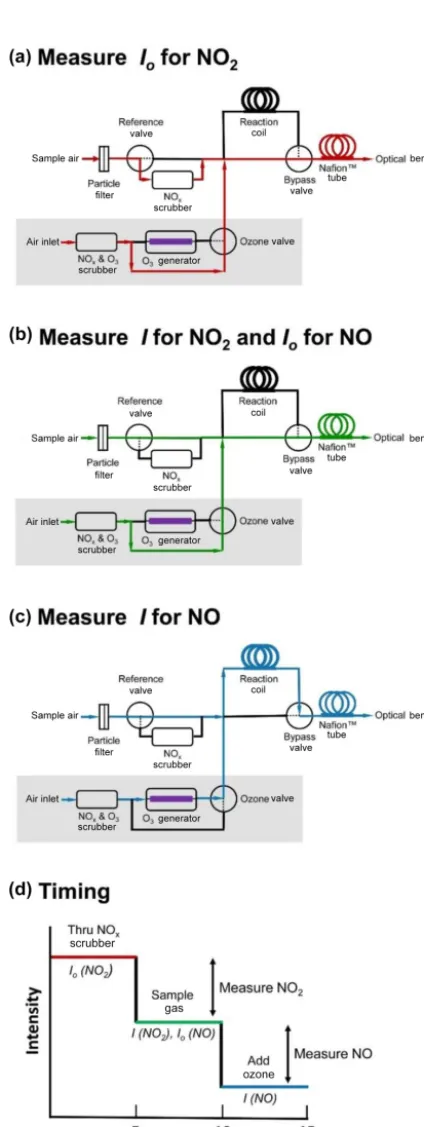
Figure 3.Schematic diagram showing the three-way valve states for measuring(a)Iofor NO2;(b)Ifor NO2andIofor NO; and(c)
Ifor NO. Flow path is shown in red, green, and blue for panels(a), (b), and(c), respectively. Panel(d)depicts an idealized measure-ment sequence corresponding to the three steps shown in panels (a)–(c)and indicates the timing of the three measurement stages.
allows a newI or Io measurement to be made once every 5 s or less, thereby reducing variations in the lamp intensity between measurements. As a result, the precision achieved is higher than is possible in a White or Herriott cell of the same path length.
2.3 Folded tubular photometer for measurements of NO2and NO
Figure 3 is a schematic diagram of the inlet system of a folded tubular photometer designed to measure both NO2 and NO using a LED light source with maximum emission at 405 nm. NO2absorbs at 405 nm with an absorption cross section of∼6×10⁻¹⁹cm2molec−1(Burrows et al., 1998). The 405 nm LED is of low enough power (∼4.3 mW) that photodissociation of NO2 is insignificant (< 1 %, assuming no loss of light in the optical cells and a dissociation quan-tum yield of 0.37 at 405 nm; Burkholder et al., 2015). NO does not absorb at this wavelength but can be quantitatively converted to NO2. The reference NOx scrubber contains a
combination of manganese dioxide to oxidize NO to NO2 followed by activated carbon to remove NO2(∼300 mg of each) The entire scrubber is heated to 110◦C. We have found that NO2is removed quantitatively with this scrubber up to at least 2 ppm. We have also observed no loss in scrubbing ef-ficiency over 24 h periods of exposure to∼300 ppb of NO2, nor during longer-term urban ambient measurements (Allen et al., 2018). The inlet system is the same as in Fig. 1 but with some additions (shown in the gray box) that allow con-version of NO to NO2by the highly selective reaction of NO with O3(Eq. 3). This is accomplished by adding a small flow (< 5 % of total instrument flow) of ozonized ambient air (pro-duced photolytically by a low-pressure mercury discharge lamp) and allowing them to react within a reaction coil dur-ing a third measurement step. The three measurements steps are shown in the panels of Fig. 3. In Fig. 3a (air flow paths shown in red), Io for NO2 is measured as the sample air passes through the NOx scrubber, removing both NO and
NO2. In the shaded gray box, approximately∼70 cm3min−1 of air, scrubbed of both ozone and NOx, bypasses the ozone
generator and is added to the sample air stream. Correction is made in the firmware for dilution of NO2and NO in the air sample by this small flow. The bypass valve then directs the combined flow to bypass the reaction coil, pass through the Nafion humidity equilibrator, and enter the optical bench.
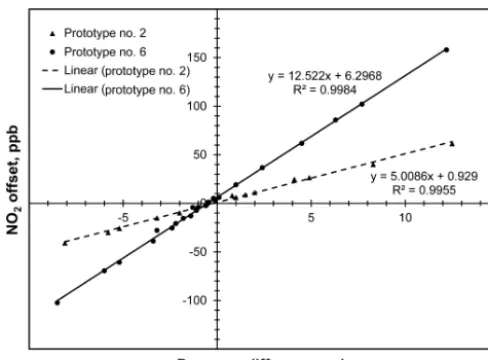
Figure 4. Plot of data obtained for two prototypes of the folded tubular photometer showing the analyzer offset in ppb of NO2 as a function of the measured pressure difference (PI–PI o) between a sample bypassing the NOx scrubber (I ) and a sample passing through the NOxscrubber (Io).
In Fig. 3c (air flow paths shown in blue), the states of both the ozone and bypass valves are changed such that the small flow (∼70 cm3min−1) passes through the pho-tolytic ozone generator, and the ozonized air mixes with the sample air and passes through the reaction coil where NO reacts with ozone to form NO2. The ozone mixing ra-tio in the combined streams (ozonized air mixed with sam-ple air) is typically 8 ppm. Light intensity in the ozone pho-tolysis cell is continuously measured by a photodiode and output in the data stream, and this light intensity value can be used to infer that adequate ozone is present to quantita-tively consume NO. The reaction coil is constructed from a 1 m coiled length of 0.635 cm i.d. PTFE, producing a reaction volume of 31.7 cm3and residence time for a total flow rate of 1.8 L min−1 of 1.06 s. Based on the reaction rate coeffi-cient ofk3=1.9×10⁻¹⁴cm3molec−1s−1at 298 K (Birks et al., 1976; Borders and Birks, 1982; Burkholder et al., 2015) and a total pressure of 1 atm (1013.25 mbar), the reaction is calculated to be 97.6 % complete within the reaction coil. Nearly all of the remaining 2.4 % of NO is converted dur-ing transit through the optical bench. Assumdur-ing pseudo-first-order kinetics, the average amount of converted NO detected within the optical bench and measured is calculated to be 98.8 %. It should also be noted that the combined residence time within both the reaction coil and the detection cells is ∼2.2 s, which allows for a complete flush of the detection volume prior to measuring the light intensity.
The light intensity measured using configuration c serves as the value ofI in the calculation of NO using Eq. (1). For NO measurements, correction for incomplete reaction may be made by dividing by the average of the fraction of NO converted; i.e., 0.988 for the flow conditions described above.
In practice, air standards having known NO and NO2 concen-trations were used to calibrate the outputs of the instrument to correct for incomplete reaction and any other factors af-fecting the sensitivity and offset of the instrument.
To summarize (and shown schematically in Fig. 3d), by continuously cycling between valve states a, b, and c every 5 s, a new value of either NO or NO2may be calculated and updated as follows: (a) a new value ofIo for NO2 is mea-sured, allowing calculation and updating of a new value of NO2 concentration; (b) a new value for bothIfor NO2 and Iofor NO are measured, allowing calculation and updating of new values of NO2and NO; and (c) a new value ofI for NO is measured, allowing calculation and updating of a new value of NO. It should also be noted that if only NO2 mea-surements are desired, step (c) can be omitted (and the small flow that delivers ozone discontinued). Conversely, step (a) can be omitted if only NO measurements are desired.
3 Results and discussion
3.1 Effect of pressure on analyte measurements
A problem we encountered when attempting to use long tubular detection cells, with the light beam either folded using mirrors or unfolded, is that the transmission of light through the cell was found to be pressure dependent. For example, the pressure difference resulting from flowing a sample gas directly into the cell during the measurement ofI vs. flowing through the solid-phase NO2scrubber dur-ing the measurement ofIoat a flow rate of ∼1.8 L min−1 was found typically to be ∼10 mbar. This pressure differ-ence alone causes an unacceptable offset error of typically ∼50 ppb in the measurement of NO2. Although correction can be made for the offset, the offset may change due to vari-ations in the conductance of the scrubber, which varies with environmental factors such as humidity, thereby introducing unacceptable levels of low-frequency noise (drift).
from 5.0 to 12.5 ppb mbar−1, and we found that such slopes vary from instrument to instrument. As discussed below, we believe that this offset is due to changes in the transmission of light through the optical bench with change in pressure, most likely because of the effect of pressure on the refractive index of the sample gas, but possibly due to other factors.
The magnitude of the pressure dependence on light trans-mission is unexpected and not easily explained by any ex-isting theory. For example, it cannot be accounted for by differences in Rayleigh scattering by air molecules at differ-ent densities. The Rayleigh scattering cross section in air is ∼10−27cm2molec−1at 532 nm. For a path length of 210 cm and temperature of 25◦C, a 10 mbar pressure change would cause an extinction change of only∼5×10⁻⁸, nearly 2 or-ders of magnitude below the limit of detection for our ab-sorbance measurements.
The effect is likely due to variations in the propagation of the non-collimated beam of light through the cell by reflec-tion from the cell’s internal surface and/or mirrors used to fold the path. This can cause slight changes in the amount of light reaching and sensed by the detector. Light propa-gation through the optical cell is highly sensitive to subtle changes in both the optical alignment and path length (due to the multiple reflections) and to the refractive indices of the sample gas (which depends on pressure) and the cell wall or mirror surfaces. However, at present it is uncertain which of these effects is responsible for the observed pressure depen-dencies.
The effect of pressure on absorbance measurements was made insignificant by controlling the pressure during mea-surements of Io and I to be identical to within 0.1 mbar, using the VSO valve shown in Fig. 1. This degree of pres-sure control yields offsets in the range 0.5 to 1.25 ppb for the two prototype instruments evaluated for pressure effects. Such small offsets are easily removed by applying an additive offset calibration factor determined while passing the sample air through a zeroing NOxscrubber.
3.2 Analytical figures of merit for NO and NO2
The folded tubular photometer configured for measurements of NO2 and NO (Fig. 3) is now commercially available from 2B Technologies (Boulder, CO) as the model 405 nm NO2/NO/NOxMonitor™. It was externally tested and
ap-proved as a Federal Equivalent Method (FEM) for monitor-ing of the criteria pollutant NO2for compliance with the US Clean Air Act (designated as EQNA-0217-243). During the period 1 April 2016 through 30 November 2017, 206 cal-ibrations were performed on 41 different instruments. Cal-ibration curves were constructed at five concentrations (0, 50, 100, 150, and 200 ppb) for both NO2 and NO. Stan-dard concentrations of NO2 and NO were generated using a Teledyne-API model 700 Dynamic Dilution Calibrator. An internal photolytic ozone source and photometer generates known concentrations of ozone, which react with an excess
of NO supplied by a compressed gas cylinder to produce a stoichiometric increase in NO2 and decrease in NO con-centration, according to Eq. (3) above. The internal ozone photometer is traceable to NIST through a Thermo Electron model 49i-PS Ozone Calibration Primary Standard. Typi-cally, five independent calibrations were carried out for each instrument and linear regressions applied to each calibration curve. The instruments were found to be highly linear over this concentration range with coefficients of determination R2averaging 0.9995 and 0.9993 for NO2 and NO, respec-tively, for the 206 calibrations performed. Although typical calibrations only cover the range of 0–200 ppb for ambient measurements, strict linearity up to 1000 ppb has been ob-served and the linear dynamic range is estimated to extend to 10 000 ppb (10 ppm) for NO2and 2000 ppb (2 ppm) for NO. The dynamic range for NO is limited by the ozone concen-tration (∼8 ppm) used to convert NO to NO2.
Precisions (1σ )obtained in dual mode (both NO2and NO measured) for 5 s measurements were typically in the range 2–3 ppb with an average of 2.3 ppb. When operating in sin-gle mode (only NO or NO2), the response time is 10 s, the time required to obtain a new measurement of bothIandIo. In dual mode, the response time is increased to 15 s (one of the measurement cycles simultaneously providesI for NO2 andIo for NO (Fig. 3), thus shortening the response time from what would otherwise be 20 s). Averaging can be used to trade off response time for improved precision. Ambient air monitors commonly employ a conditional averaging fil-ter for improving the signal-to-noise ratio of this measure-ment. This consists of maintaining both a short-time running average (∼20–30 s) and a long-time running average (∼2– 5 min). When measured concentrations are stable, the long-term average is output; however, when rapid concentration changes occur, the short-term average is output. This type of filtering has the advantage of providing improved preci-sion while maintaining the ability to respond relatively fast to large concentration changes. The averaging times and thresh-old concentration changes of the conditional averaging filter are user selectable in the model 405 nm monitor. For aver-aging times of 3 min, the precisions were found to be inde-pendent of test concentration over the 0–200 ppb calibration range, averaging 0.386 ppb for NO2and 0.381 ppb for NO for the 206 calibrations performed. Other specifications for the model 405 nm NO2/NO/NOx Monitor that include
phys-ical and electrphys-ical parameters like size, weight, and power requirements in addition to figures of merit are provided in Table 1.
3.3 Interferences in the measurement of NO2and NO
Table 1.Analytical and physical specifications, 2B Technologies model 405 nm NO2/NO/NOxfolded tubular photometer.
Linear dynamic range 0–10 000 ppb (0–10 ppm) for NO2; 0–2000 ppb (0–2 ppm) for NO Measurement frequency 0.2 Hz (once every 5 s)
Resolution 0.1 ppb
Accuracy Greater of 2 ppb or 2 % of reading
Precision (1σrms noise) < 0.5 ppb (with conditional averaging filter), < 3 ppb (no conditional averaging filter) Limit of detection (2σ ) < 1 ppb (with conditional averaging filter) Response time 10 s single mode (NO2or NO measured)
15 s dual mode (both NO2and NO measured) 20 s (with conditional averaging filter) Flow rate (nominal) 1.5 L min−1
Operating temperature 10 to 50◦C (FEM approved for 20–30◦C for NO2) Power requirement 11–14 V dc or 120/240 V ac, 1.3 A at 12 V, 16 watt Size Rackmount: 1700w×14.500d×5.500h (43×37×14 cm)
Weight 18.6 lb (8.4 kg)
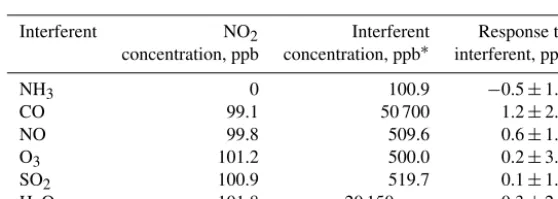
Table 2.Interference test results for FEM certification, 2B Technologies model 405 nm NO2/NO/NOxfolded tubular photometer.
Interferent NO2 Interferent Response to
concentration, ppb concentration, ppb∗ interferent, ppb
NH3 0 100.9 −0.5±1.2
CO 99.1 50 700 1.2±2.3
NO 99.8 509.6 0.6±1.9
O3 101.2 500.0 0.2±3.9
SO2 100.9 519.7 0.1±1.9
H2O 101.8 20 150 ppm 0.3±2.4
∗Units for water vapor are ppm as noted.
ozone monitors) are altered by passing through the scrub-ber. In considering the magnitude of possible interferences, one must consider both the ambient concentration and the absorption cross section (for Eq. 1) of the interfering species as well as whether it is removed or significantly interacts with the scrubber. As part of the requirements for FEM des-ignation, the model 405 nm NO2/NO/NOx Monitor was
tested for interferences from high concentrations of com-mon atmospheric constituents. Carbon com-monoxide, nitric ox-ide, ozone, sulfur dioxox-ide, and water vapor were added in the presence of 100 ppb of NO2. Ammonia was also tested without NO2present. None of these compounds exhibit ab-sorbance at 405 nm, but they can have large enough ambi-ent concambi-entrations to possibly influence light transmission in the detection cells. However, all measured responses were in-significant within statistical error, the highest response being 1.2±2.3 ppb from 50.7 ppm of CO. Increasing the relative humidity from dry (RH < 1 %) to∼20 000 ppm of water va-por (55 % RH at 24.8◦C) gave an insignificant response of 0.3±2.4 ppb. The results of interference testing are summa-rized in Table 2.
NO2 absorption at 405 nm is particularly attractive be-cause there are almost no airborne species that absorb sig-nificantly at this wavelength other than NO2. Aromatic
Figure 5.Absorption spectra of NO2and possible airborne interfer-ences (HONO, NO3, glyoxal, methyl glyoxal) along with the spec-tral output of the LED used in the model 405 nm.
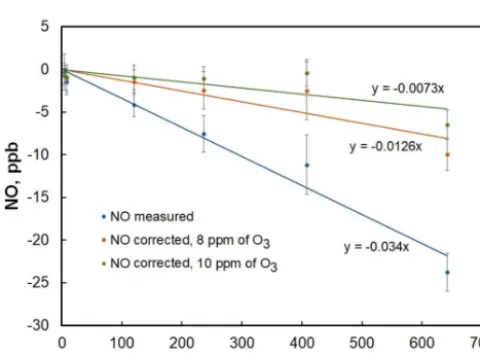
Figure 6.Plot of the NO measured in the folded tubular photometer vs. NO2mixing ratio. The blue line is a linear fit to the data points and yields a slope of−3.4 ppb NO/100 ppb of NO2. Corrected NO concentrations after application of Eq. (6) yield the orange and green points using O3concentrations of 8 and 10 ppm, respectively. Slopes decrease to−1.3 ppb NO/100 ppb of NO2 and−0.7 ppb NO/100 ppb NO2for the 8 and 10 ppm cases, respectively.
observed to be at most a few ppb even in polluted urban at-mospheres (Vrekoussis et al., 2009). At typical concentration levels, interferences from all of these possible NO2 interfer-ences are expected to be negligible at 405 nm.
As mentioned previously, NO is measured by quantita-tively converting it to NO2 by reaction with excess ozone (Eq. 3). Although this is a simple bimolecular reaction with a known NO2yield of unity, subsequent chemistry could affect NO2concentrations within the photometer. Specifically, the large excess of ozone used (∼8 ppm) can also slowly convert
NO2to N2O5via:
NO2+O3→NO3+O2 (4)
NO3+NO2N2O5. (5)
The reaction described by Eq. (4) is ∼600 times slower than Eq. (3) (k4=3.22×10⁻¹⁷cm3molec−1s−1 at 298 K; Burkholder et al., 2015), yet can proceed to a small ex-tent at high NOx levels. At room temperature and NO2
concentrations greater than about 25 ppb, the Eq. (5) equi-librium favors N2O5 formation and proceeds relatively rapidly (k5=1.4×10⁻¹²cm3molec−2s−1; Burkholder et al., 2015), thus removing NO3and resulting in a net loss of two NO2molecules. Loss of NO2within the reaction coil and detection cells due to Eqs. (4) and (5) will result in a slight increase in light transmission, thereby causing an underesti-mate of the NO concentration. Evidence for this chemistry was observed by adding NO2to the analyzer in the absence of NO (Fig. 6). As seen in the figure, measured NO mixing ratios apparently decrease with increasing NO2. The linear fit of the data gives a slope of−3.4 ppb NO/100 ppb of NO2. Assuming that the reaction of NO3with NO2is fast and that the NO+O3reaction goes to near completion before sig-nificant NO2 is lost via Eq. (4) (valid sincek3/k4 ∼600), a simple correction can be derived from assuming pseudo-first-order kinetics, along with an estimate of [O3] from the photolytic generator, measured [NOx], the cell temperature,
and cell flow rate:
[NO]corr=2[NOx]o(1−e−k4[O3]t). (6) Here, [NO]corr is the amount of NO2 that is lost due to Eqs. (4) and (5) and should be added to the measured NO concentration. The residence time (t )in the reaction coil and optical cells is computed from the effective reaction volume (reaction coil volume plus half the optical cell volume) and the measured flow rate;k4is the temperature-dependent rate coefficient of Eq. (4); and the factor of 2 results from the stoichiometry of Eqs. (4) and (5). [O3] has been observed to vary between 8 and 10 ppm for the typical flow rates and photolysis lamp intensities (which are measured) used in the analyzer. [NOx]ois estimated as the sum of the most recently measured NO2concentration and the most recently measured uncorrected NO concentration. Using the uncorrected NO concentration to compute [NOx]odoes cause a slight
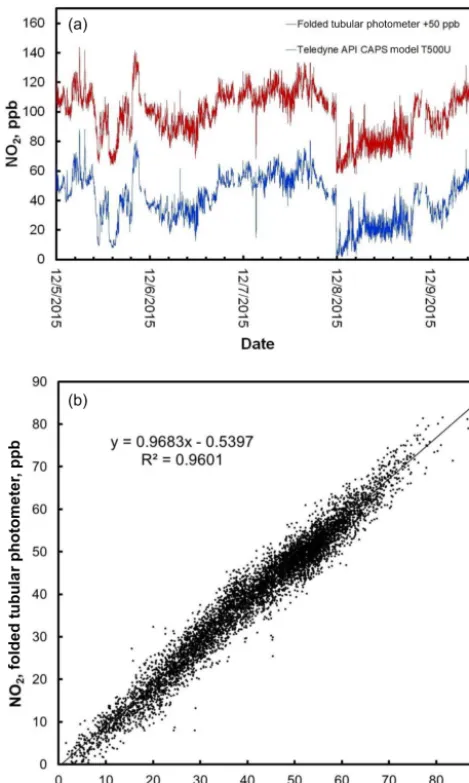
Figure 7. (a) Time series comparison plot of ambient NO2 con-centration measured outdoors at the Colorado Department of Public Health and Environment (CDPHE) Interstate 25/Globeville road-side site using a Teledyne API model T500U (lower data line in blue) and a folded tubular photometer (upper data line in red). Data for the folded tubular photometer are offset for clarity by adding 50 ppb to the measurements.(b)The same data, shown as a corre-lation plot.
than reported or, more likely, a heterogeneous contribution to Eq. (4) on the optical cell walls. For ambient levels of NO and NO2, the measurement error for NO is well within the noise of the instrument after applying this correction in the firmware.
3.4 Roadside measurements of NO2and NO
The folded tubular photometer (model 405 nm) was tested for NO2and NO at a roadside monitoring site operated by the Colorado Department of Public Health and Environment (CDPHE) in the fall of 2015 for 5 days. The monitoring
Figure 8. (a)Time series comparison plot of ambient NO concen-tration measured outdoors at the CDPHE Interstate 25/Globeville roadside site using a Teledyne API model 200E Chemilumines-cence Analyzer (lower data line) and a folded tubular photometer (upper data line). Data for the folded tubular photometer are offset for clarity by adding 400 ppb to the measurements.(b)The same data, shown as a correlation plot. Data shown in the bottom panel include the small correction for N2O5formation as described in the text.
station was located along an entrance ramp at the intersec-tion of Interstate 25 and Interstate 70 just north of downtown Denver (I-25/Globeville site; see https://www.colorado.gov/ airquality for site details; last access: 3 May 2018). Air was sampled through a Teflon inlet line that was located within 1 m of the road at an approximate height of 4 m. Air was drawn into the instrument shelter and sampled into three an-alyzers: (1) the 2B model 405 nm NO2/NO/NOxfolded
tubu-lar photometer, (2) a Teledyne-API model T500U CAPS for NO2. and (3) a Teledyne-API model 200E NO/NOx
reference method) designation and are operated by CDPHE as part of the State of Colorado’s ambient air quality moni-toring network. The model 405 nm folded tubular photome-ter was operated at a flow rate of 1.6 L min−1in both a dual mode for both NO2and NO for the first 4 days and then in a single NO2-only mode for 1 additional day. Unfiltered 5 s data from the model 405 nm were logged and then averaged to 1 min for comparison with the reference analyzers for NO2 and NO.
Figure 7 shows the time series for 1 min averaged mea-surements of NO2for both the model 405 nm folded tubu-lar photometer and the Teledyne-API CAPS. Note that the NO2data for the folded tubular photometer plotted in Fig. 7 are shifted by 50 ppb for comparison purposes. The agree-ment between the two data series is excellent, with both data sets capturing the same sharp changes in concentration due to rapidly changing concentrations in the roadside environment. Also shown is the correlation plot for the data. The linear re-gression line of this plot has a slope of 0.968, an intercept of −0.5 ppb, and a coefficient of correlation (R2) of 0.960.
Figure 8 compares the 1 min averaged measurements of NO mixing ratio using the model 405 nm folded tubular photometer with simultaneous 1 min averaged measurements made by the Teledyne API model 200E Chemiluminescence Analyzer. The method used by this analyzer, detection of chemiluminescence in the reaction of NO with a large excess of ozone (Fontijn et al., 1970), is the most common method used for ambient air measurements of nitric oxide. Data for the folded tubular photometer are shifted in Fig. 8 by addi-tion of 400 ppb for clarity. NO mixing ratios were not ini-tially corrected for N2O5 formation (see Sect. 3.3). Yet the agreement between the two measurement methods is excel-lent even when NO mixing ratios were changing rapidly. The data are also shown as a correlation plot. The linear regres-sion yields a slope of 0.947, an intercept of −0.2 ppb, and a coefficient of correlation (R2) of 0.976. Correction of the data for N2O5formation (Eq. 1) yielded a slope of 0.973 and an intercept of 0.3 ppb (the correlation coefficient remained the same, 0.976), showing the small, but significant, mag-nitude of the N2O5correction over this NOx concentration
range. Note that once corrected, the correlation slope for NO is identical to that of NO2. The slight deviation from unity for these slopes is likely due to differences in calibration fac-tors and possibly due to small timing offsets caused by the slightly different inlet plumbing between the instruments in a roadside sampling environment where concentrations were highly variable and changing rapidly.
4 Conclusions and future directions
We have developed and characterized a new instrumental method, the folded tubular photometer, for measurements of ambient concentrations of both NO2and NO in air. The instrument is commercially available as the model 405 nm
NO2/NO/NOx Monitor (2B Technologies, Inc., Boulder,
CO). A design using a folded tubular optical bench yields long path lengths with low cell volumes, thereby enabling NO2 to be measured directly via optical absorbance at 405 nm. This is sometimes referred to as “true NO2” and is essentially interference-free. The instrument measures NO by conversion to NO2 via the addition of ozone, thus en-abling the full characterization of NOx(NO+NO2) needed for photochemical modeling. The optical bench is modular and can have variable path lengths of up to 2 m or longer. The cell design makes it possible to measure other species that are typically difficult to measure by direct absorption photome-try, such as SO2and black carbon. Pressure equalization dur-ing the various stages of the absorbance measurement cycle is critical to obtaining accurate measurements of the analyte. The most common method to measure NO2has long been reduction to NO, followed by chemiluminescence with ozone (Fontijn et al., 1970). This indirect technique has several dis-advantages. The most common means of NO2reduction in-volves passing the air sample through a heated molybdenum catalyst bed (Winer et al., 1974). However, it has been well established that other nitrogen species in the atmosphere, es-pecially peroxyacetyl nitrates (PANs), N2O5, and nitric acid (HNO3), may be converted as well (Winer et al., 1974; Dun-lea et al., 2007). It is often observed that the conversion ef-ficiency for NO2 is not unity or changes with extended use as required by long-term monitoring. Photolytic reduction of NO2to NO is more selective (Parrish et al., 1990; Parrish and Fehsenfeld, 2000; Buhr, 2007), yet the photolytic conversion is often much less than unity (typically∼50 %). Further-more, a photochemical equilibrium is established within the photoreactor between NO, NO2, and O3resulting in a depen-dency of the conversion efficiency on the ambient concentra-tion of ozone (Parrish et al., 1990). Recent work in extremely polluted environments (tunnels with high vehicle traffic) also shows evidence for undesired photochemistry from hydro-carbons that biases the NO2 measurements (Villena et al., 2012). Furthermore, regardless of the conversion method, the measurement of NO2is indirect, being calculated from the difference between measurements of NOx (NO2+NO) ob-tained by passing through the converter and measurements of NO without passing through the converter.
2013). These systems use a high-finesse optical cavity to re-flect the optical light beam multiple times to generate very long path lengths, thus increasing the sensitivity. The sen-sitivity of these cavity-based techniques is greater than the single-pass folded tubular photometer absorbance analyzer described here and likely more suitable for rural and clean environments; however, these come at higher cost primarily due to the expense of the high-finesse cavities and associated optics. Our intercomparisons of NO2measurements made by the folded tubular photometer and a CAPS NO2 analyzer in a highly trafficked roadside environment showed excel-lent agreement for concentrations up to ∼85 ppb (as large of a range as one would expect for ambient measurements). Thus, the folded tubular photometer can achieve comparable measurement accuracy at concentration levels typical for air quality monitoring at less cost.
Furthermore, manufacturers of the commercially available CRDS and CAPS instruments do not currently offer a con-current measurement of NO. Since NO and NO2are in rapid photochemical equilibrium, measurements of both are re-quired to fully characterize either ambient concentrations or emissions from industrial sources. Certainly both are needed as inputs to regional chemical-transport models that predict air quality. As demonstrated here, the low cell volume al-lows the folded tubular photometer method to convert NO to NO2via addition of ozone, thereby enabling accurate mea-surements of NO in the model 405 nm folded tubular pho-tometer. Even though this measurement of NO is indirect in nature, the conversion efficiency is near unity, and we observed excellent agreement in a roadside intercomparison with the standard NO chemiluminescence technique for con-centrations up to 500 ppb of NO. Slight corrections are nec-essary due to N2O5formation in the photochemical reaction coil, but these are typically small – less than 3 % in the ob-served roadside study – and correctible within the firmware by means of a simple kinetics model.
In summary, compared to other available instruments, the folded tubular photometer method provides a direct, accurate measure of NO2, also measures NO, is less expensive, and is smaller, lighter, and consumes less power, making it an at-tractive alternative for compliance monitoring sites and field measurements of these important atmospheric species. As with absorption photometers for ozone, calibration depends primarily on the known path length and absorption cross sec-tion and does not vary in time. Thus the folded tubular pho-tometer provides the robust, accurate measurement of NO2 and NO that is necessary for long-term compliance monitor-ing.
As suggested in Sect. 1, the folded tubular photometer may be applied to direct measurements of other atmospherically significant species including O3, SO2, and optical extinction of aerosols for characterization of particulates. Sulfur diox-ide has typically been measured by fluorescence (Schwarz et al., 1974). However, absorbance has the advantage of be-ing an absolute method, requirbe-ing only infrequent
calibra-tion. Instruments based on absorbance are typically less ex-pensive to construct than fluorescence-based instruments and require less power because a high-intensity light source is not required. Thus, an instrument based on direct absorbance of SO2 would have advantages over fluorescence, at least in those applications where it provides adequate sensitivity. Ambient ozone also is a significant interference for SO2as it absorbs in the same region as SO2(Keller-Rudek et al., 2013) and is typically present at much higher concentrations. How-ever, direct absorbance measurement of SO2could be use-ful in applications such as smokestack monitoring for SO2 emissions in the combustion of fossil fuels such as coal or natural gas. Here, concentrations are relatively large, ozone is absent, and a more robust instrument requiring little main-tenance and infrequent calibration is desirable.
The folded tubular photometer can also be applied to mea-surements of particulate extinction (defined as the sum of aerosol light absorption and scattering). Large multipass ex-tinction cells have been used (e.g., Schnaiter et al., 2005), but lack the necessary precision due to the inability to flush the large volume cells, as discussed in Sect. 1. Cavity techniques (CRDS and CAPS) have both been applied successfully to particulate extinction (Moosmüller et al., 2005; Massoli et al., 2010), but the highly reflective mirrors required in these cavities only operate over a small range of wavelengths (10– 50 nm) (Zhao et al., 2014; Washenfelder et al., 2013). Thus, they are incapable of measuring across wide spectral ranges (e.g., from UV to the near IR) without the use of multiple cavities, which would add significant cost. Understanding the spectral dependence of particulate extinction is often desired to infer both aerosol size and composition. The mirrors used in the folded-tubular-photometer-based analyzer have ade-quate reflectivity (> 90 %) from 350 to 1000 nm; therefore, multiple wavelengths of light from different LED sources can be combined via dichroic mirrors or by fiber optics and passed through the detection cells.
carbon concentrations in urban areas, free from the artifacts caused by filter collection.
These examples represent a few possibilities for the folded tubular photometer. We have demonstrated its usefulness in the measurements of NO2and NO. For other species it has the potential for providing accurate measurements with a ro-bust technique (akin to the long-standing absorbance method of measuring ozone) that needs infrequent calibration and can be produced at lower cost than existing technologies.
Data availability. Experimental data presented here are available upon request to the authors (johnb@twobtech.com).
Competing interests. Several authors are affiliated with 2B Tech-nologies, Inc., the manufacturer of the folded tubular photometer. John Birks, Peter Andersen, Craig Williford, Andrew Turnipseed, Stanley Strunk and Christine Ennis are employed by 2B Technolo-gies, Inc., the manufacturer of the folded tubular photometer.
Acknowledgements. Air Resource Specialists, Inc. of Fort Collins, Colorado, provided the external testing for EPA Federal Equivalent Method certification.
Edited by: Lisa Whalley
Reviewed by: two anonymous referees
References
Allen, C., Carrico, C., Gomez, S., Andersen, P., Turnipseed, A., Williford, C., Birks, J., Carrion, R., Gates, D., Macias, F., Rahn, T., Aiken, A., and Dubey, M.: NOxInstrument Intercomparison for Laboratory Biomass Burning Source Studies and Urban Am-bient Measurements in Albuquerque, New Mexico, J. Air Waste Manage., in review, 2018.
Arnott, W. P., Hamasha, K., Moosmüller, H., Sheridan, P. J., and Ogren, J. A.: Towards aerosol light-absorption measurements with a 7-wavelength aethalometer: Evaluation with a photoa-coustic instrument and 3-wavelength nephelometer, Aerosol Sci. Tech., 39, 17–29, 2005.
Baumgardner, D., Popovicheva, O., Allan, J., Bernardoni, V., Cao, J., Cavalli, F., Cozic, J., Diapouli, E., Eleftheriadis, K., Gen-berg, P. J., Gonzalez, C., Gysel, M., John, A., Kirchstetter, T. W., Kuhlbusch, T. A. J., Laborde, M., Lack, D., Müller, T., Niessner, R., Petzold, A., Piazzalunga, A., Putaud, J. P., Schwarz, J., Sheridan, P., Subramanian, R., Swietlicki, E., Valli, G., Vecchi, R., and Viana, M.: Soot reference materials for in-strument calibration and intercomparisons: A workshop sum-mary with recommendations, Atmos. Meas. Tech., 5, 1869– 1887, https://doi.org/10.5194/amt-5-1869-2012, 2012.
Beaver, M., Kronmiller, K., Duvall, R., Kaushik, S., Morphy, T., King, P., and Long, R.: Direct and indirect methods for the mea-surement of nitrogen dioxide (NO2), Presented at AWMA Mea-surements Meeting, Sacramento, CA, 20 November 2013.
Bernard, F., Cazaunau, M., Grosselin, B., Zhou, B., Zheng, J., Liang, P., Zhang, Y., Ye, X., Daele, V., Mu, Y., Zhang, R., Chen, J., and Mellouki, A.: Measurements of nitrous acid (HONO) in urban area of Shanghai, China, Environ. Sci. Pollut. Res., 23, 5818–5829, 2016.
Birks, J. W.: Oxidant formation in the troposphere, in: Perspectives in Environmental Chemistry, edited by: Macalady, D. L., Oxford University Press, 233–256, 1998.
Birks, J. W., Shoemaker, B., Leck, T. J., and Hinton, D. M.: Stud-ies of reactions of importance in the stratosphere, I. Reaction of nitric oxide with ozone, J. Chem. Phys., 65, 5181–5185, 1976. Borders, R. A. and Birks, J. W.: High precision measurements of
activation energies over small temperature intervals: Curvature in the Arrhenius plot for the reaction NO+O3→NO2+O2, J. Phys. Chem., 86, 3295–3302, 1982.
Brown, S. S., Dubé, W. P., Osthoff, H. D., Stutz, J., Ryerson, T. B., Wollny, A. G., Brock, C. A., Warneke, C., de Gouw, J. A., Atlas, E. J., Neuman, A., Holloway, J. S., Lerner, B. M., Williams, E. J., Kuster, W. C., Goldan, P. D., Angevine, W. M., Trainer, M., Fehsenfeld, F. C., and Ravishankara, A. R.: Vertical profiles of NO3and N2O5 measured from an aircraft: Results from the NOAA P-3 and surface platforms during the New Eng-land Air Quality Study 2004, J. Geophys. Res., 112, D22304, https://doi.org/10.1029/2007JD008883, 2007.
Buhr, M. P.: Solid-state light source photolytic nitrogen dioxide converter, US Patent US7238328 B2, US Patent and Trademark Office, Washington, DC, USA, 2007.
Burkholder, J. B., Sander, S. P., Abbatt, J., Barker, J. R., Huie, R. E., Kolb, C. E., Kurylo, M. J., Orkin, V. L., Wilmouth, D. M., and Wine, P. H.: Chemical Kinetics and Photochemical Data for Use in Atmospheric Studies, Evaluation No. 18, JPL Publication 15–10, Jet Propulsion Laboratory, Pasadena, 2015.
Burrows, J. P., Dehn, A., Deters, B., Himmelmann, S., Richter, A., Voigt, S., and Orphal, J.: Atmospheric remote-sensing refer-ence data from GOME: Part 1. Temperature-dependent absorp-tion cross-secabsorp-tions of NO2 in the 231–794 nm range, J. Quant. Spectrosc. Ra., 60, 1025–1031, 1998.
Coen, M. C., Weingartner, E., Apituley, A., Ceburnis, D., Fierz-Schmidhauser, R., Flentje, H., Henzing, J. S., Jennings, S. G., Moerman, M., Petzold, A., Schmid, O., and Baltensperger U.: Minimizing light absorption measurement artifacts of the Aethalometer: Evaluation of five correction algorithms, At-mos. Meas. Tech., 3, 457–474, https://doi.org/10.5194/amt-3-457-2010, 2010.
Crosson, E. R.: A cavity ring-down analyzer for measuring atmo-spheric levels of methane, carbon dioxide, and water vapor, Appl. Phys. B, 92, 403–408, 2008.
Drinovec, L., Mocnik, G., Zotter, P., Prevot, A. S. H., Ruck-stuhl, C., Coz, E., Rupakheti, M., Sciare, J., Muller, T., Wieden-sohler, A., and Hansen, A. D. A: The Dual Spot Aethalometer: An improved measurement of aerosol black carbon with real-time loading compensation, Atmos. Meas. Tech., 8, 1965–1979, https://doi.org/10.5194/amt-8-1965-2015, 2015.
chemilu-minescence monitors in a polluted urban environment, Atmos. Chem. Phys., 7, 2691–2704, https://doi.org/10.5194/acp-7-2691-2007, 2007.
Finlayson-Pitts, B. J. and Pitts, J. N.: Chemistry of the Upper and Lower Atmosphere: Theory, Experiments and Applications, Academic Press, San Diego, 2000.
Fontijn, A., Sabadell, A. J., and Ronco, R. J.: Homogenous chemilu-minescent measurement of nitric oxide with ozone, Anal. Chem., 42, 575–579, 1970.
Haagen-Smit, A. J. and Fox, M. M.: Photochemical ozone forma-tion with hydrocarbons and automobile exhaust, J. Air Pollut. Control Assoc., 4, 105–108, 1954.
Hansen, A. D. A., Rosen, H., and Novakov, T.: Real-time measure-ment of the aerosol absorption-coefficient of aerosol particles, Appl. Opt., 21, 3060–3062, 1982.
Herriott, D. and Schulte, H.: Folded optical delay lines, Appl. Opt., 4, 883–889, 1965.
Kebabian, P. L., Herndon, S. C., and Freedman, A.: Detection of nitrogen dioxide by cavity attenuated phase shift spectroscopy, Anal. Chem., 77, 724–728, 2005.
Kebabian, P. L., Wood, E. C., Herndon, S. C., and Freedman, A.: A practical alternative to chemiluminescence-based detection of nitrogen dioxide: Cavity attenuated phase shift spectroscopy, En-viron. Sci. Tech., 42, 6040–6045, 2008.
Keller-Rudek, H., Moortgat, G. K., Sander, R., and Sörensen, R.: The MPI-Mainz UV/VIS spectral atlas of gaseous molecules of atmospheric interest, Earth Syst. Sci. Data, 5, 365–373, https://doi.org/10.5194/essd-5-365-2013, 2013.
Massoli, P., Kebabian, P. L., Onasch, T. B., Hills, F. B., and Freed-man, A.: Aerosol light extinction measurements by Cavity At-tenuated Phase Shift (CAPS) Spectroscopy: Laboratory valida-tion and field deployment of a compact aerosol particle extinc-tion monitor, Aerosol Sci. Technol., 44, 428–435, 2010. Moosmüller, H., Varma, R., and Arnott, W. P.: Cavity ring-down
and cavity-enhanced detection techniques for the measurement of aerosol extinction, Aerosol Sci. Technol., 39, 30–39, 2005. Paldus, B. A. and Kachanov, A. A.: Spectroscopic techniques:
Cavity-enhanced methods, in: Atomic, Molecular, and Optical Physics Handbook, Part C: Molecules, edited by: Drake, G. W. F., Springer, Berlin, 621–640, 2004.
Parrish, D. D. and Fehsenfeld, F. C.: Methods for gas-phase mea-surements of ozone, ozone precursors and aerosol precursors, At-mos. Environ., 34, 1921–1957, 2000.
Parrish, D. D., Hahn, C. H., Fahey, D. W., Williams, E. J., Bollinger, M. J., Hübler, G., Buhr, M. P., Murphy, P. C., Trainer, M., Hsie, E. Y., Liu, S. C., and Fehsenfeld, F. C.: Systematic variations in the concentration of NOx(NO plus NO2) at Niwot Ridge, Colorado, J. Geophys. Res., 95, 1817–1836, 1990.
Platt, U.: Differential optical absorption spectroscopy (DOAS), Chem. Anal. Series, 127, 27–83, 1994.
Schiff, H. I., Karecki, D. R., Harris, G. W., Hastie, E. R., and MacKay, G. I.: A tunable diode laser system for aircraft mea-surements of trace gases, J. Geophys. Res., 95, 147–153, 1990. Schnaiter, M., Schmid, O., Petzold, A., Fritzsche, L., Klein, K. F.,
Andreae, M. O., Helas, G., Thielmann, A., Gimmler, M., Möh-ler, O., Linke, C., and Schurath, U.: Measurement of wavelength-resolved light absorption by aerosols utilizing a UV-VIS extinc-tion cell, Aerosol Sci. Technol., 39, 249–260, 2005.
Schwarz, F. P., Okabe, H., and Whittaker, J. K.: Fluorescence de-tection of sulfur dioxide in air at the parts per billion level, Anal. Chem., 46, 1024–1028, 1974.
Stutz, J., Alicke, B., Ackermann, R., Geyer, A., Wang, S., White, A. B., Williams, E. J., Spicer, C. W., and Fast, D.: Relative humidity dependence of HONO chem-istry in urban areas, J. Geophys. Res., 109, D03307, https://doi.org/10.1029/2003JD004135,2004.
Thornton, J. A., Wooldridge, P. J., and Cohen, R. C.: Atmospheric NO2: In situ laser-induced fluorescence detection at parts per tril-lion mixing ratios, Anal. Chem., 72, 528–539, 2000.
Turnipseed, A. A., Andersen, P. C., Williford, C. J., Ennis, C. A., and Birks, J. W.: Use of a heated graphite scrubber as a means of reducing interferences in UV-absorbance measure-ments of atmospheric ozone, Atmos. Meas. Tech., 10, 2253– 2269, https://doi.org/10.5194/amt-10-2253-2017, 2017. US-EPA: Report to the Congress on Black Carbon, Department of
the Interior, Environment and Related Agencies, 351 pp., 2012. Vandaele, A. C., Simon, P. C., Guilmot, J. M., Carleer, M., and
Colin, R.: SO2absorption cross section measurement in the UV using a Fourier transform spectrometer, J. Geophys. Res., 99, 25599–25605, 1994.
Villena, G. Bejan, I., Kurtenback, R., Wiesen, P., and Kleffmann, J.: Interferences of commercial NO2instruments in the urban atmo-sphere and in a smog chamber, Atmos. Meas. Tech., 5, 149–159, https://doi.org/10.5194/amt-5-149-2012, 2012.
Vrekoussis, M., Wittrock, F., Richter, A., and Burrows, J. P.: Tem-poral and spatial variability of glyoxal as observed from space, Atmos. Chem. Phys., 9, 4485–4504, https://doi.org/10.5194/acp-9-4485-2009, 2009.
Washenfelder, R. A., Flores, J. M., Brock, C. A., Brown, S. S., and Rudich, Y.: Broadband measurements of aerosols extinction in the ultraviolet spectral region, Atmos. Meas. Tech., 6, 861–877, https://doi.org/10.5194/amt-6-861-2013, 2013.
Weingartner, E., Saathoff, H., Schnaiter, M., Streit, N., Bitnar, B., and Baltensperger, U.: Absorption of light by soot parti-cles: Determination of the absorption coefficients by means of aethalometers, J. Aerosol Sci., 34, 1445–1463, 2003.
White, J. U.: Long optical paths of large aperture, J. Opt. Soc. Am., 32, 285–288, 1942.
Wilson, K. L. and Birks, J. W.: Mechanism and elimination of a water vapor interference in the measurement of ozone by UV absorbance, Environ. Sci. Technol., 40, 6361–6367, 2006. Winer, A. M., Peters, J. W., Smith, J. P., and Pitts, J. N.:
Re-sponse of commercial chemiluminescent NO-NO2analyzers to other nitrogen-containing compounds, Environ. Sci. Technol., 8, 1118–1121, 1974.
World Health Organization: Burden of disease from Household Air Pollution for 2012, http://www.who.int/entity/phe/health_topics/ outdoorair/databases/FINAL_HAP_AAP_BoD_24March2014. pdf?ua=\protect\T1\textbraceleft1\protect\T1\textbraceright, last access: December 2017, 2014.