Farm adaptation at the rural-urban interface
Shoshanah M. Inwood
a* and Jill K. Clark
bSubmitted May 22, 2013 / Revised August 2 and September 13, 2013 / Accepted September 13, 2013 / Published online December 11, 2013
Citation: Inwood, S. M., & Clark, J. K. (2013). Farm adaptation at the rural-urban interface. Journal of Agriculture, Food Systems, and Community Development, 4(1), 61–78. http://dx.doi.org/10.5304/jafscd.2013.041.007
Copyright © 2013 by New Leaf Associates, Inc.
Abstract
Despite population growth and development at the rural-urban interface (RUI), agriculture continues to persist there. This resilience is partially a reflection of land use policies and market support programs designed to protect farm and ranch land that is vulnerable to nonfarm development. Studies examining the RUI primarily focus on the diversity of production and markets and do not discuss the diversity of operators. As the farmland protection and food systems movements continue to refine policy objectives and decide how to allocate scarce resources, it is critical to have up-to-date statistics on the health and vitality of agriculture at the RUI. Using the 2007 Census of Agriculture statistics, we examine (1) the spatial distribution by county of high-value production and marketing practices assumed to play a role in the persistence and vitality of agriculture at the RUI; and (2) the demographic characteristics of farmers in these
counties. We find that only some types of high-value production and marketing systems are more prevalent in metropolitan regions, including horses, nursery-greenhouse, and direct sales, while organic production, recreation sales, CSA farms, and value-added farms are more likely to be concentrated in nonmetropolitan counties. We also find that farmers at the RUI are extremely diverse and that a substantial number of beginning and women farmers are found in nonmetropolitan counties, along with a small but notable number of African American, Hispanic and Native American farmers.
Keywords
Census of Agriculture, farm adaptation, farmer diversity, metro counties, rural-urban interface
Introduction
The rural-urban interface (RUI) is the relatively rural space on the edge of urbanized areas (Audirac, 1999); farms and ranches in these geographic areas are highly vulnerable to nonfarm development, yet they continue to thrive and significantly contribute to the U.S. agricultural economy. While RUI counties only represent 20 percent of all U.S. counties, they account for roughly 40 percent of total U.S. agricultural
a* Corresponding author: Shoshanah M. Inwood, Department of
Community Development and Applied Economics, 208H Morrill Hall, The University of Vermont, Burlington, Vermont 05401 USA; +1-802-656-0257; Shoshanah.Inwood@uvm.edu
b John Glenn School of Public Affairs, Ohio State University,
production (Jackson-Smith & Sharp, 2008),1 and produce the majority of the nation’s fruits, vegetables, and nursery and greenhouse crops (American Farmland Trust [AFT], 2013; Jackson-Smith & Sharp, 2008). Since the 1970s the RUI has often been the focus of local, state and national debates over disappearing farmland, a shrinking farm population, land use policy, and local and regional food systems.
Starting in the 1970s, the U.S. Department of Agriculture’s Economic Research Service (ERS) published a series of reports and research studies documenting the complexity of agriculture at the RUI and the significant contributions metro farmers make to U.S. agricultural production. These research papers and reports examined farm size and type and ownership patterns, and aimed to understand the ways in which metro farmers have been able to persist and adapt to nonfarm
development pressures (Heimlich & Brooks, 1989; Heimlich & Anderson, 2001). Recognizing the importance and vulnerability of RUI agriculture, farm advocacy organizations, researchers, and policy-makers used these reports to develop a variety of land-based and market-based strategies designed to support farmers at the RUI (AFT, 1997; Bryant & Johnston, 1992). Today, farmland preservation and efforts to promote local and regional food systems as a viable economic liveli-hood for farmers (e.g., through on-farm value-added strategies, promoting higher intensity production, etc.) have become mainstream; these efforts are no longer limited to community- or state-level campaigns but are now a part of federal farm policy (AFT, 2013; Clancy & Ruff, 2010; Lyson, 2004; Oberholtzer , Clancy, & Esseks, 2012).
As the farmland protection and food systems movements continue to refine policy objectives and decide how to allocate scarce resources, it is
1 Sharp and Jackson-Smith (2008) represent RUI counties as “counties with Urban Influence Codes (UIC) 1 through 4 (or 1,267 counties total), as well the a small number of counties in UIC categories 5–7 that experienced population growth above the national average of 13.15 percent between 1990-2000 (255 counties fall into this category). UIC codes are developed by the USDA-ERS and can be accessed online at http://www. ers.usda.gov/Briefing/Rurality/urbaninf/” (p. 10).
critical that they have the latest statistics on the health and vitality of RUI agriculture. While there have been recent reports examining more macro-level statistics that assess the overall production levels of RUI agriculture (Esseks, Oberholtzer, Clancy, Lapping, & Zurbrugg, 2009; Oberholtzer et al., 2012; Jackson-Smith & Sharp , 2008), there has been little documentation of the specific produc-tion and marketing adaptaproduc-tions scholars identified as important for RUI policy and economic invest-ment. For example, Hart (1998) and Heimlich and Anderson (2001) identified and argued that higher-value crops that can be intensively produced on smaller acreages, such as fruit and vegetables, are more likely to persist at the RUI and contribute to the viability and resiliency of agriculture at the RUI (Hart, 1998; Heimlich & Anderson, 2001). How-ever, these statistics have not been updated or examined to understand changes in RUI agricul-tural production patterns.
ethnicity, gender, and experience to farm structure and farm persistence.
Therefore, this paper answers two basic questions: (1) What is the spatial distribution of production and marketing practices assumed to play a role in the persistence and vitality of agri-culture at the RUI? and (2) who are the farmers in these counties? We first review the literature examining agriculture at the RUI and farmer diversity, and then present the results of a descriptive analysis of high-value production and marketing systems using 2007 U.S. Census of Agriculture data.
Literature Review
Located beyond suburbia, the RUI is a mix of both rural and urban land uses and is socially and economically connected to an urban core (Audirac, 1999; Clark, McChesney, Munroe, & Irwin, 2009). The RUI is a complex landscape and is affected by a variety of processes, including both global agri-food systems pressures and stresses from local nonfarm urban-related development. At the local level, direct influences from land competition and rising nonfarm population, and indirect influences such as rising land rents, taxes, and increased regu-lation create increased constraints on farming (Bryant & Johnston, 1992; Fulton, Pendall, Nguyen, & Harrison, 2001; Heimlich & Anderson, 2001). Yet agricultural production at the RUI is substantial; RUI counties account for 78 percent of vegetable production and 91 percent of fruit pro-duction in the U.S. (AFT, 2013; Jackson-Smith & Sharp, 2008).
An important theme implicit in many RUI models is the expectation that urban-oriented food and fiber production adaptation strategies (nursery and greenhouse, direct sales, horses, farmers’ markets, CSAs, U-pick operations, agri-tourism, organic agriculture, etc.)are likely to emerge and succeed due to their proximity to urban markets (Bowler, 1999; Fennell & Weaver, 1997; Heimlich & Anderson, 2001; Lyson 2004). Heimlich and Brooks (1989) found a relationship between farm type and persistence at the RUI and identify three types of RUI farms, including (a) alternative enterprises (small in size with high-value outputs); (b) recreational enterprises (very small scale,
operated by hobby farmers); and (c) traditional enterprises (large operations engaged in conven-tional commodity production). Research focusing on these various types of enterprises suggests that smaller-scale farms with higher-value outputs are the most likely to persist in metropolitan counties (Heimlich & Anderson, 2001; Hoppe & Korb, 2001).Alternative enterprise types can include consumer-oriented, entrepreneurial activities with an emphasis on direct marketing and value-adding. While there in fact has been a rise in the number of farms oriented toward local and alternative markets (Barbieri & Mahoney, 2009; Inwood & Sharp, 2012; Sparks, 2012), there has been little recent analysis to understand the spatial distribution of different types of specific urban oriented produc-tion and marketing systems across the RUI, particularly in agriculturally vibrant areas.
Farmer Diversity at the RUI
The structure of the farm business is not just a result of market and economic forces, but is shaped through the goals, values, and motivations of the farm family. These goals, values, and moti-vations are influenced by the demographic char-acteristics of the farm family (Colman & Elbert, 1984; Gasson, 1973; Gasson & Errington, 1993; Lobley & Potter, 2004; Salamon, 1992; Shucksmith & Herrmann, 2002). The associations among gender, ethnicity, culture, length of time farming, farm structure, and development have been well documented in the literature (Imbruce, 2007; Sachs, 1996; Salamon, 1992; Wells & Gradwell, 2001.
percent from 2002 to 2007 (USDA, NASS, 2007a). The role of gender and sex and RUI farm develop-ment is particularly interesting. There was a 30 percent increase in female principle operators from 2002 to 2007 (NASS 2007a); however, a spatial analysis reveals that 31 percent of all metro area farms (using the 2008 U.S. Census metropolitan statistical area [MSA] definition) have female operators, compared to the national average of 14 percent of all farm operators. This increasing diversity of Hispanic, Asian, Native American, African American, beginning and women farmers reinforces the need to understand how social differences between farmers can influence farm structure at the RUI.
Ethnicity and Race
The association between ethnicity, culture, farm structure, and development was well documented by Salamon (1992), who identified a typology of Midwestern farmer types based on farm household ethnicities and their distinct agricultural or land ethics. Wells (1996) also has shown the linkage between ethnicity and farming subsystems in California strawberry production, finding that Japanese, Mexican and Anglo growers brought different sets of resources to their farms’ develop-ment, and that the different social networks asso-ciated with each ethnic group created and rein-forced farm management styles over time. Recent research on immigrant farmers from Southeast Asia in the Miami Metro region found that the unique motivations, social networks, and style of farming (intensive and diverse) has enabled these small family farms to thrive by taking advantage of niche markets and national distribution networks despite high land rents (Imbruce, 2007). The increase in the number of Hispanic, Asian, Native American and African American farmers (USDA, NASS, 2007a) reinforces the need to understand how cultural nuances influence larger production patterns on the RUI landscape.
Gender and Sex
There has been considerable interest in under-standing the gendered dimension of farm adapta-tion and producadapta-tion strategies particularly as it relates to alternative agriculture (Chiappe & Flora,
1998; Feldman & Welsh, 1995; Sachs, 1996; Wells and Gradwell, 2001). Surveys of the wider female farm population have found women emphasize not only the environmental and economic benefits of sustainable agriculture, but are also more likely to emphasize the link between agriculture and com-munity sustainability and well-being (Chiappe & Flora, 1998; Feldman & Welsh, 1995; Trauger, 2004; Trauger, Sachs, Barbercheck, Kiernan, Brasier, & Findeis, 2008). Some of these gendered values have been correlated with specific farm structures, including the prevalence of, and prefer-ence for, cooperative farm markets, direct market-ing, value-addmarket-ing, and craft development among women operators as opposed to large-scale com-modity agriculture activities. These trends are reinforced by McNally (2001), who found that when women participated in the active manage-ment of the farm operation, the probability of observing on-farm retailing and recreation enterprises increased by 12 percent.
The research examining gender, race, and ethnicity in relationship to farm structure reveal that each farmer subgroup has a unique history and cultural legacy that influence their goals, motiva-tions, and values, which in turn influence the way they structure their farm and envision their farms’ future. These studies demonstrate that the struc-ture of a farm business (wholesale, direct market-ing, organic, etc.) is not just the result of economic forces, but also reflects specific values and goals of the farm family. As farm, food, and land policies incorporate the social differences of farmers, it is useful to understand how different subpopulations of farmers are spatially distributed across the RUI and non-RUI landscape.
Methods
& Sarzynski, 2005). To capture meaningful produc-tion at the RUI, counties were then classified as agriculturally important (AI) or non-agriculturally important (NAI), using an approach akin to the parameters described by Jackson-Smith and Jensen (2009). AI counties are in the top three quartiles of U.S. agricultural sales in 2007 and exhibit a healthy agricultural sector. Agricultural sales for NAI counties ranged from US$0 to US$19,379,000 in 2007. AI county sales in 2007 ranged from US$19,386,000 to US$3,730,546,000. As an indicator, AI uses the market value of agricultural product sold and the intensity of production measured via sales per acre of total farmland and cropland. Compared to the ERS farm-dependent county classification, the AI indicator is better able to pick up more intensive uses of farmland and agricultural output regardless of whether a county is large or small, or urban or rural, or if the regional economy is highly specialized or diversified
(Jackson-Smith & Jensen, 2009).
We then classified counties as Metro-AI, Metro-NAI, Nonmetro-AI, or Nonmetro-NAI to achieve a more refined analysis for examining spatial distributions of specific production prac-tices. We recognize classifying counties as AI or NAI introduces bias into the analysis, as a larger number of sales will automatically come from AI counties. While this bias does exist, the results are not necessarily predetermined. In fact, this classification brings forward subtle nuances that would have been overlooked if the analysis only focused on Metro versus Nonmetro.
The number of farms and sales values for horses, nursery and greenhouse, recreational services, organic agriculture, direct marketing, CSAs, and value-added productionwere obtained for each county (n=3080) in the U.S. from the 2007 U.S. Census of Agriculture. Descriptive statistics (totals and
per-centages) were run to examine the distribution of these variables be-tween the different county types. Due to the relatively small number of farms engaging in some of these activities,
sales data was suppressed for some counties. In this paper suppressed sales are treated as missing. Initial analysis revealed the significance of Califor-nia in organic production and direct sales. To bet-ter understand the spatial distribution of organic agriculture and direct sales, California was treated separately in the analysis in some cases. Finally, to understand if there is a spatial dimension to the increasing diversity of American farmers, we exam-ined farmer demographics including race, sex, and beginning farmers. Finally, mapping the variables with GIS illustrates the regional patterns of the statistical findings.
Results
The majority of U.S. counties are Nonmetro counties (65.2 percent) and are non-agriculturally important (73.5 percent) (table 1). Comparatively, Metro counties account for 34.8 percent of all counties, while agriculturally important (AI) counties represent only 26.5 percent of all counties. Table 2 presents the distribution of counties, farm and sales by Metro-AI status and demonstrates the significance of Metro-AI agriculture compared to Nonmetro-AI, Metro-NAI, and Nonmetro-NAI. Figure 1 illustrates the spatial distribution of these counties. Nonmetro-AI counties make up the
Table 2. Percent of Counties, Farms and Sales by Metro and Agriculturally Importance (AI) or Non-agriculturally Important (NAI) Status, 2007
Metro-AI Nonmetro-AI Metro-NAI Nonmetro-NAI Total
Counties 25.0% 48.5% 9.8% 16.7% 100%
Farms 35.8% 50.8% 5.1% 8.3% 100%
Sales 38.1% 59.7% 0.8% 1.4% 100%
Table 1. Frequency and Percent of Metro and Agriculturally Important (AI) Counties, 2007
Counties Frequency Percent
Metro 1,071 34.8%
Nonmetro 2,009 65.2%
Total 3,080 100%
AI 2,263 73.5%
Non-AI 817 26.5%
largest share of counties (48.5 percent), sales (59.7 percent) and farms (50.8 percent). While Metro-AI counties only represent 25 percent of all counties, they account for 38.1 percent of all U.S. sales and 35.8 percent of U.S. farms; these sig-nificant contribu-tions to the U.S. agricultural eco-nomy reinforce the need to understand the
nuances of RUI agriculture.
Horse Sales, Nursery and Greenhouse,
and Recreation Sales
Horses, nursery and greenhouse products, and farm and ranch–based recreation are specific products and services that have been assumed and promoted to do well in areas proximate to urban populations. Horses are not considered a food or fiber commodity, and the
degree to which horses should be formally counted in the agricultural sector has been debated. Nationally the horse industry directly contributes US$39 billion into the U.S. economy through feed crops, bedding, breeding, sales, racing, recreation, tourism, and shows (American Horse Council, 2005; Whiting, McCall, & Molnar , 2005). This analysis found that horse sales are concentrated in metropolitan counties and
AI counties (table 3). Metro counties account for 82.6 percent of horse sales, compared to only 17.4 percent of sales occurring in Nonmetro counties (figure 2). The vast majority of these sales, 78.5 percent, occur in Metro-AI counties, compared to 14.6 percent in Nonmetro-AI counties. Regionally, the top 10 counties for horse sales are clustered in Kentucky — a state synonymous with horses — and counties such as Marion, Florida, where the
Table 3. Top 10 Horse Counties by Sales, 2007
County Type* County Farms Sales (US$)
Metro-AI Fayette, Kentucky 249 $409,617,000
Metro-AI Woodford, Kentucky 190 $212,610,000
Metro-AI Marion, Florida 847 $128,244,000
Metro-AI Bourbon, Kentucky 177 $120,779,000
Metro-AI Jessamine, Kentucky 81 $96,208,000
Metro-AI Scott , Kentucky 136 $45,553,000
Metro-AI Monmouth, New Jersey 154 $17,257,000
Metro-AI Chester, Pennsylvania 206 $12,953,000
Metro-AI Fauquier, Virginia 146 $10,641,000
Metro-AI San Diego, California 258 $9,609,000
* AI = Agriculturally Important county
town of Ocala is one of the major thoroughbred industry centers (table 3). The emergence of regional horse industries at the RUI demonstrates how an agricultural sector can be tightly tied to the larger regional economy.
Nursery and greenhouse operations are defined as production sites that are protected
under glass or other types of material, and sell terrestrial and aquatic plants, trees, shrubs, bulbs, tubers, seeds, fruits, berries, herbs, trees, starts, sod, etc. As relatively small acreage operations with high value outputs, nursery and greenhouse opera-tions appear to be ideally suited for the RUI. These operations serve the high demand for landscaping
shrubs, trees, ornamental flow-ers, and vegetable starts coming from proximate suburban and urban markets. The 2007 Cen-sus of Agriculture counted 54,889 nursery and greenhouse operations accounting for US$16.6 billion in agricultural sales (USDA, NASS, 2007b). California alone accounts for 25 percent of nursery and green-house sales.
To understand California’s impact, the analysis was run both with and without Califor-nia. In each case nursery and greenhouse sales are predomi-nantly concentrated in Metro and AI counties. Without
Table 4. Top 10 Nursery and Greenhouse Counties by Sales Without California, 2007
County Type* County
Nursery and Greenhouse
Farms
Nursery and Greenhouse Sales
(US$)
Metro-AI Miami-Dade, Florida 838 $493,710,000
Metro-AI Chester, Pennsylvania 186 $402,195,000
Metro-AI Marion, Oregon 365 $243,693,000
Metro-AI Orange, Florida 261 $237,605,000
Metro-AI Clackamas, Oregon 638 $227,114,000
Metro-AI Washington, Oregon 293 $199,317,000
Metro-AI Palm Beach, Florida 425 $185,151,000
Metro-AI Suffolk, New York 254 $182,901,000
Metro-AI Maricopa, Arizona 112 $168,405,000
Metro-AI Lake, Florida 246 $141,702,000
* AI = Agriculturally Important county
78.5%
36.7%
76.0%
14.6%
40.2%
18.4%
4.1% 6.6% 4.4%
2.8%
16.5%
1.2% 0.0%
10.0% 20.0% 30.0% 40.0% 50.0% 60.0% 70.0% 80.0% 90.0%
Horse Sales Tourism and Recreation Nursery Sales w/o CA
Metro-AI NonMetro-AI Metro-NAI NonMetro-NAI
California, over three-quarters (76 percent) of nursery and green-house sales occur in Metro counties; the value increases to 84.7 percent when California is included, compared to only 18.4 percent in Nonmetro counties (figure 2). Just over 94 percent of nursery and greenhouse sales are concentrated in AI counties. With and without California, all of the top 10 counties for nursery and greenhouse sales are Metro-AI. With California, five of the top 10 are California counties. The pre-dominance of California, Florida,
and Oregon counties reflects the important role climate plays in production location (table 4). The more moderate and longer growing season in these regional production centers have led to extensive national and regional distribution networks that supply local nursery and greenhouse operations across the country.
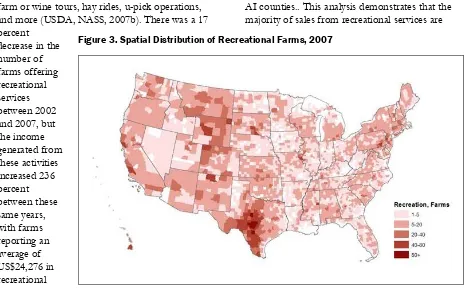
The Census of Agriculture definition of recrea-tional services is extremely expansive, as it includes income from services such as hunting, fishing, farm or wine tours, hay rides, u-pick operations, and more (USDA, NASS, 2007b). There was a 17 percent
decrease in the number of farms offering recreational services between 2002 and 2007, but the income generated from these activities increased 236 percent between these same years, with farms reporting an average of US$24,276 in recreational
sales (USDA, NASS, 2007b). Within the local food system and farm-to-school movements there has been a great deal of attention directed toward agri-tainment (on-farm tours, education, and
recreation).
In this analysis, income from recreational services is concentrated in Nonmetro and AI counties. Over half of recreational sales (56.7 percent) are from Nonmetro counties (figure 2). Overall 76.9 percent of recreational sales are from AI counties.. This analysis demonstrates that the majority of sales from recreational services are
Table 5. Top 10 Recreation Counties by Sales, 2007
County Type* County Farms Sales (US$)
Metro-NAI Maui, Hawaii 30 $8,464,000
Metro-NAI Colfax, New Mexico 29 $6,929,000
Nonmetro-NAI Honolulu, Hawaii 24 $6,647,000
Nonmetro-NAI Webb, Texas 57 $5,896,000
Metro-NAI Yates, New York 17 $5,727,000
Metro-NAI Fremont, Wyoming 41 $5,616,000
Metro-NAI Moffat, Colorado 62 $4,494,000
Metro-NAI Routt, Colorado 29 $3,770,000
Metro-NAI Zavala, Texas 45 $3,156,000
Nonmetro-AI Kendall, Texas 73 $3,117,000
* NAI = Non-agriculturally Important county; AI = Agriculturally Important county
coming from more remote counties. This reflects the more traditional forms of outdoor recreation farms and ranches can offer, including hunting, fishing, birding, and horseback riding. The top 10 counties for recreational sales are an eclectic mix and mirror high-amenity landscapes such as those found in Hawaii, New Mexico, and the Finger Lakes region of New York state. The predomi-nance of counties located in Texas, Wyoming, and Colorado reflect the historical recreation opportu-nities farms and ranches offer in the West (table 5 and figure 3).
Organic and Direct Sales
In the U.S. the upward trend of organic sales and direct marketing has continued to increase. The USDA 2008 Organic Production Survey (an adden-dum to the Census of Agriculture) counted 14,540 organic farms and ranches in the U.S. representing 4.1 million acres or 1.7 million hectares of land (USDA, NASS, 2008). Organic farmers (certified
and exempt organic farms) reported US$3.16 bil-lion in total sales, with US$1.94 bilbil-lion in crop sales and US$1.22 billion in livestock, poultry, and their products (USDA, NASS, 2008). The economic contribution of organic agriculture is significant to U.S. farm households as organic farms reported higher average annual sales (US$217,675) com-pared to the overall national average (US$134,807) (USDA, NASS, 2008).
In regard to direct sales, 136,9817 farms reported selling agricultural products directly for human consumption in 2007, representing a 17.2 percent increase from 2002 (USDA, NASS, 2008). Nationally, farmers reported US$1.21 billion dol-lars in direct sales, accounting for 0.4 percent of total U.S. sales (USDA, NASS, 2008). The vast majority of farms reporting direct sales (93.3 per-cent) were small family farms (whose total sales are less than US$250,000) (USDA, NASS, 2008). Taken together, California, New York, and Penn-sylvania account for over a quarter (26.1 percent)
of all direct sales (USDA, NASS, 2008). Given the dis-proportionate influence of California, with just under half (45.5 percent) of all certified organic production and 14.2 percent of direct sales in the U.S. coming from the state, we included and excluded Califor-nia in the tallies to see if there were any major differences.
Organic Sales
When California is included in the analysis, the majority of organic sales are a Metro and
Table 6. Organic and Direct Sales by County Type With and Without California, 2007
Metro-AI Nonmetro-AI Metro-NAI Nonmetro-NAI Total
Organic Sales 67.2% 30.6% 0.4% 1.8% 100%
Organic Sales Without California 47.1% 48.9% 0.8% 3.2% 100%
Direct Sales 60.9% 28.5% 5.7% 4.9% 100%
Direct Sales without California 55.3% 32.4% 6.6% 5.6% 100%
* NAI = Non-agriculturally Important county; AI = Agriculturally Important county
Table 7. Top 10 Counties with Organic Sales Excluding California, 2007
Type County Farms Sales (US$)
Metro-AI Maricopa, AZ 24 $24,193,000
Metro-AI Benton, WA 36 $24,004,000
Nonmetro-AI Grant, WA 37 $23,062,000
Metro-AI Chelan, WA 46 $19,670,000
Nonmetro-AI Klamath, OR 42 $18,696,000
Metro-AI Chester, PA 38 $18,306,000
Metro-AI Yuma, AZ 10 $15,208,000
Metro-AI Yamhill, Oregon 72 $13,909,000
Metro-AI Yakima, Washington 95 $13,237,000
Metro-AI Lancaster, Pennsylvania 98 $11,687,000
AI phenomena, with the vast majority of sales (67.2 percent) concentrated in Metro-AI counties (table 6). When California is exclu-ded from the analysis, organic production is still predominantly concentrated in AI counties (96 per-cent); however, it is no longer primarily located in metro-politan counties. Without California, organic production is fairly evenly split
between Metro (47.1 percent) and Nonmetro (48.9 percent) counties. The fact that Nonmetro and AI counties stand out as sites of substantial organic production (controlling for the role of California) supports the industrialization-of-organics argument where existing commodity systems are shifting into organic production (Guthman, 2004). Regionally, the top 10 counties by sales and farms are dominated by California. Excluding California, the top counties reflect a greater geographical diversity that corresponds to the particular organic commodity, such as organic grain production in eastern Washington and dairy and vegetable production in Arizona (table 7). In addition to the presence of organic commodity production, the high number of organic farms in the Northeast (figure 4) may be reflecting a variety of factors, including the large demand for organic products in the region, the significant role organic price premiums have in supporting dairy farms in the Northeast (Parsons, 2011), and the strength of the Northeast Organic Food and Farming
Association, which over the years has become one of the major stakeholder and technical-assistance nonprofit organizations in the region.
Direct Sales
Both including and excluding California, direct sales occur more frequently in Metro and AI counties. Including California, only one-third (33.5 percent) of direct sales are from Nonmetro counties, while 66.5 percent are concentrated in metro regions; these numbers change only modestly when excluding California. Direct sales are also primarily being generated in AI counties (89.4 percent including California and 87.8 percent excluding California). It is interesting to note that, excluding California, NAI counties account for 12.2 percent of direct sales; when including Cali-fornia, the amount drops negligibly. California counties represented five of the top 10 farms with direct sales. When California is removed from the analysis, direct sales tend to be most common in Metro-AI East coast counties with the exception of Addison, Vermont (Nonmetro-AI), a highly pro-ductive agricultural region in Vermont, a state with a highly developed community-based food and agriculture system (see table 8 and figure 5). Nationally, the Northeast has been a leader in developing farmland protection policy and innovative buy local marketing campaigns. These results demonstrate the nuance of how a state like
California, with such an intensive production system, can mask other regional patterns and obscure how land use policies and marketing programs can support farmers in especially tight land markets, like those found in the Northeast.
CSA and Value-Added
Farms
The number of community supported agriculture (CSA) operations has
continued to increase. The 2007 Census of Agri-culture counted 12,549 farms selling their products through CSAs (USDA, NASS, 2007b). The census only records number of CSA farms; it does not record sales data. In this analysis the majority of CSA farms were in Nonmetro counties and in AI counties. There were slightly more CSA farms in Nonmetro-AI counties (43.8%) compared to Metro-AI (41.6%) (table 9). Less than 15 percent of all CSA farms were located in Non-AI counties with slightly more in Nonmetro-NAI (8.4%) compared to
Metro-NAI (6.2%). While the overall pattern re-veals there are more CSA farms in Nonmetro counties, the top 10 counties with CSA farms are predomi-nantly found in Metro counties, particularly in California and in the North-east, the
exception being Hawaii County (table 10). The USDA defines value-added products as including items such as beef jerky, fruit jams, and floral arrangements (USDA, NASS, 2007b). Value-adding has been promoted as an important way farms can capture additional dollars. Parallel to data collected on CSAs, the census of agriculture only reports the number of farms selling value- added products and no sales data. In 2007 there were 78,419 farms selling value-added products (NASS, 2007b). Parallel to the patterns observed
Table 8. Top 10 Counties with Direct Sales, Excluding California, 2007
AI Status County Farms Sales (US$)
Metro-AI Jackson, Oregon 344 $13,920,000
Metro-AI Worcester, Massachusetts 338 $10,871,000
Metro-AI Hartford, Connecticut 196 $9,333,000
Metro-AI Lancaster, Pennsylvania 753 $9,220,000
Metro-AI Suffolk, New York 111 $9,053,000
Metro-AI Berrien, Michigan 226 $8,492,000
Metro-AI Middlesex, Massachusetts 191 $6,510,000
Nonmetro-AI Addison, Vermont 145 $5,434,000
Metro-AI Orange, New York 94 $5,424,000
Metro-AI Lane, Oregon 620 $5,103,000
* AI = Agriculturally Important county
for CSA farms, value-added farms tend to be found in Nonmetro counties. While the majority of value-added farms are in AI counties, there are a greater number of farms in Nonmetro-AI regions (46.2%) compared to Metro-AI counties (38.3%) (table 9). Again, 15 percent of value-added farms are found in Non-AI counties, with a slight majority in Nonmetro-NAI (9.3%) compared to Metro-NAI (6.2%). The top 10 counties with value-added farms are in largely Metro-AI counties, with a large number in Oregon reflecting the investment in the processing associated with the berry, wine, cheese, and turf-grass industries in the state (table 11).
Farmer Demographics
Each subgroup of farmers has a unique historical and cultural heritage. Recognizing these differences is important for understanding how different types of farmers are able to access information,
resources, and land, all of which in turn influence farm structure and farm viability.
As expected, the majority of all farmers are located in AI counties. However, a closer look reveals the nuances in the geographic distribution of different populations of farmers. The majority of Asian farmers (60.3 percent) and farmers of Spanish, Hispanic, or Latino origin (51 percent) are located in Metro-AI counties (table 12). Just under half of African American/Black farmers (46.5 per-cent) are located in Nonmetro-AI counties and 33.7 percent are in Metro-AI counties. Though not a majority, it is interesting to note that a substantial portion of Hispanic farmers (14.1 percent) and African American farmers (12.5 percent) are farm-ing in Nonmetro-NAI counties. Nearly half of all operators reporting more than one race (49.3 per-cent) are farming in Nonmetro-AI counties, and 36.2 percent are farming in Metro-AI counties. Over one-third of women operators (38 percent)
Table 9. CSA and Value-Added Farms by County Type, 2007
Metro-AI Nonmetro-AI Metro-NAI Nonmetro-NAI Total
CSA Farms 41.6% 43.8% 6.2% 8.4% 100%
Value-Added Farms 38.3% 46.2% 6.2% 9.3% 100%
* NAI = Non-agriculturally Important county; AI = Agriculturally Important county
Table 10. Top 10 Counties with CSA Farms, 2007
County AI Status Number of Farms
San Diego, California Metro-AI 79
Tulare, California Metro-AI 61
Fresno, California Metro-AI 59
San Luis Obispo,
California Metro-AI 54
Ventura, California Metro-AI 52
Hawaii, Hawaii Nonmetro-AI 48
Middlesex,
Massachusetts Metro-AI 48
Lancaster, Pennsylvania Metro-AI 47
Sonoma, California Metro-AI 44
Franklin, Massachusetts Metro-AI 43
* AI = Agriculturally Important county
Table 11. Top 10 Counties with Value-Added Farms, 2007
County AI Status Number of Farms
Hawaii, Hawaii Nonmetro-AI 266
Clackamas, Oregon Metro-AI 257
Lancaster,
Pennsylvania Metro-AI 256
Lane, Oregon Metro-AI 229
Yamhill, Oregon Metro-AI 184
Jackson, Oregon Metro-AI 183
Weld, Colorado Metro-AI 179
Marion, Oregon Metro-AI 167
Douglas, Oregon Nonmetro-AI 166
Sonoma, California Metro-AI 164
and beginning farmers (37.5 percent) are located in Metro-AI counties.
Spatially, African American farmers are con-centrated in the Southeastern U.S. along the Black Belt, a term that refers to the portion of the deep South that was once characterized by planation agriculture in the 19th century, and where today African American communities are dispropor-tionally affected by acute poverty (figure 6). In contrast, Hispanic farmers are concentrated in the Southwest and in Florida where the majority of the Hispanics in the U.S. live (U.S. Census, 2013 (figure 7), while the spatial distribution of women
and beginning farmers is fairly even across the U.S. The U.S. Census of Agriculture recognizes two groups of native peoples, Native Americans (including Native Alaskans when reported) and Native Hawaiians or Other Pacific Islander. Both groups have a history of protracted land disputes with the U.S. government. Native American farmers are much more likely to be producing in Nonmetro-AI counties (44 percent) than in Metro-AI counties (23.9 percent), while a quarter (25.2 percent) of Native American farmers are located in Nonmetro-NAI counties. This finding most likely reflects the location of Native American
reserva-tions, which have historically been on marginalized lands. Over half of Native Hawaiian farmers (57.7 percent) are located in Nonmetro-AI counties and 36 percent are in Metro-AI counties. This finding most likely reflects the displacement of Native Hawaiians off the island of Oahu (the major metro island in Hawaii) as lands were lost through legal land contracts
Table 12. Farmer Demographics by County Type, 2007
Operator Metro-AI Nonmetro-AI Metro-NAI Nonmetro-NAI Total
Asian 60.3% 34.2% 3.1% 2.4% 100%
Hispanic 51.0% 30.9% 4.0% 14.1% 100%
African American 33.7% 46.5% 7.3% 12.5% 100%
Native American 23.9% 44.0% 6.8% 25.2% 100%
Native-Hawaiian 36.0% 57.7% 2.7% 3.6% 100%
More Than One Race 36.2% 49.3% 5.4% 9.1% 100%
Woman 38.0% 47.6% 5.7% 8.7% 100%
Beginning Farmer (less than 10 years) 37.5% 48.3% 5.5% 8.7% 100%
* NAI = Non-agriculturally Important county; AI = Agriculturally Important county
rather than forced dis-placement through mili-tary action (Levy, 1975).
Discussion This paper provides an updated analysis of metropolitan agriculture by (1) examining whether the production and market-ing strategies anticipated to succeed at
the RUI are in fact concentrated at the RUI; (2) refining the analysis to account for the degree to which Metro and Nonmetro counties are agricul-turally important (or not agriculagricul-turally important); and (3) including an analysis of the distribution of producer demographics.
We find that despite the threats from nonfarm development, farming at the RUI continues to sig-nificantly contribute to the U.S. agricultural econo-my. The persistence of agriculture at the RUI is a reflection of community and government efforts, land use policies, marketing programs, and deci-sions and adaptations made by individual farm families. Due to the design of the analysis, a greater number of sales were concentrated in AI counties compared to NAI counties. However, not all types of high-value production and marketing systems assumed to dominate in metropolitan regions were found in Metro-AI counties as one would expect. Horses, nursery and greenhouse, and direct sales were more prevalent in Metro regions, while organic production, recreation sales, CSA farms, and value-added farms were more likely to be con-centrated in Nonmetro counties.
The analysis demonstrated that certain types of high-value production systems that directly feed into consumer needs and interests, such as horses
and nursery and greenhouse, do in fact thrive at the RUI. However, the spatial concentration of these sectors in the RUI is also partially a reflection of their connection to larger regional economies. In the case of horses, the counties with the highest horse sales are also major horse-breeding and horse-racing centers. Parallel to horses, nursery and greenhouse production predominates in areas with a milder climate and longer growing season that supply other nurseries across the country that are in cooler climates with shorter growing seasons.
The vast majority of direct sales are in Metro-AI counties. When California is taken out of the analysis, the high number of counties with direct sales in the Northeast demonstrates the role that investments in community-based local food and regional food systems can have. A substantial number of direct sales are in Nonmetro-AI areas, and a small, but present, number are in NAI counties. This finding may reflect the challenge of disaggregating the different types of direct sales the census of agriculture captures under this one variable (Lev & Gwin, 2010). Lev and Gwin (2010) note that livestock farmers are the majority of direct marketers (58 percent), but only account for 31 percent of direct marketing sales. Following up on Lev and Gwin’s (2010) recommendations, as
federal policy focuses increasingly on local food systems, it important to evaluate whether more refined data points are needed in order to more accurately measure different types of direct marketing.
Additionally, this analysis examined how a state like California, which produces a large volume of high-value crops and has a significant number of RUI counties, can obscure other regional produc-tion patterns. Accounting for the effect of Califor-nia enables RUI researchers to develop a more nuanced policy analysis when examining produc-tion and marketing patterns across the country.
While farms just outside cities may be increas-ing the number of recreational opportunities they offer through agri-tainment initiatives, this analysis revealed that the bulk of recreational sales are coming from counties that have other outdoor recreation activities and scenic amenities, particu-larly in the West. Future research should examine how recreational sales play into multifunctional agricultural initiatives particularly at the RUI.
Organic products command a higher premium price. In this analysis organic sales were more con-centrated in Nonmetro (taking out California) and AI counties, most likely reflecting the shift of commodity sectors into organic production. This follows the findings of the 2008 USDA Organic Production Survey, which found that 83 percent of organic sales are to wholesale markets (processors, millers, packers, distributors, wholesalers, brokers or repackers), while 10.6 percent are to to-retail and only 6.8 percent of sales are from direct-to-customer exchanges (farm stands, u-pick, farmers’ markets and CSAs) (USDA, NASS, 2008). Organic agriculture is important for soil health and ecosystem services, and can significantly contribute to farmer income and farm viability, particularly by adding value to commodity crops. However, organic as a production method itself may not be directly contributing to the economic vitality of RUI agriculture compared to broader local and regional food system development initiatives.
The RUI is a highly heterogeneous place, both in terms of production and farmer demographics. Currently the majority of RUI policies, programs, and campaigns focus on land policy and market diversity, and do not recognize social differences
among farmers. Nor do these efforts recognize how cultural and historical legacies may enhance or complicate many of the initiatives directed towards agriculture at the RUI. As new policies and pro-grams are developed to support different types of farmers, it is important to reflect on how the objec-tives and intended people-based outcomes match up to where the targeted farmers are located. This analysis demonstrated that farmers at the RUI are extremely diverse. However, it also found there are a substantial number of beginning and women farmers in Nonmetro-AI counties, and a small but notable number of African American, Hispanic and Native American farmers in Nonmetro-NAI counties. These findings reinforce the need for policy-makers and NGOs to analyze how specific initiatives will affect different types of farmers in different locations.
Conclusion
The now mainstream interest in economic devel-opment through food and agriculture and in local and regional food systems has brought a new focus to both the significance of agricultural at the RUI and to the need for additional investment in these regions. Policy-making is often about resource distribution, and given the limited financial resources available, farm advocacy organizations, researchers, and policy- and grant-makers need baseline data to inform their priorities. This paper informs these debates by documenting current production and marketing systems assumed to thrive in agriculturally important RUI counties. We find that urban and consumer-oriented production and marketing systems are not just metro phenom-ena, but in fact are more prevalent in nonmetro-politan regions as in the case of organic agriculture and recreational sales. These findings, in combina-tion with the regional distribucombina-tion of nursery and greenhouse and horse sales, demonstrate that policy-makers need to take regional economies, climate, and distribution networks into account when establishing investment priorities. Future research should expand these initial observations to more closely examine the regional dimension to these production and marketing systems.
— an issue that has largely been overlooked by RUI scholars. Producers at the RUI are highly diverse, but regional differences do exist. There is a rich tradition in rural studies documenting the extent to which gender, sex, culture, and ethnicity play a role in farmer decision-making and farm structure. This analysis provides initial data on operator demographics at the RUI; additional research is needed to explore the intersection between operators’ social and cultural factors and farm persistence and growth at the RUI. The degree to which investments made in production and marketing systems at the RUI are successful is tempered by the extent to which we recognize and incorporate the unique history and technical assis-tance needs of different types of operators. The next generation of RUI policy and research should build on its historic focus of land use and markets to now include people.
Acknowledgements
The authors thank Dr. Jeff Sharp and Dr. Douglas Jackson-Smith for their support and encourage-ment. The authors thank the two anonymous reviewers and the journal editor for their extremely constructive and insightful comments.
References
American Farmland Trust [AFT]. (1997). Saving American farmland: What works. Madison, Wisconsin: The University of Wisconsin.
AFT. (2013). Threatened farmland:What’s happening to our farmland? Retrieved March 2013 from
http://www.farmland.org/resources/fote/ default.asp
American Horse Council. (2005). National economic impact of the U.S. horse industry. American Horse Council. Retrieved from http://www.horsecouncil.org/ national-economic-impact-us-horse-industry Audirac, I. (1999). Unsettled views about the fringe:
Rural-urban or urban-rural frontiers. In O. Furuseth and M. Lapping (Eds.), Contested Countryside: The Rural Urban Fringe in North America
(pp. 7-32). Brookfield, VT: Ashgate Publishing. Barbieri, C., & Mahoney, E. (2009). Why is
diversification an attractive farm adjustment strategy? Insights from Texas farmers and ranchers. Journal of Rural Studies, 25(1), 58–66.
http://dx.doi.org/10.1016/j.jrurstud.2008.06.001 Berube, A., & Forman, B. (2002). Living on the edge:
Decentralization within cities in the 1990s [The Living Cities Census Series]. Washington, D.C.: Center on Urban & Metropolitan Policy, The Brookings Institution. Retrieved from
http://www.brookings.edu/research/reports/2002 /10/demographics
Bowler, I. (1999). Modelling farm diversification in regions using expert and decision support systems.
Journal of Rural Studies, 15(3), 297–305.
http://dx.doi.org/10.1016/S0743-0167(98)00064-3 Bryant, C. R., & Johnston, T. R. R. (1992). Agriculture in
the city’s countryside. Toronto: University of Toronto Press.
Chiappe, M. B., & Flora, C. B. (1998). Gendered elements of the alternative agriculture paradigm.
Rural Sociology. 63(3), 372–393. http://dx.doi.org/ 10.1111/j.1549-0831.1998.tb00684.x
Clancy, K., & Ruhf, K. (2010). Is local enough? Some arguments for regional food systems. Choices: The Magazine of Food, Farm & Resource Issues, 25, 1.
http://www.choicesmagazine.org/
Clark, J. K., McChesney, R., Munroe, D. K., & Irwin, E. G. (2009). Spatial characteristics of exurban settlement pattern in the U.S. Landscape and Urban Planning, 90(3–4), 178–188. http://dx.doi.org/ 10.1016/j.landurbplan.2008.11.002
Colman, G., & Elbert, S. (1984). Farming families: The farm needs everyone. Research in Rural Sociology and Development, 1, 61–78.
Esseks, D., Oberholtzer, L., Clancy, K., Lapping, M., & Zurbrugg, A. (2009). Sustaining agriculture in
urbanizing counties: Insights from 15 coordinated case studies [Final Report].Lincoln, Nebraska: University of Nebraska Lincoln.
Feldman, S., & Welsh, R. (1995). Feminist knowledge claims, local knowledge, and gender divisions of agricultural labor: Constructing a successor science.
Rural Sociology, 60(1), 23–43. http://dx.doi.org/ 10.1111/j.1549-0831.1995.tb00561.x
Fennell, D. A., & Weaver, D. B. (1997). Vacation farms and ecotourism in Saskatchewan, Canada. Journal of Rural Studies, 13(4), 467–475.
http://dx.doi.org/10.1016/S0743-0167(97)00032-6 Fulton, W., Pendall, R., Nguyen, M., & Harrison, A.
Gasson, R. (1973). Goals and values of farmers. Journal of Agricultural Economics, 24(3), 521–542.
http://dx.doi.org/10.1111/j.1477-9552.1973.tb00952.x
Gasson, R., & Errington, A. (1993). The farm family business. Wallingford, Oxon, UK: CAB International.
Guthman, J. (2004). Agrarian dreams: The paradox of organic farming in California. Berkeley, California: University of California Press.
Hardesty, S. D. (2010). Do government policies grow local food? Choices: The Magazine of Food, Farm & Resource Issues, 25, 1.
http://www.choicesmagazine.org/ Hart, J. F. (1998). The rural landscape. Baltimore,
Maryland: The Johns Hopkins University Press. Heimlich, R. E. (1989). Metropolitan agriculture:
Farming in the city’s shadow. Journal of the American Planning Association, 55(4), 457–466.
http://dx.doi.org/10.1080/01944368908975434 Heimlich, R. E., & Anderson, W. D. (2001). Development
at the urban fringe and beyond: Impacts on agriculture and rural land [Agricultural Economic Report No. AER-803]. Washington, D.C.: USDA, Economic Research Service.
http://www.ers.usda.gov/publications.aspx Heimlich, R. E., & Brooks, D. H. (1989). Metropolitan
growth and agriculture: Farming in the city’s shadow [Agricultural Economic Report No. AER-619]. Washington, D.C.: USDA Economic Research Service.
http://www.ers.usda.gov/publications.aspx Hoppe, R. A., & Korb, P. (2001, August). Farm
operations facing development: Results from the Census Longitudinal File. Paper presented at the annual meeting of the American Agricultural Economics Association, Chicago, Illinois. Imbruce, V. (2007). Bringing Southeast Asia to the
Southeast United States: New forms of alternative agriculture in Homestead, Florida. Agriculture and Human Values, 24(1), 41–59.
http://dx.doi.org/10.1007/s10460-006-9034-0 Inwood, S., Clark, J. K., & Bean, M. (2013). The
differing values of multigeneration and first-generation farmers: Their influence on the structure of agriculture at the rural-urban interface. Rural Sociology, 78(3), 346–370.
http://dx.doi.org/10.1111/ruso.12012
Inwood, S. M., & Sharp, J. S. (2012). Farm persistence and adaptation at the rural-urban interface: Succession and farm adjustment. Rural Studies, 28(1), 107–117.
http://dx.doi.org/10.1016/j.jrurstud.2011.07.005 Jackson-Smith, D. B., & Jensen, E. (2009). The
unimportance of dependence: Comparing indicators of farming dependence and agricultural importance. Rural Sociology, 74(1), 37–55.
http://dx.doi.org/10.1526/003601109787524016 Jackson-Smith, D., & Sharp, J. (2008). Farming in the
urban shadow: Supporting agriculture at the rural-urban interface. Rural Realities, 12(4), 1–12. Lev, L., & Gwin, L. (2010). Filling in the gaps: Eight
things to recognize about farm-direct marketing.
Choices: The Magazine of Food, Farm & Resource Issues, 25(1). http://www.choicesmagazine.org/magazine/ article.php?article=110
Levy, N. M. (1975). Native Hawaiian land rights.
California Law Review,63(4), 848–885.
http://dx.doi.org/10.2307/3479836
Lobley, M., & Potter, C. (2004). Agricultural change and restructuring: Recent evidence from a survey of agricultural households in England. Journal of Rural Studies, 20(4), 499–510.
http://dx.doi.org/10.1016/j.jrurstud.2004.07.001 Lyson, T. A. (2004). Civic agriculture: Reconnecting farm, food
and community. Medford, Massachusetts: Tufts University Press.
McNally, S. (2001). Farm diversification in England and Wales — What can we learn from the farm business survey? Journal of Rural Studies,17(2), 247– 257.
http://dx.doi.org/10.1016/S0743-0167(00)00050-4
Oberholtzer, L., Clancy, K., & Esseks, J. D. (2010). The future of farming on the urban edge: Insights from fifteen U.S. counties about farmland protection and farm viability. Journal of Agriculture, Food Systems, and Community Development, 1(2), 59–75.
http://dx.doi.org/10.5304/jafscd.2010.012.003 Parsons, B. (2011). Vermont’s dairy sector: Is there a
sustainable future for the 800 lb. gorilla? Food System Research Collaborative, Opportunities for Agriculture Working Paper Series, 1(4).
Sachs, S. (1996). Gendered fields: Rural women, agriculture and environment. Boulder, Colorado: Westview Press. Salamon, S. (1992). Prairie patrimony: Family, farming, and
Shucksmith, M., & Herrmann, V. (2002). Future changes in British agriculture: Projecting divergent farm household behaviour. Journal of Agricultural Economics, 53(1), 37–50. http://dx.doi.org/10.1111/ j.1477-9552.2002.tb00004.x
Sparks, G. (2012). USDA directory records more than 7,800 farmers markets [Press release No. 0262.12]. Washington, D.C.: USDA Agricultural Marketing Service.Retrieved fromhttp://www.usda.gov/ wps/portal/usda/usdamediafb?contentid=2012/08 /0262.xml&printable=true&contentidonly=true Trauger, A. (2004). ‘Because they can do the work’:
Women farmers and sustainable
agriculture in Pennsylvania, USA. Gender, Place and Culture, 11,(2), 289–307.
http://dx.doi.org/10.1080/0966369042000218491 Trauger, A., Sachs, C., Barbercheck, M., Kiernan, N. E.,
Brasier, K., & Findeis, J. (2008).
Agricultural education: Gender identity and knowledge exchange. Journal of Rural Studies, 24(4), 432–439.
http://dx.doi.org/10.1016/j.jrurstud.2008.03.007 U.S. Census Bureau. (2013). Distribution of Hispanic or
Latino population by specific origin: 2010. Washington, D.C.: Author. Retrieved from http://www.census. gov/dataviz/visualizations/072/
U.S. Department of Agriculture, National Agricultural Statistics Service [USDA, NASS]. (2007a). 2007 Census of Agriculture: Demographics [Fact Sheet].
Washington, D.C.: Author. Retrieved from
http://www.agcensus.usda.gov
USDA, NASS. (2007b). 2007 Census of Agriculture: Agricultural diversification [Fact sheet]. Washington, D.C.: Author. Retrieved from
http://www.agcensus.usda.gov
USDA, NASS. (2008). 2007 Census of Agriculture: 2008 Organic Production Survey [Fact sheet].
Washington, D.C.: Author. http://www.agcensus. usda.gov/Publications/2007/Online_Highlights/ Fact_Sheets/Practices/organics.pdf
Wells, B. K., & Gradwell, S. (2001). Gender and resource management: Community supported agriculture as caring-practice. Agriculture and Human Values,18(1),107-119.
http://dx.doi.org/10.1023/A:1007686617087 Whiting, K. A., McCall, C. A., & Molnar, J. J. (2005,
August). What equine-based activities, organizations, and facilities mean for rural development. Paper presented at the annual meeting of the Rural Sociological Society, Tampa, Florida.
Wolman, H., Galster, G., Hanson, R., Ratcliffe, M., Furdell, K., & Sarzynski, A. (2005). The
fundamental challenge in measuring sprawl: Which land should be considered? The Professional