Abstract
Between 2009/2010 and 2014/2015 a total of 711 destructive paired samples of total dry matter yield (kg DM/ha) and lucerne height were taken from a grazed dryland lucerne monoculture experiment at Ashley Dene, Canterbury, New Zealand. These were used to develop relationships suitable for on-farm estimates of lucerne. For pre-graze yields, the variation accounted for increased from 59%, based on lucerne height alone, to 84% for the 14 Year/Season combinations. For post-grazing residual DM yields, inclusion of Year as a factor increased the R2 from 0.39 to 0.65. Pre-graze data were also grouped into spring, summer and autumn. These relationships accounted for 54-60% of the observed variation in dryland lucerne. In spring the multiplier was ~95 kg DM/cm and this dropped to ~75 kg DM/ cm for heights measured in the summer. In autumn the multiplier was ~55 kg DM/cm. Lack of stability in the relationships over time could reflect environmental conditions and changes in stand density which height measurements alone cannot account for.
Keywords: alfalfa, dry matter yield estimates, height, Medicago sativa L., regression analysis
Introduction
Rapid non-destructive measurement techniques for dry matter (DM) yield determination reduces costs compared with time consuming destructive determinations. However, these need to be accurate to ensure animals are neither under nor overfed when used for feed budgeting. A range of non-destructive methods have been assessed. These include visual observation, pasture height, pasture capacitance meters, rising plate meters, canopy/ground cover, board height and remote sensing technologies (Earle & McGowan 1979; Griggs & Stringer 1988; Litherland et al. 2008; Michalk & Herbert 1977; Mundava et al. 2015; Piggot 1988).
The majority of pastoral calibration research has used grass-based pastures for dairy systems. In most cases, calibration equations change throughout the growing season and these were reported to explain 25-80% of the observed variation (Litherland et al. 2008; López Díaz & González-Rodríguez 2003; Webby & Pengelly 1986). In the USA, Sanderson et al. (2001) reported that calibrations supplied by manufacturers of capacitance meters, rising plate meters and a pasture
Relationships between dry matter yield and height of rotationally
grazed dryland lucerne
A.M. MILLS, M.C. SMITH and D.J. MOOT Field Research Centre, Lincoln University, Lincoln 7647, New Zealand Derrick.Moot@lincoln.ac.nz
ruler underestimated yields by 43 to 74%. The amount of variation accounted for by these methods was also low (11 to 31%). Error levels were 26-33% which was more than the 10% level of error deemed acceptable for on-farm use (Rayburn & Rayburn 1998). Economically, a 10% level of error or less was considered necessary to justify the time and labour associated with collecting data for feed budgeting purposes.
Griggs & Stringer (1988) found lucerne calibrations based on stem height resulted in slopes and intercepts which differed for growth periods and years. Calibration relationships were unaffected by cultivar in most analyses. They identified calibrations would be necessary for individual growth periods to create reliable relationships.
A further complication is protocols (Cayley & Bird 1996) for non-destructive measurements on non-grass swards are rarely outlined. The use of a method which removes some factors associated with the “operator error” would seem helpful. It is also important to note that the end use of the data must be taken into account when selecting a rapid determination method. Where yield alone is the required information, non-destructive methods will save time and the method used could be based on the level of accuracy required. However, if further derived data are required from pastures, such as nutritive data, the protocol required for yield alone may not be suited to some rapid evaluation methods.
Regardless of method 1) any calibration will only be as accurate as the data used to create it; 2) calibrations are rarely stable and differ from year to year, site to site, season to season and between plant species. Factors which cause the calibrations to change include: a) variation between observer/operator associated with subjective decisions during sampling, subconscious bias, and technique; b) differences in seasonal growth patterns of pasture components; c) pasture composition; d) impact of water stress or changes in developmental state of the pasture; e) stand density (Earle & McGowan 1979; López Díaz & González-Rodríguez 2003; Sanderson et al. 2001).
This paper describes calibrations between dry matter (DM) yield and height for lucerne monocultures from a dryland, summer dry grazing experiment conducted at Ashley Dene, Canterbury (43o65’ S, 172o32 E, 35 m a.s.l.) from 2009/2010 to 2014/2015. Relationships were created to estimate paddock yields from destructive
paired quadrat samples of lucerne height and yield. A “bulk” seasonal approach adequate for on-farm use is also included, recognising validation of such estimates is required.
Materials and methods
A 4.2 ha farmlet study was established in November 2008. Lucerne was inoculated before sowing at a bare seed equivalent rate of 10 kg/ha. Across the experimental area the soils were classified as Lowcliffe moderately deep and Lowcliffe stony soils (McLenaghen & Webb 2012).
Two adjacent grazing areas (farmlets) were established in one block. The rotationally grazed farmlet had six 0.4 ha paddocks (89 x 49 m). Within each of these “grazing” paddocks there were four replicates of seven lucerne cultivars (‘Kaituna’, ‘Stamina 5’, ‘Stamina 6GT’, AgResearch grazing tolerant breeding line (AgR GT), AgResearch high preference breeding line (AgR HP), ‘Runner II’ and ‘Rhino’) sown in 28 individual cultivar plots (6.3 x 24.5 m). In an adjacent area within the same paddock, three cultivars (‘Stamina 5’, ‘Stamina 6GT’ and ‘Runner II’) were established in each of four 0.43 ha replicate paddocks. These were set stocked (SS) or semi set stocked (Semi SS) in the spring lactation phase. For both experimental areas, cultivar subplots were grazed in common within a “grazing” paddock. The experiment terminated at weaning in mid-November 2014.
Grazing management
The spring season is defined as July-November, summer December to February and autumn includes all grazing events from March-June. Lucerne was grazed with sheep provided from the Ashley Dene flocks as outlined by Moot et al. (2016).
For lucerne under SS or Semi SS management in the spring lactation phase the four paddocks were halved to created eight 0.21 ha subplots. This created four replicate subplots which could be grazed by four replicate sheep mobs per treatment. For the Semi SS grazing treatment these 0.21 ha subplots were halved again to create four replicates of 2 x 0.11 ha paddocks where livestock grazed for 10 days and were then shifted to the other half of the paddock for 10 days to create a 10 day regrowth before re-entry. After weaning the fences between the SS and Semi SS areas were removed and the area was rotationally grazed in a four paddock rotation to generate a “Recovery” phase (Moot et al. 2003).
Measurements
Environmental data
Rainfall and temperature data were collected from an on-farm weather station, located ~0.5 km from the experimental area. The long-term mean (LTM;
1980-2009) annual rainfall was 604 mm/yr at the nearby Burnham Sewage treatment plant (~5 km NE of the experiment). Over the duration of the experiment annual rainfall ranged from 582 mm in 2010/2011 to 830 mm 2012/2013. Monthly rainfall varied from 5.2 mm (May 2015) to 224 mm (June 2013). Mean air temperature followed the expected seasonal patterns.
Calibration development
Most destructive yield and composition data measurements used to create the calibration relationship were taken from within the rotationally grazed treatment area. A calibration was created from paired measurements of DM yield determined destructively from 0.2 m2 quadrats cut to ground level. Height (cm) was measured from the average height of the tallest lucerne stems within a 15 cm radius from the height stick. The criterion was to locate areas in the sward of contrasting lucerne height (high, medium and low) in each of the selected plots. Between one and five quadrats were taken from an individual plot. Various cultivar, plot, and grazing management combinations were sampled at different times over the course of the experiment.
Statistical analysis
Description of the dataset
A total of 711 paired data points were collected between spring 2009 and summer 2015. Of these 468 were collected from the rotationally grazed pastures before grazing. A further 101 samples were used to create a post-graze calibration. Of the remaining 142 samples some were from the SS and Semi SS grazing areas. Almost half of the samples were collected from the ‘Stamina 6GT’-based plots because they were common to the three grazing treatments.
Description of the process to generate calibration relationships
To evaluate the effect of the main factors on the total DM yield versus lucerne height relationship, an all subsets regression was performed in Genstat (VSN International Ltd v16.1). Forced terms were a) the constant, to identify whether intercepts were similar or different to zero, and b) lucerne height (cm). Free terms included: Season (spring, summer and autumn); cultivar; year and spring grazing management strategy (rotational, SS or Semi SS).
spring and summer calibrations because relationships differed between the grazing treatments. By autumn, the height versus DM relationship was consistent across grazing treatments, probably because all plots were being rotationally grazed.
After identifying the model most appropriate to describe the dataset, for simplicity and ease of presentation, while allowing cultivar and grazing management to be defined, linear regressions were fitted individually to each of the 14 groups. Where the intercept was shown to be similar to zero the regression was forced through the origin. This was possible in 8 of 14 cases. In the six cases where the intercepts differed from zero it was necessary to add an initial phase from 0 cm to the minimum lucerne height contributing to the regression. This prevented the calculation of a) yield <0 where y intercept values were negative and b) the calculation of positive yield values at 0 cm heights where the y intercept value was positive. This accounted for paddock height data that fell outside the range of the calibration for any specified period.
Results and Discussion
Pre-graze calibrations
To maximise the adjusted R2 for the entire pre-graze dataset (n=468) required incorporation of season and year as explanatory factors (adjusted R2 = 0.78). Adding a third term of cultivar had a minor impact on the adjusted R2 (0.80) so the two term analysis was considered the most appropriate. This indicated the relationship held for all seven cultivars used in this experiment.
Data were then coded into one of 14 groupings to describe the different season/year combinations and a grouped linear regression was performed. This allowed standard errors for each of the fitted parameters (intercept and slope) to be determined. The analysis increased the amount of variation accounted for from 59% to 84%. For simplicity, and to ensure the different treatment combinations including cultivar and spring management can be clearly seen, each of the 14 regressions fitted have been plotted separately. For convenience, the regression for each of the 14 groups was performed separately on a restricted dataset to derive R2 values specific to each of the fitted regressions presented.
Regressions on the restricted dataset altered the standard errors associated with the parameters from those initially determined in the grouped linear regression. Six of the 14 groupings were found to have non-zero intercepts but it was found that the regression for Group 1 (spring 2009/2010) could be forced through the origin when the regression was performed on the restricted dataset. In contrast, Group 8 (autumn 2012/2013) which encompassed the origin in the
grouped linear regression was subsequently identified as having a y-intercept which differed from zero when analysed individually.
Overall, the procedure of using an all subset regression followed by recoding for a grouped linear regression ultimately resulted in the need for only 14 regressions to estimate total DM yield from lucerne height over the course of six growth seasons. This compares with 103 potential combinations if individual year/season/cultivar combinations were required.
Calibration relationships for spring, summer and autumn are presented in Figures 2, 3 and 4. Initial phases with a solid grey line indicate regression intercepts were forced through the origin. Initial phases with a grey dashed line indicate regression intercepts differed from zero and required an initial phase to be described. Effectively, this meant that there were 20 different relationships used to estimate pre-graze yields over the 6 years.
Spring
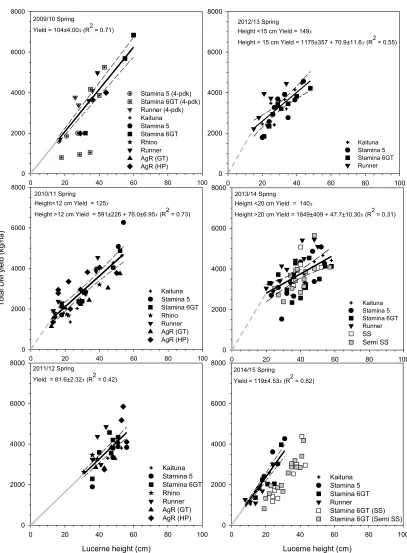
Between 47.7 ± 10.3 (2013/2014) and 119 ± 4.53 kg DM/ha (2014/2015) was produced per centimetre of maximum lucerne height (Figure 1). In three out of six spring seasons relationships encompassed the origin. In the other 3 years equivalent x-intercept values were -7.7 (2010/2011), -16.6 (2012/2013) and -38.8 cm (2013/2014). Over the first 4 years the slope of the spring regression declined at about 11.8 kg DM/ha per year (R2 = 0.84; not shown) from the maximum in Year 1. This pattern was expected as total yield declines in a lucerne stand over time as individual plants die and the remaining population is unable to compensate by producing extra stems/plant. However, the increase to 119 kg DM/cm in the final spring (2014/2015) did not fit the expected pattern and its inclusion meant no relationship existed over time.
Figure 1 Relationships between total dry matter (DM) yield (kg/ha) and lucerne height (cm) for spring (July-November) between 2009/2010 and 2014/2015 at Ashley Dene, Canterbury. SS and Semi SS data are shown for completeness but were
excluded from analysis. --- are the 95% confidence intervals. Where the intercept encompassed zero the regression was
forced through the origin (––– ) while --- indicates the intercept differed from zero. Each fitted parameter is reported with its respective standard error and R2 value.
Figure 1
Relationships between total dry matter yield (kg/ha) and lucerne height (cm)
for spring (July-November) between 2009/2010 and 2014/2015 at Ashley
Dene, Canterbury. SS and Semi SS data are shown for completeness but
were excluded from analysis.
---
are the 95% confidence intervals. Where
the intercept encompassed zero the regression was forced through the origin
(
▬
) while
---
indicates the intercept differed from zero. Each fitted
parameter is reported with its respective standard error and R
2value.
2009/10 Spring
Yield = 104±4.00x (R2 = 0.71)
0 20 40 60 80 100
0 2000 4000 6000 8000
Stamina 5 (4-pdk) Stamina 6GT (4-pdk) Runner (4-pdk) Kaituna Stamina 5 Stamina 6GT Rhino Runner AgR (GT) AgR (HP)
2010/11 Spring
Height<12 cm Yield = 125x
Height >12 cm Yield = 591±226 + 76.0±6.95x (R2 = 0.73)
0 20 40 60 80 100
To
tal
D
M
y
iel
d (
kg
/ha)
0 2000 4000 6000 8000
Kaituna Stamina 5 Stamina 6GT Rhino Runner AgR (GT) AgR (HP)
2011/12 Spring
Yield = 81.6±2.32x (R2 = 0.42)
Lucerne height (cm)
0 20 40 60 80 100
0 2000 4000 6000 8000
Kaituna Stamina 5 Stamina 6GT Rhino Runner AgR (GT) AgR (HP)
2012/13 Spring Height <15 cm Yield = 149x
Height > 15 cm Yield = 1175±357 + 70.9±11.6x (R2 = 0.55)
0 20 40 60 80 100
0 2000 4000 6000 8000
Kaituna Stamina 5 Stamina 6GT Runner
2014/15 Spring
Yield = 119±4.53x (R2 = 0.82)
Lucerne height (cm)
0 20 40 60 80 100
0 2000 4000 6000 8000
Kaituna Stamina 5 Stamina 6GT Runner Stamina 6GT (SS) Stamina 6GT (Semi SS)
2013/14 Spring
Height <20 cm Yield = 140x
Height >20 cm Yield = 1849±409 + 47.7±10.30x (R2 = 0.31)
0 20 40 60 80 100
0 2000 4000 6000 8000
Kaituna Stamina 5 Stamina 6GT Runner
Table 1 Estimated total DM yields (kg/ha) at eight different average lucerne heights (Ht; 15-50 cm) based on individual spring
regressions presented in Figure 1.
Ht (cm) 2009/2010 2010/2011 2011/2012 2012/2013 2013/2014 2014/2015 Mean Yield
15 1560 1730 1220 2240 2570 1790 1850
20 2080 2110 1630 2590 2800 2380 2270
25 2600 2490 2040 2950 3040 2980 2680
30 3120 2870 2450 3300 3280 3570 3100
35 3640 3250 2860 3660 3520 4170 3520
40 4160 3630 3260 4010 3760 4760 3930
45 4680 4010 3670 4370 4000 5360 4350
50 5200 4390 4080 4720 4230 5950 4760
that, even when water was identified as being “non-limiting” to growth, water supply from the soil was inadequate to meet full transpiration demand by the lucerne. Thus, these relationships could differ from stands grown on deep soils with greater water holding capacity or for crops which can be irrigated.
Table 1 shows that when the individual regressions were used to estimate total DM yields at a range of heights (15 to 50 cm) the estimated yields were within 360 to 1200 kg/ha of the 6 year mean despite the year to year variation in calibrations.
Summer
Between 48.0 ± 6.58 (2011/2012) and 96.5 ± 4.52 kg DM/ha/cm (2012/2013) were produced (Figure 2). Intercepts encompassed zero in Years 2, 4 and 6 (2010/2011, 2012/2013 and 2014/2015) but not in Year 3. The equivalent x-intercept value was -17.5 cm in 2011/2012. The four regressions fitted to data collected during the summer accounted for between 49 and 78% of the observed yield variations.
No calibration data from rotationally grazed pastures were collected in the dry summers of 2009/2010 (Year 1) and 2013/2014 (Year 5). Table 2 shows yields estimated from these regressions were deviated from
Table 2 Estimated total DM yields (kg/ha) of lucerne based on the regressions for summer reported in Figure 2. For 2009/2010 and 2013/2014 the “Summer” regression was applied (see Figure 6).
Ht (cm) 2009/2010 2010/2011 2011/2012 2012/2013 2013/2014 2014/2015 Mean Yield
15 1914 1385 809 1087 1914 1259 1394
20 2278 1846 1078 1389 2278 1678 1758
25 2642 2308 1348 1692 2642 2098 2121
30 3006 2769 1617 1994 3006 2517 2485
35 3370 3231 1887 2297 3370 2937 2848
40 3734 3692 2156 2599 3734 3356 3212
45 4098 4154 2426 2902 4098 3776 3575
50 4462 4615 2695 3204 4462 4195 3939
the 6 year mean yield by 520 to 1200 kg DM/ha. The reduction in yield per cm, compared with relationships determined for spring, is consistent with previous work which showed remobilisation of root reserves in spring results in higher growth rates than can be explained purely by increases in temperature (Brown et al. 2006; Moot et al. 2003; Teixeira et al. 2009a; Teixeira et al. 2009b). In summer, in a water stressed crop, internode length is reduced due to decreased cell expansion, which also decreases canopy light interception.
Autumn
Figure 2 Relationships between total DM yield (kg/ha) and lucerne height (cm) for summer (December–February) between 2010/2011 and 2014/2015 at Ashley Dene, Canterbury. SS and Semi SS treatments are shown for completeness but
were excluded from the analysis. --- are the 95% confidence interval. Where the intercept encompassed zero the
regression was forced through the origin (––– ) while --- indicates the intercept differed from zero. Each fitted parameter is reported with its respective standard error and R2 value.
Figure 2
Relationships between total DM yield (kg/ha) and lucerne height (cm) for
summer (December
–
February) between 2010/2011 and 2014/2015 at Ashley
Dene, Canterbury. SS and Semi SS treatments are shown for completeness
but were excluded from the analysis.
---
are the 95% confidence interval.
Where the intercept encompassed zero the regression was forced through the
origin (
▬
) while
---
indicates the intercept differed from zero. Each fitted
parameter is reported with its respective standard error and R
2value.
2010/11 Summer
Yield = 92.3±3.19 (R2 = 0.78)
Lucerne height (cm)
0 20 40 60 80 100
To
tal
D
M
y
iel
d (
kg
/ha)
0 2000 4000 6000 8000
Stamina 6GT Stamina 6GT (SS) Stamina 6GT (Semi SS)
2011/12 Summer Height <24 cm Yield = 83x
Height >24 cm Yield = 842±266 + 48.0±6.58x (R2 = 0.49)
Lucerne height (cm)
0 20 40 60 80 100
0 2000 4000 6000 8000
Kaituna Stamina 5 Stamina 6GT Rhino Runner AgR (GT) AgR (HP)
2012/13 Summer
Yield = 96.5±4.52x (R2 = 0.73)
0 20 40 60 80 100
0 2000 4000 6000 8000
Kaituna Stamina 5 Stamina 6GT Runner
2013/14 Summer
0 20 40 60 80 100
0 2000 4000 6000 8000
Stamina 6GT (SS) Stamina 6GT (SSS)
2014/15 Summer
Yield = 83.9±3.61x (R2 = 0.77)
Lucerne height (cm)
0 20 40 60 80 100
0 2000 4000 6000 8000
Kaituna Stamina 5 Stamina 6GT Runner
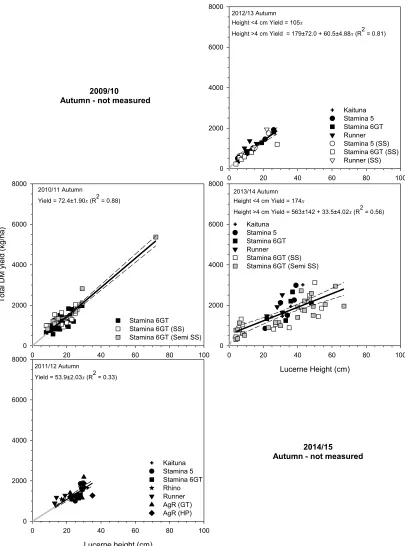
Figure 3 Relationships between total DM yield (kg/ha) and lucerne height (cm) for autumn (March-June) between 2010/2011 and
2013/2014 at Ashley Dene, Canterbury. --- are the 95% confidence intervals. Where the intercept encompassed zero the
regression was forced through the origin (––– ) while --- indicates the intercept differed from zero. Each fitted parameter is reported with its respective standard error and R2 value. Note: no measurements were taken in autumn 2009/2010 or
2014/2015.
Figure 3
Relationships between total DM yield (kg/ha) and lucerne height (cm) for
autumn (March-June) between 2010/2011 and 2013/2014 at Ashley Dene,
Canterbury.
---
are the 95% confidence intervals. Where the intercept
encompassed zero the regression was forced through the origin (
▬
) while
---
indicates the intercept differed from zero. Each fitted parameter is reported
with its respective standard error and R
2value. Note: no measurements were
taken in autumn 2009/2010 or 2014/2015.
2010/11 Autumn
Yield = 72.4±1.90x (R2 = 0.88)
0 20 40 60 80 100
To
tal
D
M
y
iel
d (
kg
/ha)
0 2000 4000 6000 8000
Stamina 6GT Stamina 6GT (SS) Stamina 6GT (Semi SS)
2011/12 Autumn
Yield = 53.9±2.03x (R2 = 0.33)
Lucerne height (cm)
0 20 40 60 80 100
0 2000 4000 6000 8000
Kaituna Stamina 5 Stamina 6GT Rhino Runner AgR (GT) AgR (HP)
2013/14 Autumn Height <4 cm Yield = 174x
Height >4 cm Yield = 563±142 + 33.5±4.02x (R2 = 0.56)
Lucerne Height (cm)
0 20 40 60 80 100
0 2000 4000 6000 8000
Kaituna Stamina 5 Stamina 6GT Runner Stamina 6GT (SS) Stamina 6GT (Semi SS)
2012/13 Autumn Height <4 cm Yield = 105x
Height >4 cm Yield = 179±72.0 + 60.5±4.88x (R2 = 0.81)
0 20 40 60 80 100
0 2000 4000 6000 8000
Kaituna Stamina 5 Stamina 6GT Runner Stamina 5 (SS) Stamina 6GT (SS) Runner (SS)
2009/10 Autumn - not measured
Application of the individual regressions was used to estimate total DM yields at lucerne heights from 15-50 cm. For Year 1 (2009/2010) and 6 (2014/2015) the “Autumn” regression (Yield = 460 + 39.5x) was applied as no calibration data existed. Over 6 years estimated yields deviated from the 6 year mean by 61 to 850 kg/ ha (6 to 31%).
Further examination showed the slopes of the regressions created for autumn tended to decrease over time. It is likely that this reflects variation in the timing and quantity of rainfall in autumn which would require collection of data points at more frequent intervals to investigate fully.
The lowest slope was found reflecting the combined effects of continued water stress until autumn break rains were sufficient to begin recharging the soil profile, and a daylength induced change in partitioning priorities. This results in a lower ratio of carbohydrate being partitioned to the production of aboveground DM and therefore lower growth rates (Teixiera et al. 2009a).
Post-graze relationships
There were 101 post-graze paired samples included in the all subset regression. This identified year as the most appropriate descriptor to separate treatment groupings (adjusted R2 = 0.65). The amount of variation accounted for increased from 39 to 65% when Year was used in the subsequent grouped linear regression.
For simplicity, regressions were then performed on data from individual years to generate R2 values and where appropriate regressions were forced through the origin (3/4 years). In the first year (2009/2010) the regression intercept differed from zero. Post-graze calibration data were unavailable for 2013/2014 or 2014/2015 and not all treatments were sampled in all years. The majority (83/101) of post-graze calibration cuts were taken from rotationally grazed pastures. The amount of variation explained by lucerne height within individual years (Figure 4) ranged from 23 (2011/2012) to 88% (2010/2011) with slopes ranging from a
minimum of 25.2 ± 4.22 (2009/2010) to a maximum of 58.6 ± 7.32 kg DM/ha/cm for the post-graze heights taken in 2012/2013 (Year 4).
In general, the post-graze relationships are of less importance in an on-farm context, but from a research perspective are needed to determine utilisation (Moot et al. 2016).
On-farm application
The processes outlined above were necessary to provide data with a high degree of accuracy and to examine the stability in the relationships over time for this site. This resulted in 20 regressions to estimate pre-graze lucerne yields over 6 years and confirm the need for different regressions for different years and growth seasons as indicated by Griggs & Stringer (1988). It also confirms their report of no impact of cultivar differences on the calibration relationship. In addition, when grouped, the data provide three seasonally based multipliers to convert in situ height measurements to pre-graze DM estimates. These could be applicable on-farm under similar climate and soil conditions. All three regressions were forced though the origin for simplicity.
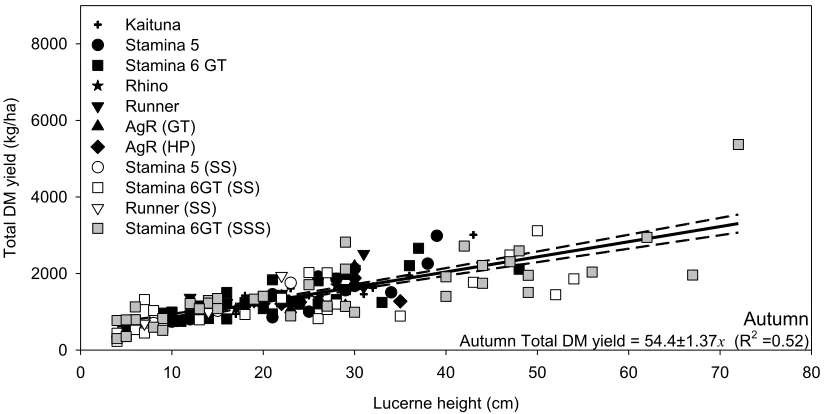
Figure 5 shows in spring ~95 kg DM were produced for every cm increase in lucerne height (Yield = 94.2 ± 1.48x; R2 =0.54). For summer (December-February) dryland lucerne produced 75 kg DM/cm with an R2 of 0.63 (Figure 6) while in autumn (March-June) yield increased by ~55 kg DM/cm (R2 = 0.52; Figure 7). The low R2 values highlight the variability in these relationships and suggests they may need ongoing refinement for use for on-farm.
Conclusions
• Paired samples (468) taken from a dryland grazed lucerne monoculture between 2009/2010 and 2014/2015 were used to create calibrations between total DM yield and lucerne height. Incorporation of year and season into the model increased the overall amount of variation accounted for from 58 to 84%.
Table 3 Estimated total DM yields (kg/ha) of lucerne based on the regressions for the autumn reported in Figure 2. For
2009/2010 and 2014/2015 the “Autumn” regression was applied (see Figure 3).
Ht (cm) 2009/10 2010/11 2011/12 2012/13 2013/14 2014/15 Mean Yield
15 1053 1086 809 1087 1066 1053 1025
20 1251 1448 1078 1389 1233 1251 1275
25 1448 1810 1348 1692 1401 1448 1524
30 1646 2172 1617 1994 1568 1646 1774
35 1843 2534 1887 2297 1736 1843 2023
40 2041 2896 2156 2599 1903 2041 2273
45 2238 3258 2426 2902 2071 2238 2522
Figure 4 Total dry matter yield (kg/ha) of a dryland lucerne monoculture against residual lucerne height (cm) for 4 years at Ashley Dene, Canterbury. --- are the 95% confidence intervals. Where the intercept encompassed zero the regression was
forced through the origin (––– ) while --- indicates the intercept differed from zero. Each fitted parameter is reported with its respective standard error and R2 value. Note: no measurements were taken in 2013/2014 or 2014/2015.
Figure 4
Total dry matter yield (kg/ha) of a dryland lucerne monoculture against
residual lucerne height (cm) for 4 years at Ashley Dene, Canterbury.
---
are
the 95% confidence intervals. Where the intercept encompassed zero the
regression was forced through the origin (
▬
) while
---
indicates the
intercept differed from zero. Each fitted parameter is reported with its
respective standard error and R
2value. Note: no measurements were taken in
2013/2014 or 2014/2015.
2011/12
Yield = 41.7±2.79x (R2 = 0.23)
Lucerne height (cm)
0 10 20 30 40 50
0 1000 2000 3000 4000
5000 Kaituna (Summer)Staimina 5 (Summer)
Stamina 6GT (Spring) Stamina 6GT (Summer) Rhino (Summer) Runner (Summer) AgR (GT) (Summer) AgR (HP) (Summer)
2010/11
Yield = 45.7±181x (R2 = 0.87)
0 10 20 30 40 50
Tot
al
residual DM
y
ield (kg/
ha)
0 1000 2000 3000 4000 5000
Stamina 6GT (Autumn)
Stamina 6GT (Summer; SS/Semi SS) Stamina 6GT (Autumn; SS/Semi SS)
2009/10
Ht <16.5 cm Yield = 101x
Ht > 16.5 cm Yield = 1256±104 + 25.2±4.22x (R2 = 0.87)
0 10 20 30 40 50
0 1000 2000 3000 4000 5000
Stamina 6GT (Spring) Runner (Spring) AgR (HP) (Spring) Stamina 6GT (Spring; 4 pdk)
2014/15
Post graze residual - not measured 2012//13
Ht <3.1 cm Yield = 139x
Ht > 3.1 cm Yield = 276±129 + 58.6±7.32x (R2 = 0.64)
0 10 20 30 40 50
0 1000 2000 3000 4000 5000
Kaituna (Spring/Autumn) Stamina 5 (Spring/Autumn) Stamina 6GT (Spring/Autumn) Runner (Spring/Autumn)
2013/14
194
Figure 5 Total DM yield (kg/ha) against average lucerne height (cm) in spring (July –November) for a dryland lucerne monoculture
based on data collected under rotational grazing of seven cultivars (black symbols; n = 210). Data from SS (n = 15)
and Semi SS (n = 30) spring grazing management are shown for completeness. Dashed lines are the 95% confidence
interval of the line.
Figure 5
Total DM yield (kg/ha) against average lucerne height (cm) in spring (July
–
November) for a dryland lucerne monoculture based on data collected under
rotational grazing of seven cultivars (black symbols;
n
= 210). Data from SS
(
n
= 15) and Semi SS (
n
= 30) spring grazing management are shown for
completeness. Dashed lines are the 95% confidence interval of the line.
Figure 6
Total DM yield (kg/ha) against average lucerne height (cm) in summer
(December-February) for a dryland lucerne monoculture based on data
collected under rotational grazing of seven cultivars (black symbols;
n
= 96).
Data from Semi SS
‘
Stamina 6GT
’
lucerne (grey squares;
n
= 8) spring
grazing management, which were rotationally grazed in summer, are shown
for completeness but were excluded from the regression. Dashed lines are
the 95% confidence interval.
Spring Spring Total DM yield = 94.2±1.48x (R2 =0.54)
Lucerne height (cm)
0 10 20 30 40 50 60 70
Total D M y ield ( kg /ha) 0 2000 4000 6000 8000 Kaituna Stamina 5 Stamina 6GT Rhino Runner AgR (GT) AgR (HP) Stamina 6GT (SS) Stamina 6GT (Semi SS)
Summer Summer Total DM yield = 75.2±1.61x (R2 =0.60)
Lucerne height (cm)
0 10 20 30 40 50 60 70
Tot al D M y ield ( kg /ha) 0 2000 4000 6000 8000 Kaituna Stamina 5 Stamina 6GT Rhino Runner AgR (GT) AgR (HP)
Stamina 6GT (Semi SS)
Figure 6 Total DM yield (kg/ha) against average lucerne height (cm) in summer (December-February) for a dryland lucerne monoculture based on data collected under rotational grazing of seven cultivars (black symbols; n = 96). Data from Semi SS ‘Stamina 6GT’ lucerne (grey squares; n = 8) spring grazing management, which were rotationally grazed in summer, are shown for completeness but were excluded from the regression. Dashed lines are the 95% confidence interval.
Figure 5
Total DM yield (kg/ha) against average lucerne height (cm) in spring (July
–
November) for a dryland lucerne monoculture based on data collected under
rotational grazing of seven cultivars (black symbols;
n
= 210). Data from SS
(
n
= 15) and Semi SS (
n
= 30) spring grazing management are shown for
completeness. Dashed lines are the 95% confidence interval of the line.
Figure 6
Total DM yield (kg/ha) against average lucerne height (cm) in summer
(December-February) for a dryland lucerne monoculture based on data
collected under rotational grazing of seven cultivars (black symbols;
n
= 96).
Data from Semi SS
‘
Stamina 6GT
’
lucerne (grey squares;
n
= 8) spring
grazing management, which were rotationally grazed in summer, are shown
for completeness but were excluded from the regression. Dashed lines are
the 95% confidence interval.
Spring Spring Total DM yield = 94.2±1.48x (R2 =0.54)
Lucerne height (cm)
0 10 20 30 40 50 60 70
Total D M y ield ( kg /ha) 0 2000 4000 6000
8000 Stamina 5 Stamina 6GT Rhino Runner AgR (GT) AgR (HP) Stamina 6GT (SS) Stamina 6GT (Semi SS)
Summer Summer Total DM yield = 75.2±1.61x (R2 =0.60)
Lucerne height (cm)
0 10 20 30 40 50 60 70
Tot al D M y ield ( kg /ha) 0 2000 4000 6000 8000 Kaituna Stamina 5 Stamina 6GT Rhino Runner AgR (GT) AgR (HP)
Stamina 6GT (Semi SS)
• For post-graze calibration relationships, based on 101 paired samples, inclusion of year as a factor increased the amount of variation explained from 35%, based on lucerne height alone, to 65%.
• For on-farm application lucerne yield can be estimated at 95 kg DM/cm in spring, 75 kg DM/cm in summer and 55 kg DM/cm in autumn, but there
was considerable variation around these values. • Relationships were consistent across the seven
cultivars used in this experiment.
ACKNOWLEDGEMENTS
This work was undertaken as part of Phase II of the Pastoral 21 Programme, funded by the Ministry for
Business, Innovation & Employment; DairyNZ; Beef + Lamb New Zealand and Fonterra. Mr Roland Stead provided additional financial support.
REFERENCES
Brown, H.E.; Moot, D.J.; Teixeira, E.I. 2006. Radiation use efficiency and biomass partitioning of lucerne (Medicago sativa) in a temperate climate. European Journal of Agronomy 25: 319-327.
Cayley, J.W.D.; Bird, P.R. 1996. Techniques for Measuring Pastures (2nd Ed.). Pastoral and Veterinary Institute, Hamilton, Vic. 51 pp.
Earle, D.; McGowan, A. 1979. Evaluation and calibration of an automated rising plate meter for estimating dry matter yield of pasture. Australian Journal of Experimental Agriculture 19: 337-343. Griggs, T.C.; Stringer, W.C. 1988. Prediction of alfalfa
herbage mass using sward height, ground cover, and disk technique. Agronomy Journal 80: 204-208. Litherland, A.J.; Webby, R.W.; Fraser, T.J.; Matthew,
C.; McCleod, K.; Walcroft, J.; Bryant, J.; Devantier, B.; Hoogendoorn, C.J.; Moss, R.A.; Clarke-Hill, W.J.; Schreurs, P.J. 2008. Indirect measurement of pasture mass and pasture growth rate on sheep and beef pastures. Proceedings of the New Zealand Grassland Association 70: 137-144.
López Díaz, J.E.; González-Rodríguez, A. 2003. Measuring grass yield by non-destructive methods. pp. 569-572. In: Optimal forage systems for animal production and the environment. Proceedings of the 12th Symposium of the European Grassland Federation. Pleven, Bulgaria.
McLenaghen, R.; Webb, T.H. 2012. Soil properties and fertility of Ashley Dene: the challenge. pp. 17-22. In: Ashley Dene Lincoln University Farm: the first 100 years. Eds. Lucas, R.J.; Gow, N.; Nichol, A. Lincoln University, Christchurch.
Michalk, D.L.; Herbert, P.K. 1977. Assessment of four techniques for estimating yield on dryland pastures. Agronomy Journal 69: 864-868.
Moot, D.J.; Bennett, S.; Mills, A.M.; Smith, M.C. 2016. Optimal grazing management to achieve high yields and utilisation of dryland lucerne. Journal of New Zealand Grasslands 78: 27-34.
Moot, D.J.; Brown, H.E.; Teixeira, E.I.; Pollock, K.M. 2003. Crop growth and development affect seasonal priorities for lucerne management. Legumes for Dryland Pastures. Grasslands Research and Practice Series 11: 201-208.
Mundava, C.; Schut, A.G.T.; Helmholz, P.; Stovold, R.; Donald, G.; Lamb, D.W. 2015. A novel protocol for assessment of aboveground biomass in rangeland environments. The Rangeland Journal 37: 157-167.
Penman, H.L. 1971. Irrigation at Woburn - VII. Report for the Rothamsted Experimental Station 1970, Part 2. pp.147-170.
Piggot, G.H. 1988. Measuring pasture yield for livestock management on farms. Proceedings of the New Zealand Society of Animal Production 48: 219-224.
Rayburn, E.B.; Rayburn, S.B. 1998. A standardised plate meter for estimating pasture mass in on-farm research. Agronomy Journal 90: 238-241.
Figure 7 Relationship between total DM yield (kg/ha) and lucerne height (cm) for autumn (n = 162) collected between 2009/2010 and 2014/2015 at Ashley Dene Canterbury. Regressions were forced through the origin, although the line of best fit had a non-zero. Dashed lines are the 95% confidence intervals and slopes are reported with their corresponding standard
errors.
Figure 7
Relationship between total DM yield (kg/ha) and lucerne height (cm) for
autumn (
n
= 162) collected between 2009/2010 and 2014/2015 at Ashley
Dene Canterbury. Regressions were forced through the origin, although the
line of best fit had a non-zero. Dashed lines are the 95% confidence intervals
and slopes are reported with their corresponding standard errors.
Conclusions
Paired samples (468) taken from a dryland grazed lucerne monoculture
between 2009/2010 to 2014/2015 were used to create calibrations between
total DM yield and lucerne height. Incorporation of year and season into the
model increased the overall amount of variation accounted for from 58 to
84%.
For post-graze calibration relationships, based on 101 paired samples,
inclusion of year as a factor increased the amount of variation explained from
35%, based on lucerne height alone, to 65%.
For on-farm application lucerne yield can be estimated at 95 kg DM/cm in
spring, 75 kg DM/cm in summer and 55 kg DM/cm in autumn, but there was
considerable variation around these values.
Relationships were consistent across the seven cultivars used in this
experiment.
ACKNOWLEDGEMENTS
This work was undertaken as part of Phase II of the Pastoral 21 Programme, funded
by the Ministry for Business, Innovation & Employment; DairyNZ; Beef + Lamb
New Zealand and Fonterra. Mr Roland Stead provided additional financial support.
Autumn Autumn Total DM yield = 54.4±1.37x (R2 =0.52)
Lucerne height (cm)
0 10 20 30 40 50 60 70 80
Tot
al D
M
y
ield (
kg
/ha)
0 2000 4000 6000
Sanderson, M.A.; Rotz, C.A.; Fultz, S.W.; Rayburn, E.B. 2001. Estimating forage mass with a commercial capacitance meter, rising plate meter, and pasture ruler. Agronomy Journal 93: 1281-1286.
Sim, R.E. 2014. Water extraction and use of seedling and established dryland lucerne crops. PhD thesis. Lincoln University. http://hdl.handle.net/10182/6044 Teixeira, E.I.; Moot, D.J.; Brown, H.E. 2009a.
Modelling seasonality of dry matter partitioning and root maintenance respiration in lucerne (Medicago sativa L.) crops. Crop and Pasture Science 60: 778-784.
Teixeira, E.I.; Moot, D.J.; Brown, H.E.; Monks, D.P. 2009b. Modeling shoot and root biomass of lucerne crops - new insights on the seasonality of dry matter partitioning and root maintenance respiration. pp. 109-115. In: Crop Modeling and Decision Support. Eds. Cao, W.; White, J.W.; Wang, E. Springer, Berlin Heidelberg.