Pediatric Cardiac Surgery: The Effect of Hospital and Surgeon Volume on
In-hospital Mortality
Edward L. Hannan, PhD*; Michael Racz, MS*; Rae-Ellen Kavey, MD‡; Jan M. Quaegebeur, MD, PhD§; and Roberta Williams, MDi
ABSTRACT. Objective. To examine the relationship between annual provider (hospital and surgeon) volume of pediatric cardiac surgery and in-hospital mortality.
Design. Population-based retrospective cohort study using a clinical database.
Setting. The 16 acute care hospitals in New York with certificate of need approval to perform pediatric cardiac surgery.
Patients. All children undergoing congenital heart surgery in New York from 1992 to 1995.
Main Outcome Measures. Risk-adjusted mortality rates for various hospital and surgeon volume ranges. Adjustments were made for severity of illness using logistic regression.
Results. A total of 7169 cases were analyzed. After controlling for severity of preprocedural illness using clinical risk factors, hospitals with annual pediatric car-diac surgery volumes of fewer than 100 had significantly higher mortality rates (8.26%) than hospitals with vol-umes of 100 or more (5.95%), and surgeons with annual volumes of fewer than 75 had significantly higher mor-tality rates (8.77%) than surgeons with annual volumes of 75 or more (5.90%).
Conclusions. Both hospital volume and surgeon vol-ume are significantly associated with in-hospital mortal-ity, and these differences persist for both high-complex-ity and low-complexhigh-complex-ity pediatric cardiac procedures. Pediatrics 1998;101:963–969; pediatric cardiac surgery, mortality, hospital volume, surgeon volume.
ABBREVIATIONS. CSRS, New York Cardiac Surgery Reporting System; CAC, Cardiac Advisory Committee.
N
umerous studies in the past 2 decades have documented significant inverse relationships between adverse outcomes for certain types of patients and the amount of experience providers have in treating those patients.1– 8Generally, patientshave been identified according to the type of proce-dure they underwent or their medical condition (principal diagnosis), with surgical examples being
more frequent. Also, provider volume has been mea-sured both on the hospital and the physician/sur-geon level, with some studies investigating both vol-ume measures. For the most part, in-hospital or short-term mortality has been used as the measure of adverse outcome, although complications of treat-ment and hospital length of stay have also been used. The more sophisticated studies have attempted to investigate volume-outcome differences after having adjusted for patient severity of illness using various demographic and diagnostic indicators of severity. The reader is referred to the book by Luft et al9for a
thorough description and review of the methods used, assumptions made, procedures and medical conditions investigated, and current areas of re-search in this large body of work.
Only one study in the literature has investigated the relationship between adverse outcomes and the volume of pediatric cardiac surgery. Probably one of the reasons for this is that pediatric cardiac surgery involves a myriad of different procedures, involving different surgical challenges and entailing a wide range of risks to patients. Also, the annual volumes for each of these individual procedures tend to be quite low, even when accumulated across an entire state or large geographical region.
The purpose of this study is to examine the rela-tionship between in-hospital mortality and provider (hospital and surgeon) volume for pediatric cardiac surgery in New York State between 1992 and 1995. This study extends the earlier study conducted by Jenkins et al1in a few respects. First, both hospital
volume and surgeon volume are available as mea-sures of provider volume, whereas Jenkins et al had access only to hospital volume. Second, clinical data from New York’s Cardiac Surgery Reporting System (CSRS) are available for conducting risk-adjustments rather than having to rely on administrative data collected for other purposes. Third, in addition to investigating aggregate differences in risk-adjusted mortality for various provider volume groups, this study examines risk-adjusted mortality rate differ-ences between provider volume groups for different levels of procedure complexity.
DATA AND METHODS Data
The database used in the study is the part of New York’s CSRS dedicated to pediatric cardiac surgery. The CSRS was initiated in 1989 by the New York State Department of Health and its Cardiac Advisory Committee (CAC) for the purpose of improving quality From the *Department of Health Policy, Management, and Behavior, State
University of New York, University at Albany, Albany, New York; the ‡Department of Pediatric Cardiology, SUNY Health Science Center, Syra-cuse, New York; the §Department of Surgery, Columbia-Presbyterian Hos-pital, New York, New York; and theiDepartment of Pediatrics, University of North Carolina, Chapel Hill, North Carolina.
Received for publication May 30, 1997; accepted Oct 16, 1997.
Reprint requests to (E.L.H.) University at Albany, State University of New York, Department of Health Policy, Management, and Behavior, One Uni-versity Place, Rensselaer, NY 12144 –3456.
of care in New York. The CAC is a group of cardiac surgeons, cardiologists, health services researchers, and consumers charged with advising the Department of Health on issues related to the quality of and access to cardiac care, and the prevention of coro-nary heart disease. The CSRS contains information on patient demographics, types of procedures performed, risk factors/diag-noses, complications of surgery, discharge status, and surgeon and hospital identifiers. The information is collected concurrently under the direction of each hospital’s director of cardiac surgery. Completeness of registry data is assured by matching it with New York’s administrative database, the Statewide Planning and Re-source Cooperative System. Data accuracy is assured by conduct-ing medical record reviews in each hospital.
The quality of coronary artery bypass graft surgery has been improved by identifying significant risk factors related to coronary artery bypass graft surgery, risk-adjusting adverse outcomes using these factors, computing risk-adjusted mortality rates for surgeons and hospitals, and providing this information to hospitals, surgeons, and the public.10,11This has not been done to date for other
proce-dures in the database (eg, valve surgery, pediatric cardiac surgery) primarily because these procedure groups are not as homogenous and have much lower volumes.
Although pediatric cardiac surgery data have been available since 1989, the set of risk factors in the database was expanded substantially in 1991. The data in this study comprises all pediatric cardiac surgery performed in New York State between 1992 and 1995 that is reportable in the state’s pediatric cardiac surgery registry mentioned above, a total of 7169 procedures. These pro-cedures are performed in the 16 hospitals in New York that have certificate of need approval.
The pediatric cardiac surgery report form that is part of the CSRS contains information on patient demographics (age, date of birth, sex, ethnicity, race); admission, procedure, and discharge dates; primary diagnosis and procedure codes; mode of cardio-pulmonary bypass; weights at birth and at time of operation; number of previous open heart and closed heart operations; pre-vious catheter interventions; 11 other risk factors; and a variety of complications after surgery.
The procedures used in the study were identified and defined by the CAC so as to accurately characterize the treatments ob-tained and the risks incurred by patients. They are identified using special codes created by the CAC that are similar to, but do not map on a one-to-one basis with, ICD-9-CM codes.
Complexity Categories
In CSRS, procedures are classified according to recommendations from the CAC. As mentioned above, one of the challenges in exam-ining volume-outcome relationships in pediatric cardiac surgery is that there is a wide variety of procedures performed, with no one procedure having a sufficient volume in most databases to sustain complicated multivariate analyses. Consequently, the best analysis option is the one used by Jenkins et al,1which is to combine
proce-dures into groups that are as homogenous as possible with respect to patient severity of illness and to use the groups as severity measures (risk factors) in the risk-adjustment process.
The method used in this study to define complexity categories consisted of the following steps: (1) order the procedures accord-ing to in-hospital mortality rate from low to high, (2) look for natural breaks in the contiguous mortality rates so that between three and five groups could be identified (it was decided that this was a good range to use so that enough groups would be available for describing severity of illness differences while maintaining a sufficiently large number of cases in each group), (3) have the pediatric cardiac surgeon (J.Q.) and the two pediatric cardiologists (R.E.K. and R.W.) revise the categories so that similar procedures would be contained in the same category even if they had some-what dissimilar mortality rates, and to reflect procedural complex-ity not necessarily captured by mortalcomplex-ity rates in the database (perhaps because of low volumes), and (4) repeat steps 1 and 2. Four procedure complexity categories were identified.
Methods
The first step in the analysis consisted of calculating the fre-quencies and mortality rates associated with each of the demo-graphic and diagnostic risk factors contained in New York’s clin-ical pediatric cardiac surgery database. Later, these analyses were expanded to include frequencies and mortality rates for each of
two hospital volume ranges (,100 pediatric cardiac procedures annually, 100 or more procedures annually). Significance of the various categorical variables (eg, sex, race, binary risk factors such as congestive heart failure) was determined usingx2tests.
Next, a stepwise logistic regression model was constructed to determine which of the potential risk factors were significant predic-tors of in-hospital mortality, and how to predict mortality on the basis of those risk factors. The dependent variable was binary, with a 1 denoting in-hospital mortality and a 0 denoting a live discharge. The candidate independent variables were the demographic and diagnostic risk factors described above, and the four complexity categories. Independent variables were retained in the model if they were significant in the stepwise analysis (P,.05).
Complexity categories were tested in the model by using the group with the lowest complexity as a reference group, and the other three groups as binary risk factors in the model. Age was tested as a categorical variable by splitting it into ranges that were defined after examining their bivariate relationship with mortal-ity. The ranges,7 days, 7 to 29 days, 30 to 89 days, 90 to 179 days, 180 to 359 days, and 360 days or more were used. Also, after a set of significant independent variables was identified, two-way in-teractions among these variables were tested in a new stepwise model. As a test of the adequacy of the complexity categories, observed and expected (using the model) mortality rates were compared for each of the complexity categories.
After the final statistical model was identified, hospital and surgeon volume measures associated with each case were com-puted as the number of pediatric cardiac procedures performed in that calendar year in the hospital the procedure was performed and by the surgeon performing the procedure, respectively. Then, risk-adjusted mortality rates were calculated for different hospital and surgeon volume groups in an attempt to determine which split that created high-volume and low-volume groups yielded the largest differential in risk-adjusted mortality rates between the two groups while maintaining reasonably large volumes in the two groups. Splits at 100 procedures annually in hospitals and 75 procedures annually for surgeons were obtained. As a confirma-tion that the two volume measures were significant predictors of mortality, they were also tested by adding them to the logistic regression model described above, and testing their significance in the model. Another test consisted of using the average 4-year hospital and surgeon volumes in lieu of annual volumes to deter-mine if the conclusions changed substantially (they did not).
In computing risk-adjusted mortality rates, the first step con-sisted of computing the expected mortality rate for the volume groups by summing the predicted probabilities of death for each patient in the group using the logistic regression model, and then dividing by the number of patients. For each volume group, this rate was divided into the observed mortality rate (number of deaths/number of patients), and then multiplied by the overall mortality rate for all pediatric surgery patients to obtain the risk-adjusted mortality rate for the group. This rate represents the best estimate of what each hospital volume or surgeon volume group’s mortality rate would have been if it had had an average severity of illness that was the same as that of the state as a whole. The rate for each group was then tested to determine if it was (statistically) significantly higher or lower than the statewide rate by calculating confidence intervals for risk-adjusted rates.12
The next set of analyses was aimed at determining if there were significant differences in risk-adjusted mortality rates for hospital volume groups and for surgeon volume groups by complexity category. Because the analysis used complexity categories rather than the entire data set (and this reduced the sample sizes), the relationship between each of the two provider volume measures and risk-adjusted mortality was examined separately rather than observing intersections of the volume measures. The purpose of these analyses was to determine if the relationship between mor-tality rate and provider volume was limited to the more complex procedures, or if it persisted across all complexity categories.
four groups, and to determine if there were interaction effects between hospital volume and surgeon volume.
RESULTS
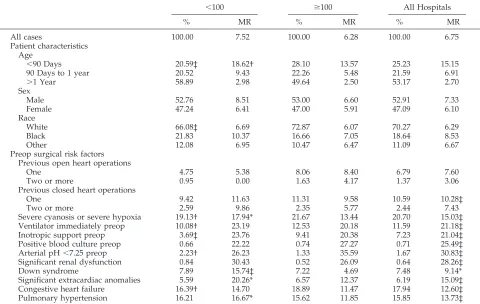
Table 1 presents the prevalence rates for various patient demographics and risk factors among pedi-atric cardiac surgery patients in New York between 1992 and 1995, as well as the in-hospital mortality rates for these groups of patients (last two columns, respectively). In addition, patients have been subdi-vided into the group who underwent cardiac surgery in hospitals with an annual pediatric cardiac surgery volume of,100 and hospitals with an annual pedi-atric cardiac surgery volume of 100 or more. Preva-lence rates and mortality rates are reported for both of these groups. Note that if a hospital had a volume ,100 in one year and.100 in another year, its pa-tients are reported in different groups in the 2 years. It should also be noted that annual hospital volumes ranged from 19 to 379 cases, and annual surgeon volumes ranged from 1 to 364 cases.
The overall mortality rate for the 7169 patients was 6.75%, with a mortality rate of 7.52% for patients undergoing surgery in hospitals with annual pediat-ric cardiac surgical volumes of,100, and a mortality rate of 6.28% for patients undergoing surgery in hospitals with pediatric volumes of 100 or more.
Patient age, sex, race, and all preoperative surgical risk factors available in the clinical database except number of previous open heart operations were found to be significantly (bivariately) related to in-patient mortality rate (see last column).
A comparison of the prevalence rates of demo-graphics and risk factors between the two hospital volume groups demonstrates that hospitals with an-nual pediatric volumes,100 had significantly older patients, and a significantly lower percentage of pa-tients of white race, and with previous open heart and closed heart operations. The lower volume hos-pitals also had a significantly lower percentage of patients with severe cyanosis or hypoxia, on a ven-tilator or inotropic support immediately before the operation, and with congestive heart failure. How-ever, they had a significantly higher percentage of their patients who had an arterial pH ,7.25 before the operation.
The Appendix presents, for each of the four com-plexity categories, each of the procedures contained in the category along with the frequency with which it was performed and the mortality rate of patients undergoing it in New York between 1992 and 1995. As the Appendix demonstrates, the distribution of patients in the four categories ranged from 12% in
TABLE 1. Patient Characteristics by Annual Hospital Volume
,100 $100 All Hospitals
% MR % MR % MR
All cases 100.00 7.52 100.00 6.28 100.00 6.75
Patient characteristics Age
,90 Days 20.59‡ 18.62† 28.10 13.57 25.23 15.15
90 Days to 1 year 20.52 9.43 22.26 5.48 21.59 6.91
.1 Year 58.89 2.98 49.64 2.50 53.17 2.70
Sex
Male 52.76 8.51 53.00 6.60 52.91 7.33
Female 47.24 6.41 47.00 5.91 47.09 6.10
Race
White 66.08‡ 6.69 72.87 6.07 70.27 6.29
Black 21.83 10.37 16.66 7.05 18.64 8.53
Other 12.08 6.95 10.47 6.47 11.09 6.67
Preop surgical risk factors Previous open heart operations
One 4.75 5.38 8.06 8.40 6.79 7.60
Two or more 0.95 0.00 1.63 4.17 1.37 3.06
Previous closed heart operations
One 9.42 11.63 11.31 9.58 10.59 10.28‡
Two or more 2.59 9.86 2.35 5.77 2.44 7.43
Severe cyanosis or severe hypoxia 19.13† 17.94* 21.67 13.44 20.70 15.03‡
Ventilator immediately preop 10.08† 23.19 12.53 20.18 11.59 21.18‡
Inotropic support preop 3.69‡ 23.76 9.41 20.38 7.23 21.04‡
Positive blood culture preop 0.66 22.22 0.74 27.27 0.71 25.49‡
Arterial pH,7.25 preop 2.23† 26.23 1.33 35.59 1.67 30.83‡
Significant renal dysfunction 0.84 30.43 0.52 26.09 0.64 28.26‡
Down syndrome 7.89 15.74‡ 7.22 4.69 7.48 9.14*
Significant extracardiac anomalies 5.59 20.26* 6.57 12.37 6.19 15.09‡
Congestive heart failure 16.39† 14.70 18.89 11.47 17.94 12.60‡
Pulmonary hypertension 16.21 16.67* 15.62 11.85 15.85 13.73‡
Note. Asterisks in the last column of the table denote a significant relationship between the patient characteristic and mortality (eg, the relationship between age groupings and mortality). Asterisks in the first column denote a significant difference in prevalence of the patient characteristic between hospitals with annual volumes below 100 and hospitals with annual volumes of 100 or more. Asterisks in the third column denote a significant difference in the mortality rate of patients of the patient characteristic between hospitals with annual volumes below 100 and hospitals with annual volumes of 100 or more.
APPENDIX. Complexity Categories for Pediatric Cardiac Surgery
Category I
Procedure MR (%) No. of Cases Vol. (%)
Patent ductus arteriosis closure/weight.1500 g 1.88 585 8.16
Coarctation of aorta repair 1.93 466 6.50
Blalock-Hanlon septectomy 0.00 11 0.15
Aortic valvotomy 0.00 3 0.04
Vascular ring repair 0.00 51 0.71
Atrial septal defect, secundum 0.63 789 11.01
ASD (primum/sinous Ven./PAPVC/w MV Repair) 0.37 273 3.81
Cor triatrialum or supravalvular mitral stenosis 0.00 19 0.27
Single VSD 1.84 817 11.40
VSD and aortic Inc/VSD w/tri valve 2.17 46 0.64
Tetralogy of Fallot without transannular patch 2.04 147 2.04
Pulmonary valvotomy 1.79 56 0.78
Coronary fistula closure 0.00 7 0.10
Aort val repl (mech/het/homograft/auto) 2.38 42 0.59
Aortic stenosis (subvalvular/supravalvular) 0.71 140 1.95
Cardiac arrhythmia surgery 0.00 1 0.00
1.39 3453 48.15
Category II
Procedure MR (%) No. of Cases Vol. (%)
Multiple VSD 5.26 19 0.27
Tetralogy of Fallot, with transannular patch 5.29 435 6.07
Bidirectional Glenn anastomosis/Bidir Glenn 3.33 210 2.93
Aortopulmonary window repair 4.76 21 0.29
Aortic root repair 0.00 29 0.04
Mitral valve repair 2.7 74 1.03
Rastelli repair/intraventricular tunnel repair 5.71 105 1.46
4.48 893 12.09
Category III
Procedure MR (%) No. of Cases Vol. (%)
Blalock-Taussing/other shunts 9.11 428 5.97
Complete atrioventricular canal defect 10.10 287 4.00
Tetralogy of Fallot (w/right vent to pul cond/pul atr) 13.00 100 1.39
Tetralogy of Fallot, with other intracardiac proc. 8.16 98 1.37
Reconstruction of RV outflow tract, with shunt 12.9 31 0.43
Reconstruction of RV outflow tract, w/o shunt 11.25 80 1.12
Fontan operation/total cavo-pulm derivation 13.51 185 2.58
Ebstein’s malformation repair 11.11 9 0.13
Aortoventriculoplasty 7.14 14 0.20
Aortic valvotomy, open 7.50 40 0.56
Mech. mitral valve replacement/het repl 13.51 37 0.52
Arterial switch/Art switch and other cardiac proc 11.72 256 3.57
Other op for CHD with extra corp 12.46 313 4.37
10.97 1878 26.21
Category IV
Procedure MR (%) No. of Cases Vol. (%)
Patent ductus arteriosis closure/wt,1500 g 15.56 257 3.58
Aortic arch anom. repair/int. aortic arch repair 16.07 56 0.78
Banding of pulmonary artery 19.05 84 1.17
Waterson/central shunts 22.41 58 0.81
Pulmonary valvotomy, closed 16.67 18 0.25
Other ops for CH disease w/o extra corp 17.39 46 0.64
Total anomolous pulmonary venous connection 17.86 112 1.56
Truncus arteriosus repair 22.03 59 0.82
Anomalous left coronary from pulmonary artery 14.81 27 0.38
Aortic valve replacement (other) 20.00 5 0.07
Other op. for left ventricular outlet obstruction 20.00 10 0.14
Hypoplastic LH of aortic atresia (Norwood, other) 34.21 114 1.59
Mitral valve repl, creat or enlargement of ASD 16.67 6 0.08
Mustard/Senning repair-trans. of great arteries 23.53 17 0.24
LV-PA conduit with or without other card proc 40.00 5 0.07
Other procedure for TGA or DORV 15.38 52 0.73
Septation (primary or staged) single vent procs 16.67 6 0.08
Other procedure for single ventricle 46.15 13 0.18
20.11 945 13.17
Category II to 48% in Category I. The mortality rates of the four categories were well distinguished from one another, with the respective rates being 1.39%, 4.48%, 10.97%, and 20.11%.
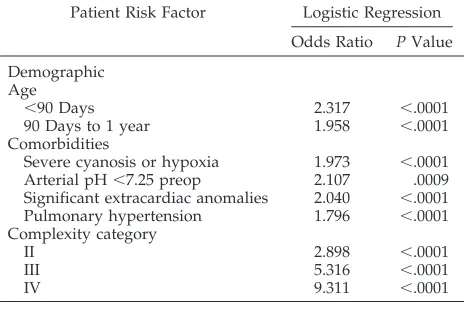
Table 2 presents the logistic regression model that predicts in-hospital mortality on the basis of demo-graphics, available risk factors in the database, and the four procedure categories. As demonstrated in Table 2, the risk factors significantly (directly) related to mortality for pediatric cardiac surgery patients were age,90 days, age between 90 days and 1 year, severe cyanosis or hypoxia, arterial pH,7.25 preop-eratively, significant extracardiac anomalies, pulmo-nary hypertension, and procedure complexity cate-gory. Except for age and complexity category, all of these factors are binary, and the odds ratios repre-sent the odds of a patient with that risk factor dying in the hospital divided by the odds of a patient without the risk factor dying in the hospital, assum-ing that both patients have the same set of other significant risk factors. Thus, patients with severe cyanosis or hypoxia have odds of dying in the hos-pital that are 1.973 times the odds of patients without severe cyanosis or hypoxia dying in the hospital, all other risk factors being the same.
For age, the risk represented is in relationship to the reference (omitted) category, which is age .1 year. Thus, the odds of a patient,90 days old dying in the hospital are 2.317 times the odds of a patient older than 1 year dying in the hospital, if all other risk factors are identical.
The odds for each of the complexity categories in the model are relative to patients in Complexity Cat-egory I. Thus, for example, the odds of a patient in Complexity Category III dying in the hospital are 5.316 times the odds of a patient in Complexity Cat-egory I if all of both patients’ other risk factors are the same.
Table 3 presents, for each of the four procedure complexity categories, a comparison of patients un-dergoing procedures in hospitals with annual pedi-atric cardiac surgery volumes of,100 with patients undergoing these procedures in hospitals with vol-umes of at least 100.
The comparisons include percentage of proce-dures, observed mortality, and risk-adjusted mortal-ity for each of the two volume groups. The same information is reported for two surgeon volume groups (annual volume ,75, annual volume 75 or more) in the bottom half of Table 3.
The percentage of procedures in each complexity category performed in hospitals with annual pediat-ric cardiac surgery volumes,100 was 42% for pro-cedures in Complexity Category I, 33% for
proce-dures in Complexity Category II, 34% for
Complexity Category III, and 36% for Complexity Category IV. Thus, although there was a tendency for low volume hospitals to perform a larger share of procedures in the least complex group than in the other groups, there was no difference in the share of procedures performed in the highest three groups, which had observed mortality rates that ranged from 4.48% to 20.11%.
The overall risk-adjusted mortality rate for pa-tients in hospitals with annual pediatric volumes ,100 was 8.26%, which was significantly higher (P,
.05) than the statewide rate of 6.75% (see the total group). The overall risk-adjusted mortality rate for patients in hospitals with volumes of 100 or more was 5.95%, which was significantly lower (P ,.05) than the statewide rate. The higher hospital volume group had the lowest risk-adjusted mortality rate for each complexity category, and the respective differ-ences between volume groups for cases in the four complexity categories were 4.11%, 3.61%, 2.99%, and 1.07%. Perhaps surprisingly, the smallest difference occurred for the highest risk patients.
The percentage of all patients undergoing proce-dures by the lower volume surgeon group (see bot-tom of Table 3) is 34% for the lowest complexity procedures, 34% for the highest complexity proce-dures, and 26% for each of the two middle complex-ity categories. Thus, there is not a strong tendency for the more complex cases to be assigned to the higher volume surgeons.
Table 3 also shows that the risk-adjusted mortality rate for patients of the lower volume surgeons was 8.77%, which was significantly higher than the state-wide mortality rate (P , .05), and that the risk-adjusted rate for patients of the higher volume sur-geons was 5.90%, which was significantly lower than the statewide mortality rate (P,.05). For each com-plexity category, patients of the lower volume sur-geons had higher risk-adjusted mortality rates than patients of the higher volume surgeons. Also, the largest difference in risk-adjusted rates was for the lowest complexity category (10.23% vs 5.04%), and the next largest difference was for the second highest complexity category (8.78% vs 5.79%).
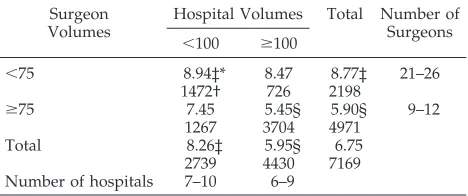
Table 4 presents, for each intersection of the two hospital volume groups (,100, $100) and the two surgeon volume groups (,75, $75), the number of patients undergoing pediatric cardiac procedures be-tween 1992 and 1995 and the risk-adjusted mortality rate. Also included are the ranges for the number of hospitals and number of surgeons with annual vol-umes in each volume group. As indicated, the risk-adjusted mortality rate ranged from 5.45% for
pa-TABLE 2. Multivariable Risk Factor Equation for Pediatric Cardiac Surgery In-hospital Deaths in New York State, 1992–1995
Patient Risk Factor Logistic Regression
Odds Ratio PValue
Demographic Age
,90 Days 2.317 ,.0001
90 Days to 1 year 1.958 ,.0001
Comorbidities
Severe cyanosis or hypoxia 1.973 ,.0001
Arterial pH,7.25 preop 2.107 .0009
Significant extracardiac anomalies 2.040 ,.0001
Pulmonary hypertension 1.796 ,.0001
Complexity category
II 2.898 ,.0001
III 5.316 ,.0001
IV 9.311 ,.0001
Intercept5 24.8396. C Statistic50.818.
tients undergoing surgery in hospitals with annual volumes of at least 100 performed by surgeons with annual volumes of at least 75 to 8.94% for patients undergoing surgery in hospitals with annual vol-umes of ,100 performed by surgeons with annual volumes of,75. These two rates were significantly lower and significantly higher, respectively, than the statewide rate (P , .05), and significantly different from one another (P, .05). Risk-adjusted mortality rates for combinations of low-volume surgeons and high-volume hospitals, and of high-volume surgeons and low-volume hospitals, were 8.47% and 7.45%, respectively.
DISCUSSION
The purpose of this study was to examine the relationship between the in-hospital mortality rate for pediatric cardiac procedures and the annual hos-pital and surgeon volumes for these procedures. However, there are many different pediatric cardiac procedures, each with its own complexity and mor-tality rate. Consequently, the strategy used to ana-lyze the data was the one used by Jenkins et al,1
which was to combine procedures into categories on the basis of their complexities/hospital mortality rates, and then to use these groups in addition to
patient demographics and risk factors to risk-adjust mortality rates for different ranges of provider vol-umes. Two advantages of this study relative to the study by Jenkins et al1are: 1) a clinical database was
available to us for performing the risk-adjustments rather than having to rely on administrative data, and 2) annual surgeon volumes were available for testing the surgeon volume-mortality relationship in addition to the hospital volume-mortality relation-ship.
In observing the procedure categories, it is impor-tant to note that patient selection and the presence of important comorbidities undoubtedly account for differences in mortality between closely related pro-cedures. As an example, patients with severe pulmo-nary stenosis associated with a dysplastic pulmopulmo-nary valve are likely to undergo an open pulmonary val-votomy, whereas patients with pulmonary atresia, intact ventricular septum, and hypoplastic right ven-tricle may be more heavily represented in the group having a closed pulmonary valvotomy. Clearly, the hazard of death is greater in the latter group; conse-quently, the difference in mortality between open and closed pulmonary valvotomy is likely to be a function of the risk factors associated with the dis-ease state rather than the technical features of the surgery.
Findings of the study were that annual hospital volume and annual surgeon volume were both sig-nificantly related to inpatient mortality rates, even after controlling for patient age and several clinical risk factors in addition to procedure complexity. The maximal differentiation in mortality rates between high- and low-volume providers was at 100 proce-dures annually for hospitals and 75 proceproce-dures an-nually for surgeons. However, in general, higher hospital volumes and higher surgeon volumes were associated with lower risk-adjusted mortality rates across all procedure volumes, so any decision to recommend minimum hospital or surgeon volumes for pediatric cardiac procedures should take into account this fact and practical considerations regard-ing the geographical distribution of pediatric centers. It is also important to note that annual hospital
TABLE 3. Observed and Risk-adjusted Mortality Rates for Hospital Volumes and Complexity Groups
Annual Hospital
Volume
I II III IV Total
% in Group
OMR RAMR % in
Group
OMR RAMR % in
Group
OMR RAMR % in
Group
OMR RAMR % in
Group
OMR RAMR
,100 42.2 1.85 9.16 33.0 5.76 9.24 34.3 13.35 8.78* 36.2 22.22 7.34 38.2 7.52 8.26*
$100 57.8 1.05 5.05 67.0 3.85 5.63 65.7 9.72 5.79 63.8 18.91 6.41 61.8 6.28 5.95†
Total 100 1.39 100 4.48 100 10.97 100 20.11 100 6.75
Observed and Risk-adjusted Mortality Rates for Surgeon Volumes and Complexity Groups
Annual Surgeon Volume
I II III IV Total
% in Group
OMR RAMR % in
Group
OMR RAMR % in
Group
OMR RAMR % in
Group
OMR RAMR % in
Group
OMR RAMR
,75 33.7 2.07 10.23 26.3 4.68 7.47 25.5 15.69 9.82* 34.2 23.53 7.80 30.7 8.46 8.77*
$75 66.3 1.05 5.04 73.7 4.41 6.51 74.5 9.36 5.73 65.8 18.33 6.20 69.3 5.99 5.90†
Total 100 1.39 100 4.48 100 10.97 100 20.11 100 6.75
Abbreviations: OMR, observed mortality rate; RAMR, risk-adjusted mortality rate. * Risk-adjusted rate is significantly higher than statewide rate (P,.05).
† Risk-adjusted rate is significantly lower than statewide rate (P,.05).
TABLE 4. Number of Cases and Risk-adjusted Mortality Rates for Pediatric Cardiac Surgery in New York State from 1992– 1995 by Annual Hospital and Surgeon Volume
Surgeon Volumes
Hospital Volumes Total Number of Surgeons
,100 $100
,75 8.94‡* 8.47 8.77‡ 21–26
1472† 726 2198
$75 7.45 5.45§ 5.90§ 9–12
1267 3704 4971
Total 8.26‡ 5.95§ 6.75
2739 4430 7169
Number of hospitals 7–10 6–9
* Risk-adjusted mortality rate. † Number of patients.
‡ Risk-adjusted rate is significantly higher than statewide rate (P,.05).
volume and annual surgeon volume were indepen-dently related to risk-adjusted mortality rate, mean-ing that even if one of the two volume measures was high, mortality rates were lower when the other mea-sure was high than when it was low. Patients under-going procedures performed by higher volume sur-geons (75 or more procedures annually) in higher volume hospitals (100 or more procedures annually) had the lowest risk-adjusted mortality rate of all groups (5.45%), which was significantly lower than the risk-adjusted mortality rate for patients undergo-ing procedures in hospitals with annual volumes ,100 performed by surgeons with annual volumes ,75 (8.94%).
Another important finding was that patients in higher volume hospitals and patients with higher volume surgeons experienced lower risk-adjusted mortality rates than patients with lower volume pro-viders regardless of the complexity category of the procedure they had undergone. This was somewhat surprising because it had been hypothesized that mortality rate differences may be limited to higher risk procedures.
A caveat regarding the study is that, like the study by Jenkins et al,1 it was necessary to group
proce-dures into complexity categories to perform the anal-yses because there were too many procedures (with too low volumes) to consider them separately. Thus, there is a possibility that lower volume providers performed a higher proportion of the more complex procedures within categories than higher volume providers, and were unfairly assessed. However, a perusal of the relative frequencies of procedures within categories by volume groups does not sub-stantiate this concern.
Another potential bias could be introduced if there was a tendency for the higher volume providers to code patient risk factors more conscientiously than the lower volume providers, or if higher volume providers are coding risk factors that are not legiti-mate to have lower risk-adjusted mortality rates. However, no major coding problems have been found in data quality audits of pediatric forms con-ducted by the New York State Department of Health. An important caveat regarding the interpretation of these results is that, as in other volume-mortality studies, it is difficult, if not impossible, to determine the direction of causality in the association between higher provider volumes and lower risk-adjusted mortality rates. One possible explanation is practice makes perfect, whereby a hospital or surgeon achieves better results by honing its skills on numer-ous patients; another possible explanation is the se-lective referral hypothesis, whereby the higher vol-ume providers perform higher volvol-umes because they are known to have superior outcomes. The former hypothesis suggests that it would be wise to encour-age a system with as many high-volume providers and as few low-volume providers as possible,
in-cluding the creation of high-volume providers by increasing the volumes of current low-volume pro-viders. The latter hypothesis would suggest that at-tempts to alter the current distribution by increasing the volume of low-volume providers would proba-bly not result in substantially better outcomes. For a thorough discussion of these alternative explana-tions, the reader is referred to the seminal book by Luft et al.9
The findings of this study have served to reinforce the findings of Jenkins et al1by confirming the
hos-pital volume-mortality relationship in another set-ting and by establishing that risk-adjusted mortality is also related to annual surgeon volume. Studies in other regions are recommended to help refine the identification of optimal provider volumes and to reexamine the volume-mortality relationship for var-ious procedure complexity categories.
In New York, where access to clinical data is avail-able, future initiatives will include attempts to assess provider quality of pediatric cardiac surgery by cal-culating provider-specific risk-adjusted mortality rates. Also, we will attempt to evaluate other impor-tant but more complex measures of quality such as medical versus surgical treatment of patients, and the timing and choice of procedures to be performed.
REFERENCES
1. Jenkins KJ, Newburger JW, Lock JE, Davis RB, Coffman GA, Iezzoni LI. In-hospital mortality for surgical repair of congenital heart defects: preliminary observations of variation by hospital caseload.Pediatrics. 1995;95:323–330
2. Hughes RG, Hunt SS, Luft HS. Effects of surgeon volume and hospital volume on quality of care in hospitals.Med Care. 1987;25:489 –503 3. Luft HS. The relation between surgical volume and mortality: an
ex-ploration of causal factors and alternative models.Med Care. 1980;9: 940 –959
4. Luft HS, Hunt SS, Maerki SC. The volume-outcome relationship: prac-tice makes perfect or selective referral patterns?Health Serv Res. 1987; 22:157–182
5. Hannan EL, O’Donnell JF, Kilburn H Jr, Bernard HR, Yazici A. Inves-tigation of the relationship between volume and mortality for surgical procedures performed in New York State hospitals.JAMA. 1989;262: 503–510
6. Hannan EL, Kilburn H Jr, Bernard H, O’Donnell JF, Lukacik G, Shields E. Coronary artery bypass surgery: the relationship between in-hospital mortality rate and surgical volume after controlling for clinical risk factors.Med Care. 1991;29:1094 –1107
7. Hannan EL, Kilburn H Jr, Bernard HR, Shields EP, Lindsey ML, Yazici A. A longitudinal analysis of the relationship between in-hospital mor-tality in New York State and the volume of abdominal aortic aneurysm surgeries performed.Health Serv Res. 1992;27:517–542
8. Hannan EL, Siu AL, Kumar D, Kilburn H Jr, Chassin MR. Explaining declining CABG surgery mortality in New York: the role of surgeon volume.JAMA. 1995;273:209 –213
9. Luft HS, Garnick DW, Mark DH, McPhee SJ.Hospital Volume, Physician Volume, and Patient Outcomes. Ann Arbor, MI: Health Administration Press; 1990
10. Chassin MR, Hannan EL, DeBuono BA. Reporting medical outcomes publicly. Benefits and hazards.N Engl J Med. 1996;334:394 –398 11. Hannan EL, Kilburn H Jr, Racz M, Shields E, Chassin MR. Improving
the outcomes of coronary artery bypass surgery in New York State.
JAMA. 1994;271:761–766
DOI: 10.1542/peds.101.6.963
1998;101;963
Pediatrics
Williams
Edward L. Hannan, Michael Racz, Rae-Ellen Kavey, Jan M. Quaegebeur and Roberta
In-hospital Mortality
Pediatric Cardiac Surgery: The Effect of Hospital and Surgeon Volume on
Services
Updated Information &
http://pediatrics.aappublications.org/content/101/6/963
including high resolution figures, can be found at:
References
http://pediatrics.aappublications.org/content/101/6/963#BIBL
This article cites 10 articles, 1 of which you can access for free at:
Subspecialty Collections
http://www.aappublications.org/cgi/collection/cardiac_surgery_sub
Cardiac Surgery
http://www.aappublications.org/cgi/collection/cardiology_sub
Cardiology
http://www.aappublications.org/cgi/collection/surgery_sub
Surgery
following collection(s):
This article, along with others on similar topics, appears in the
Permissions & Licensing
http://www.aappublications.org/site/misc/Permissions.xhtml
in its entirety can be found online at:
Information about reproducing this article in parts (figures, tables) or
Reprints
http://www.aappublications.org/site/misc/reprints.xhtml
DOI: 10.1542/peds.101.6.963
1998;101;963
Pediatrics
Williams
Edward L. Hannan, Michael Racz, Rae-Ellen Kavey, Jan M. Quaegebeur and Roberta
In-hospital Mortality
Pediatric Cardiac Surgery: The Effect of Hospital and Surgeon Volume on
http://pediatrics.aappublications.org/content/101/6/963
located on the World Wide Web at:
The online version of this article, along with updated information and services, is
by the American Academy of Pediatrics. All rights reserved. Print ISSN: 1073-0397.