Analysis of Different EMG signals by
Segmentation,Classification and Feature
extraction phase
Deepika Chaudhary1 , Dr. A.k Wadhwani2
1
ME student, Dept. of electrical & Engineering(MITS,Gwalior)
2
Professor,Dept. of electrical & Engineering(MITS,Gwalior) [email protected]
ABSTRACT:
EMG signal is a complicated signal, which is controlled by the nervous system.Quantitative analysis in clinical electromyography (EMG) is very desirable because it allows a more standardized, sensitive and specific evaluation of the neurophysiological findings, especially for the assessment of neuromuscular disorders.. In this study, we have investigated that, The analysis of different electromayography signals (NOR & MYO). This paper basically deals with the basic steps for recording ,analysis of EMG signal,.For recording of EMG of a muscles or facial muscles two electrodes are used one is surface electrodes and second one is needle electrode,after comparing both electrodes we found surface electrode is better than needle electrode .The analysis the EMG signal during three phase segmentation ,classification and feature extraction.We extracted both time domain (TPDs) and frequency domain parameters (FDPs),by which we get some important information of MUAP abnormality and muscular change.and we also concluded its best application for
recognition of Facial Expression .Facial expression analysis is rapidly becoming an area of intense interest in
computer science and human-computer interaction design communities. The most expressive way humans display emotions is through facial expressions.
KEYWORDS: Signal, Recording setup, MUAP, Segmentation and classification, feature Extraction
INTRODUCTION:
STRUCTURAL reorganization of the motor unit, the smallest functional unit of muscle, takes place because of disorders affecting peripheral nerve and muscle. Motor unit morphology can be studied by recording its
electrical activity, the procedure known as electromyography (EMG). The study of electromyographic (EMG)
signals is a study of the electrical properties and activities of muscle tissue. EMG signals are detected by placing an electrode into, or over a muscle and detecting the extracellular voltages produced by the electrical activity of
the muscle fibres. The analysis of EMG signals detected during muscle contraction provides important
information to aid in the diagnosis and characterization of neuromuscular disorders. Clinical electromyography is the study of the function of the neuromuscular system through the analysis of EMG signals. In general, the characteristics of EMG signals are
dependent on a number of factors, including the anatomical and physiological of the related neuromuscular system, the level of muscle contraction, the type of electrode used and the location of the electrode relative to the contracting muscle fibers . Basically the analysis of the EMG signal is based on its basic constituent i.e. motor unit action potentials (MUAPs) .The motor unit is the smallest functional unit of a muscle which can be activated voluntarily.It consist of group of muscle fibers which are innervated from the same motor nerve. With increasing muscle force, the EMG signal shows an increase in number of activated MUAPs recuited at increasing firing rate, making it difficult for neurophysiologist to distinguish individual MUAP waveforms. Emg signals are the superposition of multiple motor unit action potentials (MUAPTs).
.
[fig-1] Physiological & Anatomical structure of muscle fibers [Fig-2] Nerve conduction response
The physiological and Anatomical structure of muscle fiber shows in (Fig-1).muscles can made by the group of number of muscles fiber & tissues. Single muscle fiber potentials arrive with mutual time differences at a plane normal to the muscle axis. This is attribute to propagation times in the terminal nerve endings, neuromuscular transmission delays at the motor end plates. In (Fig-2) we can see that the conduction response of the nerve ,here two types of conduction are showing, upper one is normal condition and lower one is diseased conduction. In diseased conduction the nerves are damaged which resulting poor nerve nerve condution.
The information extracted from the EMG recordings is of great clinical importance and is used for the diagnosis and treatment of neuromuscular disorders .
RECORDING SETUP
For the recording of the EMG signal we have two electrodes :Surface electrode and Needle electrode. Both
electrodes are having some advantages and disadvantages like Surface electrodes are Quick easy to apply on muscle, No medical supervision required, Minimal discomfort but Generally used only for superficial muscles
and also cross-talk concerns. and if we talk about Needle electrodes, used for Recording single muscle activity,
Access to deep musculature , Little cross-talk concern as comparison to Surface electrodes. Before starting with
a detailed instruction of the participant, the electrodes are applied. The skin at the electrode positions is prepared with alcohol to reduce skin impedance and increase electrode adhesion. Then, the electrodes are filled electrolytic gel and attached with a glue ring. The connection cables between amplifier and electrodes are affixed behind the ear to reduce irritations of the subject and to minimize potential distortions through equipment movements. The electrodes are placed. During recording, the subject sits alone in a quiet room, in order to reduce environmental disturbances through distraction by other persons. The room includes a minimum of electrical equipment to reduce ambient electromagnetic noise.
Due to overlapping of MUAPs in the EMG signal, physicians have great difficulty in classifying superimposed waveforms and have no valid reason for their conclusions. With the help of decomposition technique, it is possible to provide accurate information of MUAPs.
DATA ACQUISTION
Fig-3 EMG raw signal
METHODOLOGY
Segmentation :
Due to the sensitive nature, EMG signals can easily be influenced by external noise sources and artifacts. This will in turns yield very poor classification result. Most of the noise, artifacts and interference that may contaminate EMG signals can be classified as electrode noise, motion artifacts, power line noise, ambient noise, and inherent noise in electrical & electronic equipments. The goal of the segmentation is to divide the EMG signals into inactive and active segments. The segmentation is only possible only for cases where the main peak of an MUAP is not distorted by overlapping by some parts of other MUAPs, because the selection of superimposed candidates is based on the amplitude of this peak. Decomposition of an EMG signal consists of several stages of signal processing. The EMG is separated in to active segments with low activity and active segments containing motor unit action potentials. With the help of Active segments and a cluster-analysis technique, the number of similar types of motor units are extracted. The segmentation technique calculates threshold depending on maximum value of the complete signal. All peaks over the calculated threshold (Th) are considered as the candidate MUAPs. The threshold is taken as Maximum peak of the signal /5. In this work a window with a constant length of 400 sample points is applied and centered at the identified peak. If another peak is found in the window, the window is centered at greater peak ; otherwise ,400 points are saved as candidate waveform. Generally speaking, lower value of threshold may generate
Extra number of peaks and tend to increase error.
Fig-(i) NOR Subject Fig(ii) MYO Subject Fig(iii) MND subject
Fig-4 Segmented waveform of 400 window size NOR , MYO & MND
On the other hand, if threshold is higher, it may generate less number of groups and increases the error ,which results fails to distinguish the spikes of different motor units. Here we shows the segments of NOR, MYO and
0 0.5 1 1.5 2 2.5 3 3.5 4
x 104 -6000
-4000 -2000 0 2000 4000 6000 8000 10000 12000
0 50 100 150 200 250 300 350 400 450
-400 -300 -200 -100 0 100 200 300
0 50 100 150 200 250 300 350 400 450
-300 -200 -100 0 100 200 300 400
0 50 100 150 200 250 300 350 400 450
CLASSIFICATION:
The common feature for classifying intramuscular EMG signal is the Euclidean distance between the MUAP waveforms. For clinical interests, the main feature of the EMG signal is the number of active motor unit (MUs), the MUAP waveforms, and the innervations time statistics. According to Wellig and Moschytz (58), the determination of the MUAP waveform and the number of active MUs can be considered as a classification problem. The superimposed MUAPs generated by multiple neurons is difficult to detect clean MUAPs. Several methods have been developed in the past to detect the superimposed MUAPs. For the recording purpose some type of special electrodes are used these electrodes are placed directly inside the muscle near the motor unit. As per literature survey, it has been found that to obtain clean MUAPs, the statistical pattern recognition , cross correlation coefficients, wavelet transform and Kohonen self-organizing feature map methods can be used. In classification phase the segmented sample window of 400 sample points, divide in to different classes according to same shape and these classes shows the classification of EMG signal. Then averaging the overlapped MUAP of classes.
FEATURE EXTRACTION
Time Domain Parametres (TDPs):
1-Duration: For finding the duration of MUAPs , the beginning and ending of the MUAP identified by sliding a measuring window of length 1ms and width 10µv is taken as duration.
Duration = (i1- i2)/sampling frequency
Where i1,i2 are the starting and ending sample points of the MUAP
2-Spike Duration: The spike duration is the period from the first positive peak to last positive peak of the
MUAP . Take the kth point and compare the proceeding points (k-1) and following point (k+1). If absolute
magnitude of the kth point is greater than (k-1)th and (k+1)th points, then store kth point as a peak. Let k1 and k2
be the first and last identified +ve peaks.
Spike duration = (k1-k2) /Sampling frequency
3-Amplitude: The difference between the maximum positive peak and the minimum negative peak is taken as the amplitude of MUAP.
Amplitude= M1+M2
4-Area: The addition of all magnitude of all sample points and multiply it by the duration of that MUAP.
Frequency Domain Parameters (FDPs):
1-Median frequency (FMED):
2-Maximum frequency (F0) :
3-Bandwidth (BW) : 4-Quality factor (Q) :
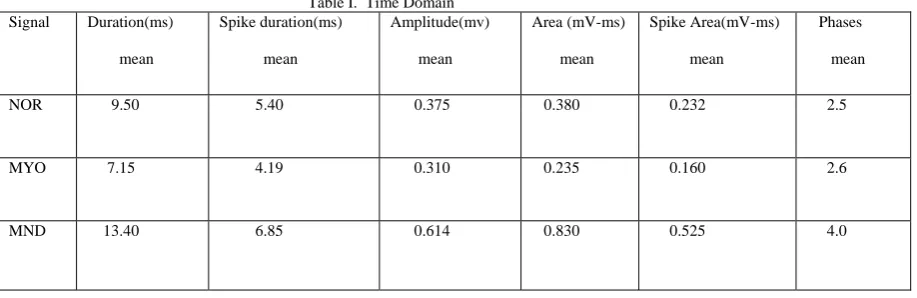
Result: TIME DOMAIN & FREQUENCY DOMAIN PARAMETERS
Table I. Time Domain Signal Duration(ms)
mean
Spike duration(ms)
mean
Amplitude(mv)
mean
Area (mV-ms)
mean
Spike Area(mV-ms)
mean
Phases mean
NOR 9.50 5.40 0.375 0.380 0.232 2.5
MYO 7.15 4.19 0.310 0.235 0.160 2.6
Table. II Frequency Domain
Signal Median frequency(HZ)
mn
Maximum frequency.
(HZ) mn
Bandwidth (HZ)
mn
Quality factor
mn
NOR 412 211 525 0.47
MYO 625 408 762 0.65
MND 338 210 380 0.72
Conclusion:
In this paper, we have examined EMG signals which are signals in a living body for recognition of neuromuscular disorder . We extracted features duration, spike duration, amplitude, area, spike area, phase , maximum frequency, median frequency ,bandwidth and quality factor of each signal [3] . After the extraction of feature we can get information about the neuromuscular disorder or normal healthy EMG signal. We also wanted to conclude that another phase of EMG signal, their applications . We can use Electromayography for the recognition of Facial expression .With the help of EMG signal we can also examine facial disease and disorders
FUTURE WORK
A neural-network-based decision making tool was developed for online classification of various neuromuscular diseases. The problem was to design an automatic classification system based on signal processing techniques such as autoregressive modeling. Using any one method, the probability density function of the features of the various patient groups often overlap and were difficult to classify based on the features of a single method. It was therefore necessary to develop a tool which would use all the quantitative features from each signal processing method and combine the human expertise to provide an expert decision to classify different pathologies. An attempt has been made to solve this problem using an artificial neural network.
References :
[1] R. S. LeFever and C. J. De Luca, “A procedure for decomposing the myoelectric signal into its constituent action potentials,” IEEE Trans. Biomed. Eng., vol. BME-29, pp. 149-153; pp 158-164, March 1982.
[2] S. Boisset, F Goubel, “Integrated electromygraphy activity and muscle work,” J Applied Physiol, vol 35, pp. 695-702, 1972.
[3] EMG Signal Feature Extraction Based on Wavelet Transform K. Mahaphonchaikul, D. Sueaseenak, C.Pintavirooj, M. Sangworasil, Faculty of Engineering, King Mongkut’s Institute of Technology Ladkrabang (KMITL), Bangkok, Thailand 10520.
[4] M. H. Hassoun, C. Wang and A. R Spitzer, ‘“NERVE: Neural network extraction of repetitive vectors for elektromyography,” IEEE Trans. Biomed. Eng., vol. 41, pp.1039-1061, Nov. 1994.
[5] J. Basmajian, C.J. De Luca, Muscle Alive Their functions revealed by electromyography, Williams Wikins (Eds), Baltimore 1985. [6] M. Aminoff, Electromyography in clinical practice 3rth Edition (Ed) Churchill-Livingstone, New York, 1998.
[7] G. A. Bekey, C Chang, J Perry, M.M. Hoffer,” Pattern recognition of multiple EMG signal applied to the description of human gait,”
[8] M.B.I. Raez, M.S. Hussain, and F. Mohd-Yasin “Techniques of EMG signal analysis: detection, processing, classification and