Lincoln
University
Digital
Dissertation
Copyright
Statement
The
digital
copy
of
this
dissertation
is
protected
by
the
Copyright
Act
1994
(New
Zealand).
This
dissertation
may
be
consulted
by
you,
provided
you
comply
with
the
provisions
of
the
Act
and
the
following
conditions
of
use:
you
will
use
the
copy
only
for
the
purposes
of
research
or
private
study
you
will
recognise
the
author's
right
to
be
identified
as
the
author
of
the
dissertation
and
due
acknowledgement
will
be
made
to
the
author
where
appropriate
you
will
obtain
the
author's
permission
before
publishing
any
material
from
the
dissertation.
The Application of Cost-Based Value Stream Mapping
to a Container Loading Analysis
A Dissertation
submitted in partial fulfilment
of the requirements for the Degree of
Bachelor of Commerce with Honours
at
Lincoln University
by
Tiffany McIntyre
Lincoln University
Abstract of a Dissertation submitted in partial fulfilment of the
requirements for the Degree of Bachelor of Commerce with Honours.
Abstract
The Application of Cost-Based Value Stream Mapping
to a Container Loading Analysis
by
Tiffany McIntyre
Lean production emerged in the 1990’s as an academic term, with the publication of the book ‘The
Machine that Changed the World’. The philosophy was born out of the Toyota Production System,
with the objective to eliminate waste within firms. Originally applied to the manufacturing industry,
the philosophy has been applied to other industries such as services and healthcare with varying
levels of success. However, to date, very little research has been conducted in the agricultural sector.
The aim of the study is to use the Lean tool Value Stream Mapping to determine its ability to improve
performance within a logistics setting, through conducting a cost analysis on container utilisation for
an existing New Zealand dairy company. A case study methodology was used in the study to draw a
non-traditional Value Stream Map, which was then used to conduct the cost analysis. The results of
the project suggest that container utilisation could be improved through reducing the pallet weight
load.
Acknowledgements
I would like to acknowledge Westland Milk Products and the staff that provided me with the
information for this dissertation. Thank you for the invaluable opportunity you have provided me
with to work alongside a great New Zealand company with such a rich history and exciting future. I
was made to feel welcome and part of the team which is more than anyone could ask for. I would
like to specially thank J. Kenny, J. Dwyer, S. Scott and C. Murcott. You took the time to answer my
many emails and phone calls, and for that I sincerely thank you and hope that this project will be
useful to your firm.
I would like to thank the Faculty of Agribusiness and Commerce here at Lincoln University for the
opportunity undertake this degree and a special thank you to all the lecturers of the courses I took a
postgraduate student. Your input into my study has been invaluable.
Thank you to my family for your encouragement over the year and a special thank you to my twin
Brittany for your time and your kind words when needed. I could not ask for a better support group.
Finally, an incredibly humble thank you to Jeff Heyl. Your knowledge and enthusiasm for the area of
Lean Manufacturing has been inspiring. Thank you for the long hours and effort that you have put
into my project this year. I am truly grateful for the knowledge that you have imparted and the
Table of Contents
Abstract ... i
Acknowledgements ... ii
Table of Contents ... iii
List of Tables ... v
List of Figures ... vi
Chapter 1 Introduction ... 1
1.1 Research Purpose ...2
1.1.1 Project Aim ... 4
1.1.2 Objectives ... 4
Chapter 2 Literature Review... 5
2.1 Description of Milk Processing ...5
2.1.1 Heat treatment and separation ... 5
2.1.2 Centrifugal milk separation ... 6
2.1.3 Milk drying ... 7
2.2 Product Freight Considerations ...8
2.2.1 Containers ... 8
2.2.2 Product packaging ... 9
2.2.3 Palletisation and loading ...10
2.2.4 Warehouse design ...10
2.3 Value Stream Mapping ... 11
2.3.1 Perceptions of value stream mapping ...12
2.3.2 Implementation of value stream mapping ...12
2.3.3 Outcomes of value stream mapping ...13
2.3.4 Developments of value stream mapping ...14
2.4 Conclusion ... 15
Chapter 3 Methodology ... 17
3.1 Research Design ... 17
3.2 Case Selection ... 18
3.3 Research Methodology ... 19
3.3.1 Background research ...19
3.3.2 Developing a research method ...20
3.3.3 Data gathering and analysis ...20
3.3.4 Reporting ...20
3.3.5 Dialogue and final report ...21
3.4 Summary ... 21
Chapter 4 Results ... 22
4.1 Value Stream Map ... 22
4.1.1 Value stream map symbols ...23
4.1.2 Cost calculations ...24
Chapter 5 Discussion and Recommendations ... 32
5.1 The Analysis ... 32
5.2 The Case Study Method ... 33
5.3 Value Stream Mapping ... 34
5.4 Contributions, Limitations and Future Research ... 34
Appendix A Report for Westland Milk Products ... 36
List of Tables
Table 1: Summary of handling and transportation costs ...24
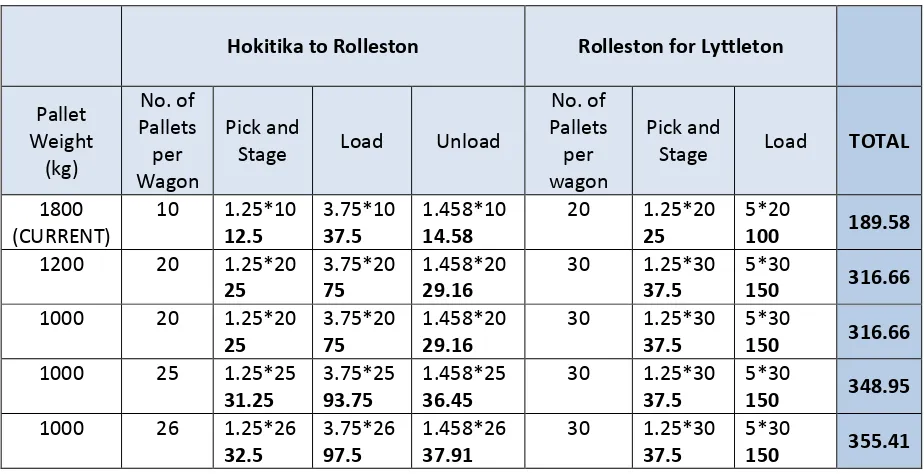
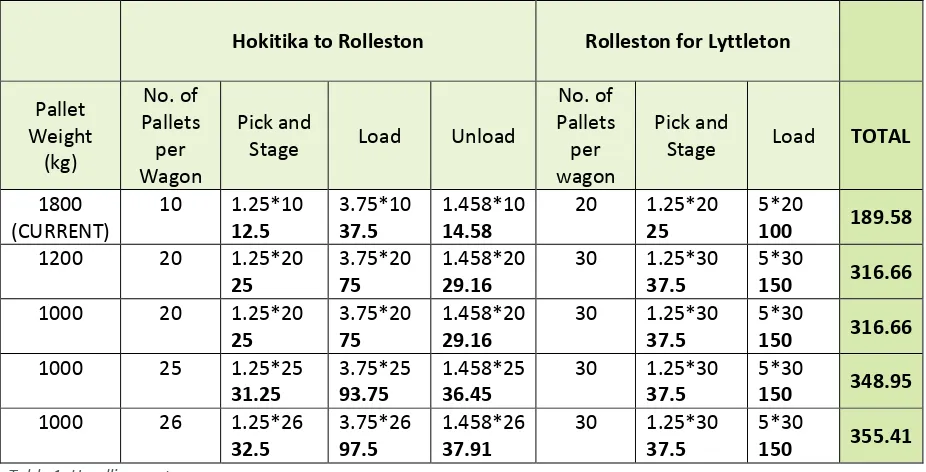
Table 2: Handling costs per wagon ...29
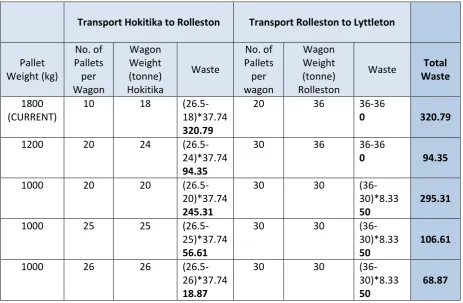
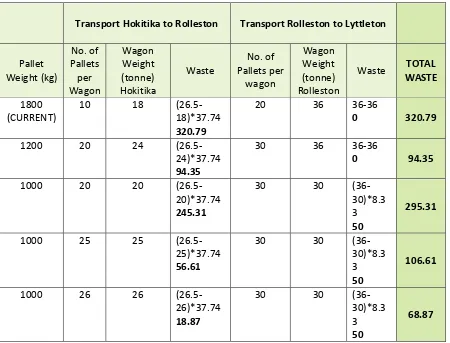
Table 3: Cost of wagon waste ...30
List of Figures
Chapter 1
Introduction
In the current business environment firms are forced to become more competitive and aware of
customer needs to survive. In the recent economic recession many firms were forced to downsize, or
were forced out of business altogether. This highlights the need for firms to implement continuous
improvement both internally and within a supply chain context (Keyes, 2013). One of the most
prominent business philosophies that centre on this ideology is Lean. Lean production offers a way
for firms to introduce continuous improvement through focusing on customer value and elimination
of waste throughout the various processes within a firm. This helps to improve efficiency within the
organisation and ultimately the supply chain. The merits of this philosophy, coupled with a curiosity
of supply chains has been the inspiration for the scope of this project.
Lean production as we know it today emerged as an academic term in 1990 with the publication of
Womack, Jones & Roos’ book entitled ‘The Machine that Changed the World’. The main goal within
the philosophy is the elimination of waste, or Muda, to facilitate perfect value for the end consumer
(Lean Enterprise Institute, 2009; Ohno, 1988; Zokaei & Simons, 2006). More specifically, Muda is one
of three forms of waste and refers to a wide range non-value-added activities, such as holding old
stock. The roots of Lean extend from Henry Ford’s perfection of the mass production line through
standardisation and the moving assembly line. Ford’s desire was to produce an automobile that was
affordable for the masses. To achieve this, Ford developed precision machinery that led to
standardisation and the effective use of interchangeable parts (Womack, Jones & Roos, 1990).
Taiichi Ohno, Toyota’s production engineer, built on Ford’s work. He recognised that Toyota would
not be able to compete in the automobile market using the large batch sizes that the dominating
manufacturers used. Thus, Ohno set out to develop a system that would eliminate waste and create
value for the customer (Liker, 2004). This new system was aptly named the Toyota Production
System (TPS). The system moved the focus of production from the machines to the flow of materials
through the assembly line. The result was an ability to drive out waste, maintain a wide product
range, manufacture in small batches and compete on cost (Holweg, 2007).
The ability of Lean production to drive out waste and to deliver value to the customer rests in its
combination of both craft and mass production, i.e. avoids the high cost of craft production while
simultaneously avoiding the rigidity of mass production. Hence, Lean production offers flexibility in
terms of manufacturing what the customer demands, with the ability to do so on a large scale
where many of the early published works of Lean lie. In recent years as the merits of Lean have been
recognised and academics and practitioners have begun to adopt the philosophy in other industries.
This is particularly true in the case of service industries, such as the healthcare sector (Jones, 2006;
Radnor, 2012; Holweg & Waring, 2012). However, to date, very little research has been conducted in
the field of agriculture/agribusiness. As agriculture is New Zealand’s largest export sector (Ministry
for Primary Industries (MPI), 2013), it seems appropriate that this be the area of focus within the
study.
1.1
Research Purpose
New Zealand is an isolated nation near the bottom of the Pacific Ocean. The population is small
compared to the landmass, with the majority of the population living in urban areas. This, coupled
with the temperate maritime climate and abundance of natural resources, such as water, has led to
the country being able to produce a surplus of agricultural products with a low cost competitive
advantage. The major implication of this is that New Zealand has come to rely on exports. Thus, there
is a major supply chain component present in business and good supply chain management is crucial
for an exporting firm. The majority of exports are produced in the primary sector and are sold on the
world market as commodities. This is of great significance because it means that firms must
effectively manage their supply chains in such a way as to keep export costs low. All of which is in a
bid not to pass additional costs on to the consumer.
During an undergraduate degree in Agribusiness at Lincoln University, the concept of Lean was
introduced throughout a number of courses. The described benefits of Lean indicated that it has
huge potential in New Zealand. The benefits largely rest with the idea that Lean leads to continuous
improvement of business processes, yet the end consumer still remains the centric focus of the firm.
However, a more in-depth investigation into Lean implementation in New Zealand reveals a
disappointing trend; Lean is mostly carried out in manufacturing firms and healthcare services, with
little research in the service industry and next to none in agriculture. Within agribusiness the concept
was briefly discussed in relation to creating value chains, however this is where the discussion of
Lean ended.
Dairy production in New Zealand is worth $10.4 billion in annual export earnings (NZIER, 2010). In
terms of exports, the New Zealand dairy sector accounts for 26% of the country’s merchandise
exports and one third of world dairy trade – the world’s number one exporter (New Zealand Trade &
Enterprise, 2013). This makes the dairy industry hugely valuable to the New Zealand economy. In
addition to these notable impacts, the dairy industry’s influence on the economy extends beyond
the industry provides 35,000 jobs (excluding the self-employed) and in 2009 dairy injected over $700
million into the Southland district economy (NZIER, 2010).
Despite the aforementioned benefits, the dairy industry is not without its fair share of issues. These
range from environmental to supply chain problems. One particular environmental concern that
impacts the dairy industry greatly is greenhouse gasses. Although carbon is recycled, about 1% of
converted carbon dioxide is recycled by cattle and dispersed back into the atmosphere as methane, a
potent greenhouse gas, around 25 times more harmful than carbon dioxide. The impact is further
amplified in a nation like New Zealand where livestock are farmed and fed on pasture. Animal
excrement and fertiliser application to paddocks contains nitrous oxide, which is also a potent
greenhouse gas (NIWA, 2013). This is often leached through the soil, resulting in not only losses of
soil fertility but also pollution (Cameron, Di, Moir, Christie & Pellow, 2005). The environment is of
great concern to all people and will remain a heated topic for years to come.
Many livestock issues also vary from region to region. For example, facial eczema is found mostly in
the North Island of New Zealand where the temperature and humidity is often higher. This problem
is caused by ingested fungal spores growing on pasture. The spores produce a toxin that causes liver
damage and also damages bile ducts. The result of which is reduced production and sometimes
death (DairyNZ, n.d.). Other, more localised problems such as deficiencies and sickness are often
related to the immediate environment and the mineral composition of the soil.
In terms of supply chain issues, there are generic business supply chain management issues present
as well as more specific issues, particularly around logistics. Many generic issues relate to the
marketing mix that a firm will adopt as well as other factors such as supply chain collaboration. While
these are very valid and important concerns, they are not the primary focus of this research project.
Logistics issues on the other hand are, and these vary within each area of New Zealand. For example,
in the South Island one of the two major ports is located on the East Coast of the island in Lyttleton,
Christchurch. The West Coast produces around 3% of the country’s total milk production and is home
to New Zealand’s third largest dairy company (LIC & DairyNZ, 2011; Coriolis, 2011). However, the two
coasts are separated by the Southern Alps. This creates some very obvious logistical difficulties that
must be overcome, i.e., how to ship product in the most efficient and cost-effective way possible
from one coast to the other. This project will explore this problem more thoroughly with the help of
1.1.1
Project Aim
The aim of this research is to conduct a case study analysis of a dairy firm’s transport process using
the Lean tool Value Stream Mapping. The intent is that this project will add to current understanding
of this tool and its usefulness to logistics processes within a firm.
A secondary aim of this project is that the firm featured within the case study will be able to benefit
from the findings of the research. The analysis results will be fully available to the firm to aid in the
process of double stacking pallets within shipping containers.
1.1.2
Objectives
The goals of this project are:
To understand the milk drying process and the implications that different milk drying
technologies and milk properties have on bulk density variability
To gain an understanding of factors involved in freight transport
To understand the Value Stream Mapping process and how it is currently used within
manufacturing
To analyse how Value Stream Mapping can be applied to a logistics setting and conduct a
Value Stream Map analysis
To determine whether Value Stream Mapping has the ability to improve performance within
a logistics setting through analysing its usefulness for an existing New Zealand dairy firm
To report back to the firm on the findings of this project in terms of efficient transport of
Chapter 2
Literature Review
The aim of this literature review is not only to summarise literature within the context of this project
but also to aid in satisfying the first three objectives of this research project. A review of past and
present literature was conducted to gain an understanding of the milk drying process, considerations
that need to be made when freighting product, and of Value Stream Mapping. The review assumes
no previous knowledge of the topics at hand.
2.1
Description of Milk Processing
Raw milk produced on dairy farms must be transported to a dairy processing plant and treated
before it enters the market. Processed milk is most commonly sold on the world dairy market as a
commodity powder product to be used as an ingredient in consumer products (Fonterra, 2013).
Thus, literature in this section is focused on the transformation of the raw milk to a finished powder
product after it arrives at a factory and is placed into raw milk silos.
2.1.1
Heat treatment and separation
The pasteurisation process, in short, is a thermal treatment applied to the raw milk (Ibarrola,
Sandovai, Garcia-Sanz & Pinzolas, 2002). Walstra, Wouters & Geurts (2006) noted that the heat
treatment of milk is important for three main reasons. Firstly, heat treatment helps to kill bacteria
that may otherwise be harmful to the consumer. Furthermore, it is specifically concerned with
destroying pathogens such as Mycobacterium tuberculosis, Salmonella strains, Coxiella burnetii,
Staphylococcus aureus, Listeria monocytogenes and Camplobacter jejuni. Raw milk also contains
bacilli and streptococci, which, when in high numbers can reduce the milk pH and decrease its heat
stability (Lewis, 1986). Secondly, heat treatment increases the keeping quality of milk. Spoilage
organisms are killed and enzymes excreted by microorganisms or enzymes native to the milk, are
inactivated. This can improve the shelf life of up to six months. Thirdly, heat treatment establishes
specific product properties. For example, heat treatment is used to increase coagulation stability of
evaporated milk during sterilisation. Lewis (1986), added that a milder heat treatment of milk, such
as low pasteurisation, also helps to change the flavour profile of milk. It can correct odd aromas and
off-flavours that can be present due to things such as weed taints.
Batch pasteurisation
Batch pasteurisation is the simplest and oldest pasteurisation method and involves heating the milk
jacketed vat surrounded by either water, steam or heating coils of water and steam and must be
constantly agitated for the 30 minutes. After this the milk is cooled either in situ, or removed from
the vat and cooled elsewhere (Goff, 1995). Due to the nature of the process, commerciality of batch
pasteurisation is low. The process is more labour intensive than high-temperature short-time
pasteurisation and also the energy costs are higher (Lewis, 1986). Generally, it is limited to on farm
use for dairy farmers to feed to young stock before weaning (Godden et al, 2003; Stabel, 2001).
High-temperature short-time pasteurisation
High-temperature short-time pasteurisation occurs when the raw milk is heated to 72 degrees
Celsius for 15 seconds and immediately cooled to a temperature of no more than 10 degrees Celsius
(Lewis, 1986). Currently, continuous flow heaters are typically used. The milk is fed into the heating
section of the plate heat exchanger. This is a series of stainless steel plates placed together. In
between the plates are a series of tubes where the heating agent (usually steam) and the milk flow
separately. A plate heat exchanger is made up of four different sections; a regeneration, heating,
holding and cooling section. The regeneration section warms the milk to between 57 and 68 degrees
Celsius before flowing into the heating chamber. Here the milk is heated to 72 degrees Celsius (the
required pasteurisation temperature). Milk then enters the holding tube where, after 15 seconds,
will pass through to the regeneration section where the cold milk and hot milk act against each
other, i.e. the heat from the hot milk warms the cold milk and vice versa. Finally the milk flows
through to the cooling stage where a coolant or water brings the temperature of the milk down to
the required heat (Walstra et al 2006; White, 2010).
2.1.2
Centrifugal milk separation
Separation of the milk into cream and skimmed milk enables standardisation of fat content prior to
spray drying (JWC, 2014). This is easily achieved by centrifugal separation (the most common method
of separation) as the fat globules of milk are much lighter in density than the fat free fraction of milk.
The output of this process is cream and skim milk. In addition, applying ultrafiltration to the fat free
portion of the milk in the separation phase will separate milk proteins from other components of the
milk. The implication of this is that the protein content of the skim milk can be standardised for
further processing (Jelen, 2011). McCarthy (2011) explained that in the context of the dairy industry,
centrifugal separation refers to both centrifugation and cyclone separation; the difference of which
rests in the machinery utilised. In terms of centrifugation, separation occurs in centrifuges with
power driven rotating bowls. Cyclone separation on the other hand, occurs where the milk is
fractionated, but no part of the machine rotates. However it should be noted that cyclone separation
Raw milk is fed into the top of the rotating bowl. When the bowl reaches rotational speed, the force
of gravity is overcome by centrifugal force, which is 5000 to 1000 times greater than gravity. Every
particle is subjected to this force, with the lighter molecules (fat globules) being forced towards the
axis of rotation. A number of angled discs (approximately 60 degrees) lie within the bowl and are
known as ‘disc stacks’. These act as separation channels. Fat globules are captured on the upper
surface of the discs and forced inwards, whilst the skim milk is captured on the lower surface of the
discs and channelled outwards (O’Mahoey, 1988; Towler, 1986). From this point the skim milk and
cream are transported into separate vats to be used again in future stages of the transformation
process.
2.1.3
Milk drying
Milk drying is the process where the liquid milk is dried into a powder form. This is achieved by using
large driers. The two main spray drying technologies used within the dairy sector are a centrifugal
disc and a pressure nozzle (JWC, 2014). However, although not the focus of this literature review,
there are other dryers available on the market such as drum drying, foam drying and freeze drying
(Walstra et al, 2006). To spray dry milk, small droplets are sprayed into hot air and instantaneously
transformed into powder particles (Walstra & Jenness, 1984). In order for this process to happen the
milk is atomised (essentially turned into fog-like mist) to create a large surface area. The milk is then
exposed to a flow of hot air where the liquid is evaporated, leaving behind only powder (Knipschildt,
1986).
Throughout the process of milk drying there are many sources of variation present:
Preheating of the milk
Degree of pre-concentration
Pressure nozzle or spinning disk to produce droplets
The pressure, and disk speed
Temperatures of the air at the start and end of drying (Walstra & Jenness, 1984)
During disk atomisation, the disk spins at 200-300 revolutions per second. The advantage of this is
small droplets, no clogging and disk atomisation is still possible when processing highly evaporated
milk. However, a large number vacuoles are formed in the particles and the chamber must be wide in
order to prevent the droplets from touching the wall (Walstra et al, 2006). Vacuoles increase the
porosity of the powder and reduces the bulk density. Pressure nozzles on the other hand, force the
milk out of a small opening by using large amounts of pressure. The advantage of this is that vacuole
content is low. However, because the opening is small the pressure nozzles become easily clogged
et al., 2006). It can be seen by this that the two dryers clearly have different purposes. Considering
that most dairy processing plants contain more than one drier it is possible that this could cause
some issues around product standardisation.
2.2
Product Freight Considerations
There are five main transportation modes for goods: airfreight, motor carriers, pipelines, railroads
and by water. In terms of this project, railroads, are the main focus as the majority of milk powder in
the South Island is transported from the West Coast to the East Coast using trains. Rail transport is
ideally suited to low value bulk goods and provides a relatively inexpensive form of land transport
(Fawcett, Ellram & Ogden, 2007). However, Murphy and Wood (2011) argued that while this is the
case, there is often limited service and pricing options as due to the lack of competition in the market
place. Indeed, in New Zealand KiwiRail is the only major rail company. Based on these factors, in
terms of a firms logistics operations, this means that there is very little opportunity to improve
transport costs. Therefore the firm must look at loading efficiency, particularly around container
utilisation.
Containerisation has revolutionised the way that goods are transported. They have allowed bulk
transportation of goods to the global marketplace. It has even been suggested that containerisation
has been the largest driver of global growth over the last 50 years (Levinson, 2006; The Economist,
2013). These steel boxes first emerged in the United States of America in 1956, and ten years later
the Fairland sailed from Port Elizabeth in the United States to the Netherlands with 236 containers
on board, marking the first intercontinental shipment (World Shipping Council, 2014). Since the
introduction of containers the industry has grown exponentially with around 2 billion tons of cargo,
through more than 500 ports being shipped annually (Ham & Rijsenbrij, 2012). In order for a firm to
use containerisation as efficiently as possible there needs to be a number of considerations made.
These mainly revolve around the physical container, product packaging, palletisation and loading,
and warehouse design.
2.2.1
Containers
Containers are a “reusable transport or storage unit for moving products and raw materials between
locations or countries” (Shabani, Seyed Mohammed & Reza, 2011). These storage units are generally
made of aluminium or steel and literature shows that there are a variety of container sizes available,
with the most common sizes being 20-foot or 40-foot by 8-foot by 8-foot (Chartered Institute of
Transport, 1995; Desrochers, 2007; OECD, 2002; World Shipping Council, 2014). Higher containers
are called hi-cubes and are typically 9-foot high, however these generally attract a surcharge and are
construction materials and modern information systems, containers are relatively safe. Shabani et al.
(2011) argued that containers provide security because the contents of each container are unknown
to shippers, which discourages theft.
There are many different types of intermodal container. Aside from conventional end opened
containers, the main alternatives are refrigerated containers, tanks, open tops and flat-racks
(Wehrheim, 2011). Refrigerated containers, or reefers as they are more commonly known, are
electricity powered containers. Reefers are required by 31% of the world’s food supply chain as
refrigeration maintains the integrity of perishable goods (Fitzgerald, Howitt, Smith & Hume, 2011;
Jolly, Tso, Wong & Ng, 2000). Tanks are used in the transport of liquids and are generally spherical
containers with a metal frame that meets ISO standards. All tanks are insulated and manufactured
from carbon steel and stainless steel (Fahy & Tiernan, 2001). Open top containers on the other hand
are used to transport goods that are loaded from the top, such as coal, and flat-rack containers carry
goods that can be exposed to the air, such as machinery (Levey, 2001).
2.2.2
Product packaging
Product packaging is important not just for aesthetic and promotional reasons, but also to maintain
product integrity and to provide a stackable stability to aid in palletisation. In the case of New
Zealand produced milk powder, the finished product is typically packaged in a multi-wall bag with an
inner polyethylene line with no staples or metal fasteners used (Fonterra, n.d; Westland
Co-operative Dairy Company, 2013). This allows the milk powder to be distributed evenly throughout
the bag to help with palletisation for shipment. Murphy & Wood (2011) provided a list of several
functions that protective packaging should perform and included functions such as, enclose the
materials, restrain from undesired movements, provide reasonably uniform weight distribution, be
tamperproof, etc.
Over recent years consumer trends have indicated an increasing environmental awareness and
concern for environmentally friendly products and packaging (Russell, 1996; Baker, 2009). The use of
plastic has grown drastically in the last 30 years due to its versatility, low cost and consumer
friendliness over that of paper (Murphy & Wood, 2011). In the case of food products, polyethylene is
the most common type of plastic used. Plastic is viewed as a way to deliver safe food from the farm
gate to the plate. For example, polymers been approved by the Food and Drugs Administration and
used in the United States of America for the decades (American Chemistry Council, n.d). However,
the environmental impacts of plastic cannot be ignored. It is a well-known fact that plastic is not bio
friendly and can take several hundred years to biodegrade. Other problems with plastic packaging
include its dependency on petroleum in manufacturing and the level of plastic litter, particularly in
firms and governments worldwide. For example, in the 1990’s in Germany, the government enacted
a Packaging Ordinance with the intent to avoid the impact of packaging on the environment
(Association of German Chambers of Industry and Commerce, 2013). Other strategies may include
things such as using recycled plastics and using environmentally friendly packaging materials.
2.2.3
Palletisation and loading
One key decision when transporting a containerised product is what sort of pallet to use. The most
common pallets are made of steel, plastic or wood. There are also alternatives to using traditional
pallets, such as slip sheets. Slip sheets are a unit load support device used in place of a conventional
pallet. Typically these sheets are constructed of plastic, fibreboard or solid Kraft board, or are a
corrugated design with two Kraft liner boards forming the outer surface and an adhesively bonded
corrugated interior (Sebastian, 1999). The decision made regarding unit load support depends on the
type of product being transported. Typically, in the dairy industry unit loads are supported by
conventional pallets as they provide a greater stability and keep the product off the floor, thus aiding
in minimising rodent and water damage.
Pallet configuration is a key consideration when palletising a product. The configuration dictates the
pallet load, size, weight and stability. All of these factors are extremely important in transporting the
finished product to the final customer, particularly when ensuring product integrity is maintained
throughout transport. As a result, many studies have been conducted around the pallet problem,
especially in the case of irregular sized packages and creating stability (Kocjan & Holmstrom, 2010;
Martins & Dell, 2008; Steudel, 1993). The mathematics of this type of research is beyond the scope of
this project, however it should be noted that the results of such studies are utilised and developed
into computer programs to aid many organisations in developing stable efficient loads. In addition to
this, palletisation also has a direct impact on loading containers. If the pallet is too high to double
stack then there is unutilised space within the transport container. The same can be said for pallets
that are not loaded to the optimum height. This is inefficient as firms pay the same rate for transport
whether the container is full or not.
2.2.4
Warehouse design
Facility location is of tremendous strategic importance to many firms and so the decision requires
several considerations to be made. These include things such as proximity to major ports and factory,
natural resources, proximity to the customer and population characteristics (Murphy & Wood, 2011).
In the context of dairy processing factories, there are large location restrictions due to factors such as
perishability of the product and transport costs. This means that the proximity to natural resources is
and weight-gaining products. If products lose weight through processing, such as milk, factories
should be located close to extraction of raw supply and warehouses located closer to market
(Murphy & Wood, 2011). Due to New Zealand’s small geographical area and isolated position on the
globe, other location factors such as proximity to customers and to major ports are not as important
to New Zealand exporting dairy companies; especially when a comparison is made between New
Zealand and landlocked exporting dairy producers.
Design considerations of the warehouse or distribution centre are also important. These
considerations pertain to factors such as aisle width and pallet storage systems. Aisle width is the
distance between adjacent racks and is determined by the turning circumference of a forklift and the
size of the pallet (Richards, 2011). Calculating the optimal aisle width is crucial as this decision
determines productivity, space utilisation, flexibility, safety and equipment costs of the specific
application (Piasecki, 2002). Richards (2011) noted that a 2008 study conducted by Baker and Perotti
revealed that there are currently around 11 different pallet storage systems in use today. However,
for the purpose of this literature review only the top three will be noted:
Floor/block storage – the goods are packed in their unit loads and stacked to their maximum
safe height.
Single deep racking – pallets are racked one deep. This is the most common storage method
worldwide and is the most versatile
Narrow aisle racking – the aisle width is reduced to just 1.6 meters. As a result, specialised
forklifts, known as turret trucks are required.
In terms of storing milk powder in a warehouse or distribution centre, often times the floor/block
storage method is used. The shape of the pallets allow for easy stacking and the floor stacking allows
for quick picking when sending product to transport.
2.3
Value Stream Mapping
A study by Radnor, Walley, Stephens & Bucci (2006) assessed the application of Lean in the public
sector in order to evaluate its impact on productivity and/or quality of service. This section of the
literature review has adopted the structure of that piece of research in order to logically provide an
overview of Value Stream Mapping under the three headings perceptions, implementation and
outcomes. Following that is a brief overview of recent developments in Value Stream Mapping
literature pertaining to two developments: Value Stream Costing and the transportation Value
2.3.1
Perceptions of value stream mapping
Many articles have been written about Value Stream Mapping since the emergence of Lean and it is
viewed as one of the most suitable tools to use when undertaking a value stream analysis. Value
Stream Mapping and value stream analysis have become so commonplace within the context of Lean
that the two terms are used interchangeably (Nasution & Nasution, 2013). However, the
fundamental difference between the two is that Value Stream Mapping is a tool to undertake a value
stream analysis, not the analysis itself. Other analysis tools include, but are not limited to, affinity
diagrams, causal mapping, knowledge maps and process flow diagrams (Davies, 2010). Womack
(2006) noted that the objective of drawing the map is to identify each action needed to create value.
When these are carefully recorded it becomes relatively simple to assess performance and identify
waste within a process. This has the potential to be particularly helpful in the context of logistics
because it is one business area where costs are generally quite high.
Value Stream Mapping is commonly undertaken using teams and workshops. The main purpose of
this being that there will be a pooling of knowledge from all functions of the business regarding the
process being analysed (Dickson, Singh, Cheung, Wyatt & Nugent, 2009). Liker (2004) stressed the
importance of people within teams, as they often have extensive knowledge in their respective fields
and are the ultimate drivers of Lean implementation. Indeed, Toyota who have set the benchmark
for today’s Lean, hold people at the core of every aspect of their business. Liker (2004) demonstrated
the importance of people in Toyota through the house of Lean. This “house” is built on the
foundation of the Toyota way philosophy and work processes, and is held up by the pillars of
continuous improvement, quality and just in time processing.
2.3.2
Implementation of value stream mapping
Rother & Shook (1998) described the five phases of Value Stream Mapping. These are:
Selection of a product family
Current state mapping
Future state mapping
Defining a working plan
Achieving the working plan
Just like all foundational works of Lean, this instruction is applied to the area of manufacturing.
However, it can be argued that the process is reasonably generic and thus, can be applied to other
areas such as logistics. The first two phases of Value Stream Mapping are quite clear but phase three
future state map. The authors went on to argue that Lean provides guidelines such as;
“establishment of continuous flow where possible” (p. 41). These guidelines aid users in how the
map should be drawn. Phase four and five of the process of creating a Value Stream Map differ
between each individual project conducted as there is variability in what each project aims to
achieve and also between the people working on the project.
Organisational management is pivotal to the success of any sort of business improvement attempt
and the ‘top down approach’ is well recorded throughout business management literature (Lok,
1997; Su, Yang & Yang, 2012). This can also be applied to Value Stream Mapping. Dickson et al.
(2009) also added that many managers need to alter previously hardened mind sets in order to
implement Lean techniques successfully. Unfortunately this is not as commonly adopted as it should
be and, as a result, many attempts to implement Lean through techniques such as Value Stream
Mapping fail to do so.
2.3.3
Outcomes of value stream mapping
The key outcome of Value Stream Mapping is to improve a process, and by extension, the business.
This is explained consistently across literature, and involves improvements such as improved lead
times, higher productivity and increased quality (Hines, Rich & Esain, 1999; Seth, Seth & Goel, 2008).
These outcome goals do not have to be one large overarching goal to improve every aspect of
business, but instead are able to be smaller more attainable goals, as long as they are consciously
linked to the overall goal (Radnor et al, 2006). In order to benchmark results it important that desired
tangible outcomes are noted. This leads to the next point. Outcomes are able to be separated into
two categories, tangible and intangible. Although intangible outcomes are not heavily referenced
within a manufacturing process, they are of importance (and recognised within a service setting) as
intangible outcomes can provide management the opportunity to assess impacts upon employees
(Radnor et al, 2006).
Intangible outcomes still deliver value to the end consumer and may include things such as process
change, culture change, better understanding of customer needs and greater staff satisfaction
(Radnor et al, 2006). Perhaps the most notable intangible outcome is the culture change. Changing
an organisation's culture can be an extremely difficult task for a number of reasons. Smith (2003)
denoted several factors. Examples include an inward looking, bureaucratic and autocratic culture,
senior managers losing touch, leadership loses confidence etc. Value Stream Mapping provides a
pathway to this culture shift. The outcomes of Value Stream Mapping exercises are seen rapidly and
2.3.4
Developments of value stream mapping
Over recent years new value stream applications have been developed. These new applications use
the original Value Stream Map as the foundation but incorporate specific changes. This literature
review will discuss two new developments:
Value Stream Costing - emerged in 2004 with Ward’s publication “Costing for
competitiveness: cost management and accounting for lean enterprises” (Salah & Zaki,
2013).
Transportation Value Stream Map - emerged in 2012 with Villarreal’s paper "The
transportation Value Stream Map”.
Value stream costing
Traditional accounting methods clash with lean manufacturing implementation. This is because
traditional accounting has many limitations, such as distorted costs (Ruiz-de-Arbulo-Lopez,
Fortuny-Santos & Cuatrecasas, 2013). In order to address this problem, activity based costing was introduced
by Johnson (1987). However, this accounting method requires a lot of time to accurately cost
activities and so critics argue that it is simply an extension of traditional accounting (Salah and Zaki,
2013). In reaction to this, as stated above, Ward introduced the concept of Value Stream Costing.
This method Li, Sawhney, Arendt and Ramasamy (2012) argue, bridges the gap between operational
views and financial views of lean.
Ruiz-de-Arbulo-Lopez et al (2013) defined Value Stream Costing is the process whereby the
information from the Value Stream Map is used to calculate the cost of the whole value stream. In
order to do this, costs such as materials, labour and machine depreciation, as well as others such as
consumables are considered. Salah and Zaki (2013) also had a very similar definition and defined
Value Stream Costing as “the process of assigning the actual expenses of an enterprise to value
streams, rather than to products, services, or departments” (p. 90). Unlike many concepts, Value
Stream Costing seems to have a consistent definition across various pieces of research, thus, allowing
empirical research to be undertaken.
Transportation value stream map
The Transportation Value Stream Map is a tool that Villarreal (2012) developed in his publication
“The transportation value stream map”. The author argued that the transport of goods closer to the
final customer can be said to be a value adding activity and that by viewing the supply chain as a
process, non-value and value adding activities in road freight could be measured and exposed waste
The tool was developed on the foundation of the ‘overall vehicle effectiveness’ measure. The main
objective of Simons, Mason and Gardner’s (2004) work was to create one overall operational
measure of road freight efficiency. The authors designed the measure to reflect the importance of
the road freight industry to the “UK’s sustainable development strategy, and to leverage transport
providers’ profitability” (p. 119). This was achieved by altering the principles of the ‘overall
equipment effectiveness’ measure to measure the effective utilisation of a vehicle in the freight
transport industry. This research led to the definition of the five transport wastes:
Driver breaks
Excess load time
Fill loss
Speed loss
Quality delay
The five wastes identified and defined by Simons et al. (2004) were used to identify non-value adding
activities on the map. They were adapted from Ohno’s seven manufacturing wastes:
Overproduction
Waiting
Transporting
Too much machining (over-processing)
Inventories
Moving
Making defective parts and products (Ohno, 1988, p. 129)
When the transportation wastes are compared with Ohno’s seven wastes then it can be identified
that the wastes of driver breaks and excess load time contribute to waiting. Fill loss and speed loss
both entail paying more for a process than strictly necessary and thus may be considered
over-processing, and finally, quality delay is associated with the waste of making defective parts and
products.
2.4
Conclusion
Milk processing is the process in which raw milk is transformed in to the final product. In this
particular case, the finished product is in a powdered form. It was explained that there are two main
types of milk pasteurisation, with the most common commercial method being high-temperature
During further stages in the process the cream may be added back to the milk in order to achieve
different product specifications. Milk drying is the stage where the most variation is introduced to
the product. Most dairy processing plants operate more than one drier and so this can cause some
problems in terms of product standardisation.
In terms of product freight considerations, a review of the literature found that there are four main
decisions to be considered. The first of these is the physical container. Firms not only have the choice
of different sizes, but also what type of container to select for the transportation of the final product.
The second consideration is the packaging of the product. The packaging is not selected just for
aesthetic appeal but also needs to meet several needs. In terms of milk powder, this is often in a
multi wall bag with an inner polyethylene lining. The third consideration to be made revolves around
the pallet and its load. These choices impact the storage of the product as well as container
utilisation. Warehouse design considerations rest in the location choice as well as the facility design.
Milk powder is a weight losing product and so the factories should be located close to the raw
extraction and the warehouses and distribution centres should be located closer to market. All of
these decisions impact not just the ability to maintain product integrity through to market but also
impact on the operating costs of a firm.
Value Stream Mapping is a very useful Lean tool, especially when undertaking a value stream
analysis. The mapping is commonly undertaken in teams and workshops because there is a pooling of
knowledge around the process being mapped. When attempting to draw the map there are five
phases. In order for the exercise to be a success, managers must be open to the changes proposed.
Unfortunately this is the reason many efforts to implement Lean into a workplace fail.
Over the recent years new value stream applications have been developed. This literature review
looked at two developments. The first was value stream costing in which the authors discussed the
incompatibility between traditional accounting methods and Lean implementation and then
attempted to bridge the gap with value stream costing. The second development was the publication
of a Transportation Value Stream Map. The author mapped the transportation process and then used
Ohno’s seven wastes to develop the five transportation wastes. Despite these developments, there is
still a gap in the literature surrounding agricultural firms in general, Value Stream Mapping of the
product transportation process from a manufacturing firm’s point of view, and also introducing cost
Chapter 3
Methodology
Chapter 1 outlined the importance of lean manufacturing and supply chain management in the dairy
industry of New Zealand, and identified the project’s aims and objectives. Chapter 2 provided a
literature review on milk processing, containerisation and transport, and Value Stream Mapping. This
chapter begins by stating the objectives that have not been previously considered, since these will
suggest appropriate research methods appropriate for this study. These were:
To analyse how Value Stream Mapping can be applied to a logistics setting and conduct a
Value Stream Map analysis
To determine whether Value Stream Mapping has the ability to improve performance within
a logistics setting through analysing its usefulness for an existing New Zealand dairy firm
To report back to the firm on the findings of this project in terms of efficient transport of
finished product in containers
As stated in the aim, this research will adopt a case study approach. Section 3.1 will explain and
justify why a case study has been chosen. Subsequent sections within this chapter will introduce the
case for the project and then explain the research methodology to be followed.
3.1
Research Design
A case study approach has been chosen for this research. This is an appropriate method given the
aims and objectives of the project outlined in Chapter 1. Gerring (2004) defined a case study as “an
intensive study of a single unit with an aim to generalise across a larger set of units”. Stake (1995)
went deeper than this and characterised three main types of case study; intrinsic, instrumental and
collective. This current project will use a combination of an intrinsic and instrumental approach. This
approach utilises a particular case (for this research it is Westland Milk Products) in an attempt to
gain a better understanding of Value Stream Mapping as a Lean tool and its potential application in
an agricultural supply chain context (Grandy, 2010). However, it is important to note that there are
many critics of Stakes case study classification as it does not provide a definitively clear distinction
between the different case study approaches (Blaikie, 2010; Kohlabacher, 2006).
According to Yin (2003), case studies are the preferred research method when “how” or “why”
questions are being asked, the researcher has little control over events and the focus is on a current
real-life phenomenon. This method allows for a holistic and meaningful understanding of the process
very specific and extensive investigation into a particular problem or phenomenon. However, it must
be noted that Zikmund (2007) warned that the data gained has the potential to become
overwhelming and information can take quite some time to interpret and become usable. Thus,
great care must be taken in the data gathering phase in order to collect all relevant information, yet
not gather so much data that analysis becomes very difficult.
Case study research is generally considered to be qualitative in nature. Qualitative research involves
a phase of fieldwork in which the researcher gathers information directly from the people
experiencing the problem or phenomenon (Creswall, 2003). However, because there is a human
element present subjectivity is introduced into the research. This subjectivity is subsequently present
when collecting data and interpreting the results, hence, often times some element of bias is
introduced. Lin (2003) argued that this limits the basis for scientific generalisation. He then went on
to note that though case studies cannot be applied to populations or universes, they are
generalizable to theoretical propositions. Thus, the aim of a case study is to expand and generalise
theories, not to enumerate frequencies.
Stake (1995) identified five steps for conducting a case study:
1. Identify approach – use the research problem to identify a case study approach
2. Case study selection – the researcher selects the case or cases
3. Data collection – researcher determines type of data collection and collects data
4. Data analysis – the researcher selects the type of analysis, develops a description of case and
sets focus on key issues
5. Interpretation – researcher reports the study
The steps outlined above will be used in this project as a basis for conducting the current case study.
The proceeding sections of this chapter will outline the case organisation, the steps to be taken, and
the types of data collection to be used. Chapter 4 will contain an analysis and discussion of the
results. A final report will subsequently be provided for Westland Milk Products for their own use.
3.2
Case Selection
Westland Milk Products (WMP) has been selected as the organisation within the case study. The firm
is a dairy processing co-operative based in Hokitika on the West Coast of the South Island, New
Zealand. Operating since 1937, the business is the major employer of the Westland province,
employing over 250 staff (Crawshaw, 2004; Westland District Council, n.d). Suppliers are mainly
located on the West Coast of the South Island, with some members being located in Canterbury. Milk
transformed into processed goods ready for export. WMP mainly produce commodities to sell on the
market. However, the company does produce some branded value added products, such as EasiYo
yogurt powder and Westgold butter. Other key milk products sold include, but are not limited to,
casein powder, milk powder (including skim milk powder and whole milk powder) and milk powder
concentrate (Westland Co-operative Dairy Company, 2014). Once these products have been
processed they are transported to the warehouse in Rolleston, before being shipped from Lyttleton
Port to overseas sales destinations.
3.3
Research Methodology
Taking the research objectives outlined in the introduction to this chapter into consideration, the
following methodology and steps are proposed:
3.3.1
Background research
Before interacting with a dairy processing firm of which I have very limited knowledge, some
considerations need to be made:
An illiteracy around Value Stream Mapping
The lack of knowledge surrounding WMP and the firms operations
The first of these considerations is an illiteracy about Value Stream Mapping. This includes proper
interpretation of a Value Stream Map as well as value map design. Therefore significant research
needs to be undertaken around previous case study mapping research as well as Value Stream
Mapping literature. Academic publications in general tend have a greater emphasis placed upon the
literature reviews, results, discussion and conclusions, and thus, do not provide a great amount of
detail into how the case study was actually conducted. The implication of this is that Value Stream
Mapping literature is relatively simple to research. However, information regarding case study
research is not as easily found. Hence, a great amount of attention needs to be paid to the process
and then documented.
A lack of knowledge of WMP exists in all area of the business. This includes all business processes
from milk processing, to computer systems, and health and safety requirements. A lack of knowledge
also exists around employment positions within the business and the roles and responsibilities of
those specific positions. This will result in difficulty around data gathering and making contact with
appropriate staff members. The implication of this limited knowledge is that research may take on a
more unstructured and non-traditional approach than is originally anticipated and outlined within
3.3.2
Developing a research method
A research mandate has been provided by WMP. This outlines some of the key personnel involved
within the project as well as a brief background to the project and an outline of the firm’s objectives.
The project outline goes some way in identifying which staff to approach for access to appropriate
data. However, the mandate does not include all interested staff members and data needed.
Therefore, it is important to identify staff interactions and gain an understanding of how to approach
staff to gather relevant information. This is particularly true in the case of gaining an overview of
processes within WMP. Once staff information and interactions have been discovered, staff contact
can be made throughout the course of the project.
Familiarity of computer systems will also need to be gained. This will aid in the gathering of
information relevant to the project. This understanding will be gained on site at the plant in Hokitika.
A list of accessible files will need to be recorded in order to allow efficient use of the system.
Company specific software packages will also need to be understood as the software will aid in data
gathering. Once a basic literacy is learned, access to the computer system will also be available from
the main sales office in Rolleston.
3.3.3
Data gathering and analysis
The result of the initial research will be the production of a current state Value Stream Map. In order
for this to happen, visits to both the Hokitika and Rolleston sites need to be made. Field notes will be
taken at both sites and will be as detailed as possible. This detail will include information on business
processes, diagrams and graphs, as well as any additional information gained from personal
communication with staff members. The data gathering methods of this project stage will be through
the use of observation and targeted information gathering from specific employees. These field
notes will then be re-recorded in a more formal manner on a computer using a software program,
such as Microsoft Word.
Once the field notes are more permanently recorded they will used to create a Value Stream Map. It
is likely that the program Microsoft Visio will be used to create the Current State Map. Any gaps
identified in the process maps will require communication with WMP in order to obtain the missing
data. The final map output of the software will then be discussed with my supervisor Dr. Jeff Heyl in
order to guarantee accuracy and discuss the future direction of the project.
3.3.4
Reporting
One of the most important parts of the reporting process is the drawing of the Value Stream Map, as
related to the quality of information gathered from staff at WMP as well as my own observations and
personal information gathering. As the map is created they will be analysed by supervisors to ensure
accuracy. Not only that, but also the relevance of the information contained within the Maps and any
gaps where information is lacking is assessed.
Reporting needs to be communicated with WMP staff involved in the project. This will give the firm
an opportunity to assess developments throughout the progress. Staff will also have an input into the
areas of focus that may need more attention. This however, is likely to be from a commercial view
point, not an academic one.
3.3.5
Dialogue and final report
Contact is to be made with my university supervisor Dr. Jeff Heyl, WMP project executives and the
Continuous Improvement Leader J. Kenny at each stage of the project. This will allow any corrections
to be made in order to ensure accuracy of content.
At the completion of the project a final report will be produced for WMP. This will contain the Value
Stream Map, analysis and final recommendations made to WMP in order to improve the efficiency of
container transport between Hokitika and Rolleston. The Value Stream Map and the cost analysis
conducted will provide the base for the recommendations. At this point it is at the discretion of WMP
whether the proposed changes are undertaken or not.
3.4
Summary
Just as with any research conducted, a level of adaptability and flexibility must be demonstrated.
Case study analysis allows for both of these. Hence, although the proposed methodology is the
framework for this research, small changes to this are likely.
The information gained throughout the data collection phase will ultimately be used to create a
Value Stream Map. This Current State Map will show the current process of transportation of
product from Hokitika to Lyttleton. In order to achieve this, information gathered from targeted
information gathering and observations will be crucial. The final results will ultimately depend on this
phase of the project, particularly in terms of accuracy.
Due to the purpose of this project, the case study will lack a longitudinal design. The case study itself
focuses heavily on the current state and will then make a recommendation to WMP on the best
future state, in terms of achieving double stacked pallets within the containers. The report received
by WMP will then be used at their discretion and it is the sole decision of the company whether or
Chapter 4
Results
In order to be able to draw a Value Stream Map, visits to both the Hokitika and Rolleston sites were
organised. This meant a basic understanding of the milk manufacturing process and transportation of
the finished milk powder was able to be gained. Following the initial visit, one additional meeting in
Rolleston was organised in order to observe the train arriving and the loading and unloading process
that accompanied. Proceeding this, targeted information gatherin was undertaken in order to gather
the appropriate gain data about specific stages in the process.
The project mandate supplied by WMP had the objective of achieving double stacking of 20 foot
containers between WMP Hokitika and WMP Rolleston. This meant that the nature of the project
was not improving the transport process, particulary since the logistics provider is outside of the
control of WMP, but rather improving container utilisation. The implication being that, the Value
Stream Map and analysis needed to be cost based rather than time based.
This chapter will show the Value Stream Map developed and explain some of the features, describe
costs that were gathered and provide an explanation of the calculations used. Finally this chapter will
provide a detailed explanation of the analysis that was carried out.
4.1
Value Stream Map
As stated above, the Value Stream Map and analysis needed to be cost based. In terms of the Value
Stream Map, this creates some difficulties in drawing the map. Traditionally, the Value Stream Map
shows the overall process and indicates details such as level of inventory, cycle time and time spent
on value added activities and non-value adding at each stage of the process (Rother & Shook, 1998).
However, the developments in Value Stream Mapping, which were described in section 2.3.4 of the
literature review (Chapter 2), show variations of a traditional map. The Value Stream Map developed
in this study takes the structure of a traditional map and adopts some symbols in a non-traditional
LYT Port
Production Control
Annual forecast
Quarterly sales orders Monthly forecast
Weekly schedule
Daily schedule Warehouse and Logistics shift supervisor
Hokitika
Warehouse Manager
Rolleston
Pick/stage Load Unload Store
Store Load
Production Line
Pick/stage Weekly/daily schedule Weekly/daily schedule
1.46
1.25 3.75 1.25 5
37.74
8.33
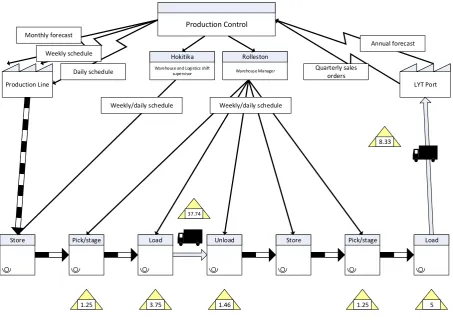
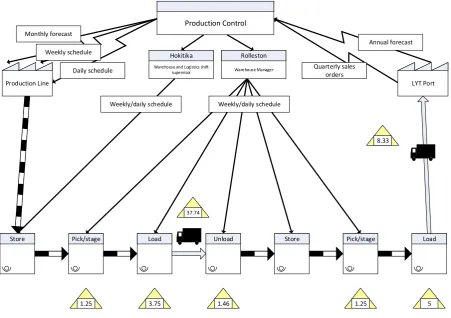
Figure 1: Current State Value Stream Map of the transportation process
4.1.1
Value stream map symbols
It can be seen from the Figure 1 that the Value Stream Map takes on a traditional structure. The
process displayed is the transportation of skim milk powder, whey protein concentrate and acid
caseinate powder from the Hokitika WMP distribution centre to the Rolleston site warehouse.
Although named the transportation process, the map shows the flow of product moving along the
value chain. This is very different from Villarreal’s (2012) Transportation Value Stream Map, where
the focus was purely on the efficiency of the actual transport.
According to Rother and Shook (1998), the inventory of a Value Stream Map is illustrated by a
warning triangle symbol. As the purpose of this map is to demonstrate the cost of each stage, these
triangles have instead be used to demonstrate either cost per pallet, or cost per tonne. The
justification of this being that, in a traditional Value Stream Map inventory and time are the main
metrics used. In this map cost is the metric. Time, in a traditional Value Stream Map is shown at each
process stage in the form of cycle time and also as a timeline at the bottom of the map to help
separate the value added cycle time from non-value added time. Therefore, because time is included
it can be argued that this eliminates the need for a cycle time measurement and timeline. The
implication being that only the inventory symbol remains.
In terms of the literature, there is no clear correct symbol to use for cost as no instances of monetary
cost used as a main measure could be found. Hence, for the purposes of this study, the inventory
icon has remained in the Value Stream Map, but has been adapted to cost to suit the needs of the
study. All other elements within the map maintain the icons accepted and used in academic
research.
When viewing the processes in Figure 1 it can be seen that the process “store” has no cost affixed.
Storage costs have been excluded as they are based on the total annual budget for the warehouse
cost centres, divided by the total annual budgeted production. As the container utilisation is to be
analysed, and not production, the volume of milk powder handled does not change and thus, the
cost should not be affected by this project outcome.
4.1.2
Cost calculations
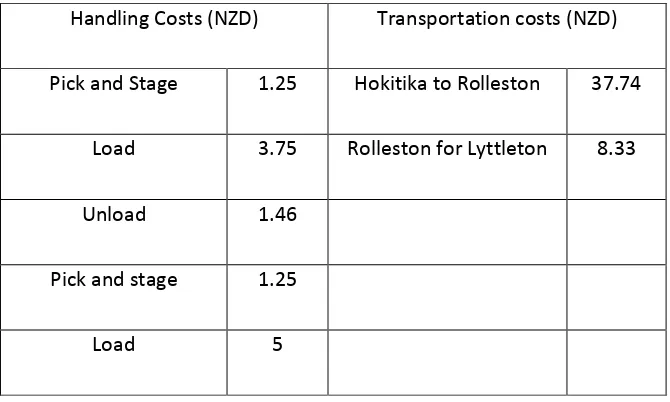
Looking at Figure 1, it can be seen that costs are split into two categories; handling costs and
transportation costs. A summary of these categories is shown below:
Handling Costs (NZD) Transportation costs (NZD)
Pick and Stage 1.25 Hokitika to Rolleston 37.74
Load 3.75 Rolleston for Lyttleton 8.33
Unload 1.46
Pick and stage 1.25
Load 5
Table 1: Summary of handling and transportation costs
The handling costs included costs that vary depending on the number of pallets handled. The general
calculation for these was the total labour cost divided by the number of pallets per container. Only
the variable wages of those that come into direct contact with the product were included in the