©2014 Misra et al. This is an Open Access article distributed under the terms of the Creative Commons Attribution License (http://creativecommons.org/licenses/by/2.0), which permits unrestricted use, distribution, and reproduction in any medium, provided the original work is properly cited.
METHODOLOGY
OPEN ACCESS
Application of Social Network Analysis in Livelihood System Study
Sanchayeeta Misra,† Rupak Goswami,Ῑ* Debabrata Basu,Ῐ and Rabindranath JanaΊ
Abstract
Social Network Analysis (SNA) has received growing attention among diverse academic fields for studying ‘social relations’ among individuals and institutions. Unfortunately, its application has remained limited in the study of livelihood systems of rural poor. Complexity in rural livelihoods has increased sharply in the face of increased pressure on natural resources and rapid shift in farm-based to non-farm based employments. This poses great challenge to successful livelihood intervention in rural areas. On one hand, rural development/extension needs to cater to diverse information and service need of the rural people; on other hand, rural institutions need to deliver livelihood-sustaining services more efficiently, which often need institutional restructuring at multiple levels. To achieve these challenges, a strong innovative analytical tool is required for understanding the complexity of rural livelihoods and the associated role of rural institutions. SNA provides excellent scope to analyse such complex systems and interactions among their components. This article proposes an outline of using SNA in livelihood system analysis. The analysis can provide answer to many questions of practical importance – Who are the influential actors in a livelihood system? Which are the key institutions contributing towards sustainable livelihoods? How do these actors interact among themselves? This will help rural development administrators to deliver livelihood-supporting services more efficiently through informed targeting and capacity building.
Key words: Sustainable livelihoods, Livelihood system, Social network analysis, Rural development, Rural extension
†
Doctoral Student, IRDM Faculty Centre, Ramakrishna Mission Vivekananda University, India, Email: [email protected], ῙAssistant Professor, IRDM Faculty Centre, Ramakrishna Mission Vivekananda University, India, Email: [email protected], ῘProfessor, Department of Agricultural Extension, Bidhan Chandra Krishi Viswavidyalaya, Mohanpur, Nadia-741252, Email: [email protected], ΊAssociate Scientist – ‘A’, Sociological Research Unit, Indian Statistical Institute, Kolkata-700108, Email: [email protected]
*
Introduction
One of the survival strategies of rural poor,
such as marginal or small farmers,
sharecroppers, landless labourers, and marginalised sections of society is their potential and ability to be mobilised and act as a class in order to fulfil their needs or demands. On many issues, particularly the ones which are of collective interest or which require bargaining with those who have power and authority, mobilisation as a class plays a key role as a matter of their strategy. In course of daily life, situations often arise when a household needs to meet family requirements immediately, often by taking help from others. They interact with one another as neighbours, friends, kins, employers/employees, etc. and gradually build networks of regular interaction through these ties (Jana & Choudhuri, 2013). We label these networks as social networks.
These social networks work at
household/family level and play central role in the survival strategy of rural poor. Such flows of help and support operate in an unnoticed manner, directly, either pair-wise, or through intermediaries in the network. Thus, this process works beneath the surface, keeping a low profile, but steadily, to meet various urgent requirements of daily life and living that one cannot fulfil by one’s own resources. Social networks, in this sense, provide a strategy of resource mobilisation from those with whom one has network connections. Understanding such networks is of immense importance for pro-poor research and development. Analysis of such networks – Social Network Analysis (SNA) – has received growing attention among diverse academic fields ranging from sociology,
anthropology, economics, politics, to
psychology, business, mathematics and physics (Freeman, 2004). A social network is a set of people (or organisations or other social entities) connected by a set of social relationships, such as friendship, co-working or information exchange, and SNA shows social relations as patterns of points and lines in a mathematical space with formal properties that can be analysed with precision (Crossley et al., 2009). The focus of inquiry consists of a set of
actors and a set of relations between them (Wasserman & Faust 1994). SNA has developed as an approach for studying ‘social relations ‘rather than ‘individual attributes’ (Burt, 1978) that indicates the ways in which people are connected through various social familiarities ranging from casual acquaintance to close familiar bonds (Hanneman & Riddle, 2005). It focuses on the analysis of patterns of relationships among people, organisations, states and such social entities – both visually and mathematically (Jamali & Abolhassani, 2006). With the growing volume of applied empirical works with SNA, researchers have found it increasingly efficient in studying complex systems – be it natural or human-managed.
Livelihoods of rural poor is a complex system which requires materials, services and
information to manage diversified
uncertainties, and these are transmitted and shared in the form of complex networks. In fact, rural livelihoods in the developing countries have experienced rapid changes in the face of increased human pressure on natural resources, economic liberalisation, structural adjustments and climatic variations (Ellis, 2000). The complexity has increased further due to increasing shift of rural employment from farm-based to non-farm-based livelihoods (Lanjouw & Lanjouw, 2001; Lanjouw & Shariff, 2004). This poses two important challenges to rural development. First, rural extension services need to be expanded, so that diverse livelihood needs are efficiently met by the public funded programmes; second, rural development, which are largely governed by ill-coordinated line departments, self-governing decentralised bodies (panchayats) along with voluntary sector, needs to be better organised (or reorganised). Understanding the network of rural people that sustain their complex livelihood needs (at the micro level) and the network of stakeholders/institutions that
delivers livelihood-sustaining
becomes easier when we understand the sustainable livelihoods system in its entirety.1
Without a strong analytical tool, it is almost impossible to understand these unique and context-bound networks. The application of Social Network Analysis (SNA) is of particular importance for systems characterised by multiplicity of actors and diversity in their sharing of information and/or services (Scott &
Carrington, 2011). Rural livelihoods,
everywhere, is a complex system marked by huge diversity in public and private actors and unthinkable diversity in their sharing of information and/or services. Moreover, this diversity is linked to the macro realities (structures and processes) of a livelihood system. These need to be analysed for informed decision-making in livelihood intervention and institutional restructuring and reforms. Hence, application of SNA is of strategic importance for rural prosperity in general and for rural extension services in particular. This has important implications for extension programs, where information/service failure in public sector extension systems has reduced extension impact (Anderson & Feder, 2007). Unfortunately, application of SNA has particularly been limited or absent in analysing complex livelihood systems in spite of its great
1
Rural communities in marginal environments are increasingly being exposed to unforeseen and transforming trends and processes. This asks for an organisational environment that encourages and fosters innovations to cope up with such situations (Poole & de Freece, 2010). Innovation envisages application of knowledge of all types to achieve desired social and economic ends (Hall et al. 2001) and is essentially a social process where interaction with other members of the society triggers learning and adaptation of new ideas (Douthwaite, Carvajal, Alvarez, Claros, & Hernández, 2006). As a result, innovations generally arise out of a network of actors and relationships (Conway & Steward, 1998). It has become progressively evident that network structure embodying linkages between actors, frequency of their linkages, their roles in the networks and the degree of clustering (of actors) influence the institutional environment that encourage and foster innovation (Spielman, Davis, Negash, & Ayele, 2011). This has necessitated the use of analytical tools that helps in appreciating such networks quantitatively and paves possible ways to improve its efficiency.
potential of exploring the complexity in livelihoods systems of rural poor.
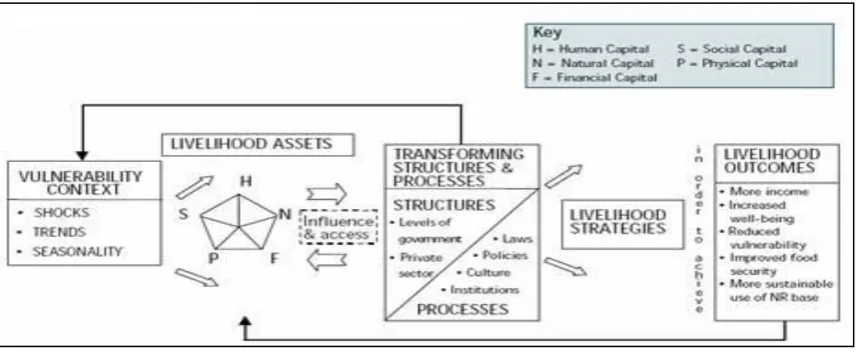
Employing SNA to explore the complexity in livelihood systems asks for a conceptual framework within which the SNA is to be employed. For this to happen, we have taken up Sustainable Livelihood (SL) framework (DFID, 1999) as a starting point, since this framework has been widely used in development practices. Then, we have introduced the concept of ‘system’ before describing the SL framework. This is followed by a comparison of a ‘rural livelihood system’ with generic characteristics of a ‘system’ to establish the system characteristics of rural livelihoods, on which SNA may be employed. Then, we indicated the practical implications of using SNA in livelihoods system analysis with an explicit set of questions that might be answered with our analysis. The next section elaborates on the
methodological outline that might be
considered for using SNA in livelihood system study. This include – sampling, relevant variables to be used, measurement of relationship between actors/institutions, data collection and analysis. Then, we introduce the reader to the commonly used technical terms used in SNA and link them with the livelihood system study. This will help readers to relate the terminologies with the livelihood realities of rural poor. Since matrices and graphical representations may represent network data, we briefly demonstrate both the techniques in the article. We have also given the possible software that may be used in SNA.
A System
A system is a group of interacting components, operating together for a common purpose (Spedding, 1988). Checkland, the proponent of Soft System Methodology (Checkland, 1981) observed a system as model of an entity, which is characterised in terms of its hierarchical structure, emergent properties, communication and control. The system approach proposes a way to understand that entity and negotiate its problems for improved performance. In contrast to the Reductionist scientific enquiry
components in order to study and understand them, Systems theory studies the whole system and relationship among its components. Biology and environmental science use its principles widely, as do other disciplines including systems analysis (Walby, 2007). This is applicable to almost any subject (Spedding, 1988) and empirical evidence is out there to establish its efficiency in analysis, management and improvement of existing system (Cavallo, 1982), be it agriculture (Ikerd, 1993) or rural development (Belshaw & Chambers, 1973). We aspire to advance the same for analysing livelihood systems (DFID, 1999), a much more complex and dynamic system than many other social systems where system analysis has been applied. We take a brief account of livelihoods frameworks in the next section and argue how a livelihood framework qualifies to be a ‘system’, thus, lending scope for application of analytical tools (such as Social Network Analysis).
Sustainable Livelihood System
A livelihood comprises of capabilities, assets and activities required for a means of living (Chambers & Conway, 1992). A sustainable livelihood allows to cope with and to recover from stress and shocks, to maintain or enhance its capabilities and assets to provide sustainable livelihood opportunities for the next generation. A household’s assets consist of the
stock of resources used to generate well-being (Rakodi, 1999). Assets include human capital (age, education and training, and family structure); natural capital (e.g., climate, water and land); physical capital (equipment, livestock, and electricity); financial assets (credit); location-specific factors (such as access to infrastructure and social services), and social, political, and institutional assets, including social and political networks, and social inclusion. A livelihood framework is a way of understanding how households derive their livelihoods. An easy way of thinking within a livelihood framework is using the household triangle of assets, capabilities and activities. Household members use their capabilities and assets to carry out activities for sustaining livelihoods. Household assets refer to the resources that households own or have access to for gaining a livelihood. Where capabilities are the combined knowledge, skills, state of health and ability to labour or command labour of a household. Household strategies are the ways in which households deploy assets, use their capabilities in order to meet households’ objectives, and are often based on past experience. In the present article, we use livelihood framework to understand livelihood
system. Hence, the terms ‘livelihood
framework’ and ‘livelihood system’ are used
synonymously for operational purposes.
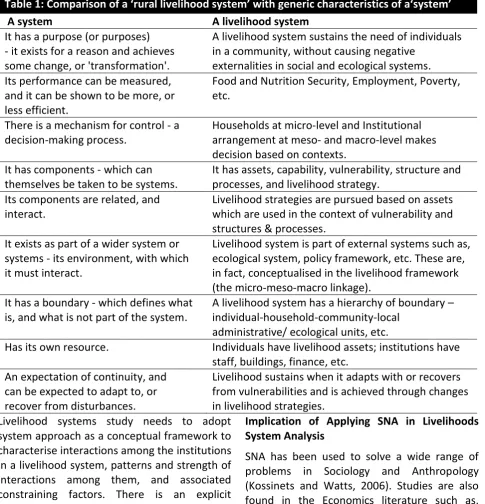
Table 1: Comparison of a ‘rural livelihood system’ with generic characteristics of a‘system’
A system A livelihood system
It has a purpose (or purposes) - it exists for a reason and achieves some change, or 'transformation'.
A livelihood system sustains the need of individuals in a community, without causing negative
externalities in social and ecological systems. Its performance can be measured,
and it can be shown to be more, or less efficient.
Food and Nutrition Security, Employment, Poverty, etc.
There is a mechanism for control - a decision-making process.
Households at micro-level and Institutional arrangement at meso- and macro-level makes decision based on contexts.
It has components - which can themselves be taken to be systems.
It has assets, capability, vulnerability, structure and processes, and livelihood strategy.
Its components are related, and interact.
Livelihood strategies are pursued based on assets which are used in the context of vulnerability and structures & processes.
It exists as part of a wider system or systems - its environment, with which it must interact.
Livelihood system is part of external systems such as, ecological system, policy framework, etc. These are, in fact, conceptualised in the livelihood framework (the micro-meso-macro linkage).
It has a boundary - which defines what is, and what is not part of the system.
A livelihood system has a hierarchy of boundary – individual-household-community-local
administrative/ ecological units, etc.
Has its own resource. Individuals have livelihood assets; institutions have
staff, buildings, finance, etc. An expectation of continuity, and
can be expected to adapt to, or recover from disturbances.
Livelihood sustains when it adapts with or recovers from vulnerabilities and is achieved through changes in livelihood strategies.
Livelihood systems study needs to adopt system approach as a conceptual framework to characterise interactions among the institutions in a livelihood system, patterns and strength of interactions among them, and associated constraining factors. There is an explicit assumption that learning takes place in many parts of a livelihood system, and these can be diffused to other parts of the system through active linkages between organisations and people (see Temmel et al., 2003). Graph-theoretic approach used in SNS is used to
investigate linkages between different
components of the livelihood system and possible clusters and interaction pathways are also detected. This directly leads to generate corrective measures for enhancing system efficiency.
Implication of Applying SNA in Livelihoods System Analysis
SNA has been used to solve a wide range of problems in Sociology and Anthropology (Kossinets and Watts, 2006). Studies are also found in the Economics literature such as, studies on impact of networks on the adoption of innovations (Bandiera & Rasul 2006; Temel et al., 2003) adaptation to uncertainties (Beuchelt & Fischer, 2006) and success in finding a job (Granovetter, 1973). Apart from this, SNA has a strong tradition in understanding coping strategies of poor people against vulnerability vis-à-vis peoples’ social networks.2 Application of SNA has recently
2 People in rural areas traditionally depend on social
been made in the context of institutional networks especially in the field of agricultural extension.3 Unfortunately, this has rarely been used in the analysis of rural livelihoods, although cases may be found where network analyses have addressed a part of livelihood system (Cinner & Bodin, 2010). The analysis will help us understand the individual and institutional networks that sustain rural livelihoods, which lay ground for strategic communication and development intervention. Moreover, the first step in building capacity for networking in rural communities starts from helping the rural people and their service providers understand and visualize their existing networks (Douthwaite et al., 2006).
Application of SNA in livelihood system analysis helps us to answer following important questions:
a) Who are the important individuals (central and influential) in the social networks related to different livelihood information/service/materials?
b) How do these networks interact among themselves? Alternatively, is there commonality among the networks?
c) Who are the important institutions (central and influential) in the livelihood support systems and how do they interact with other institutions?
These questions then follow a compelling set of practical questions (see Mobarak et al., 2011) –
a) Can partnering with well-connected people/institutions in extension/rural development efforts enhance flow of
credit in distress (Servon, 1998), managing job in hard times (Reimer et al., 1997).
3 Application has specifically been made in the context of
Agricultural Knowledge and Information System (Spielman et al., 2009) that conceptualizes agricultural knowledge development as the product of interaction among multiple stakeholders. This has further been applied for understanding Agricultural Innovation Systems (AIS) of the developing countries (Spielman et al., 2011, Asres, Sölkner, Puskur, & Wurzinger, 2012). We believe that this application now needs to be extended to livelihood system analysis, of which AKIS and AIS are components.
information/service delivery/materials
and hence improve sustainable
livelihoods?
b) Is clustering of people/institutions in extension/rural development partner desirable?
Application of SNA in Livelihood System Analysis: A Methodological Outline
Sampling
Sampling Location
Before selecting the sites and deciding on their number, assumptions are to be made regarding the factors that account for the variation in livelihood outcome in a study area. These are the sampling factors. These might be as diverse as land distribution, agro-ecological conditions, presence of institutions such as credit institutions, schools, health, and NGOs, ethnic composition, population density, composition of population by gender, physical accessibility, local opportunities for non-agricultural employment etc. (see Ravnborg, 2002 for similar application in poverty research).
Sampling Household/Individuals
One important distinction of social network data is that it is collected from the whole population instead of using the independent probability sampling (as is done in a cross-sectional survey). Network studies are likely to employ complete enumeration of actors within a defined/naturally occurring boundary. Since the whole population is studied in SNA, the selection of boundary is very important for making valid generalisation. Network data often involve several levels of analysis involving individuals embedded in a network that is embedded in other network. This is called a “multi-modal” structure (for e.g., a farmer network embedded in rural extension network) which is very likely to occur in case of livelihood networks.
Sampling Institutions/Organisations
Sampling of institutions/organisations
associated with sustainable livelihoods is
context-bound since non-government
stakeholders do not follow uniform institutional environment like public funded extension/rural development services. This asks for – apart from extensive literature review – an exploratory phase that maps the stakeholders to be studied by SNA (Asres et al., 2012). Some professionals have used management tools like Stakeholder Analysis for the same (Aberman et al., 2011; Prell et al., 2009). Records are also available where PRA tools like Venn diagram have been used for identifying relevant institutions (Asres et al., 2012).
Sampling Ties
In situations when collection of full network data is expensive or time consuming, sampling of tie may be considered as a viable option. Snowballing, tracking down alters from an centric network, or selecting egos from ego-centric network have been proposed as alternative options for identifying nodes (Hanneman & Riddle, 2005). For an understanding of relevant terminologies, see Table 3.
Variables and Their Measurements (Background of Respondents)
Following DFID’s Sustainable Livelihood Framework (DFID, 1999), different variables may be included in the data collection instrument, which will help us to draw a clear picture of livelihood pattern in a rural setting. These variables are analogous to variables used in cross-sectional survey research. However, the network data is collected through a separate set of questions. These questions might be on different livelihood sustaining information/service/materials, which are explored by FGD/PRA. Measurement of the network data is discussed in the next section. A tentative list of variable, which might be of high relevance to livelihood systems study, is presented below:
a) Natural assets (Land, Water, Aquatic resources, Trees, Forest products, Wildlife, Wild foods & fibres, Biodiversity, Environmental services etc.), Social capital (Networks and
connections, patronage,
neighbourhoods, kinship, Relations of trust and mutual support, Formal and informal groups, Common rules and sanctions, Collective representation, Mechanisms for participation in decision-making, Leadership, etc.), Physical capital (Infrastructure: transport - roads, vehicles; secure shelter & buildings, water supply & sanitation, energy, communications, Tools and technology, tools and
equipment for production, seed,
fertilizer, pesticides, traditional technology etc.), Human capital (Health,
Nutrition, Education, Knowledge
and skills, Capacity to work, Capacity to adapt), and Financial capital (Savings, Credit/debt, Remittances, Pensions, Wages, etc.).
b) Vulnerabilities (Shocks - floods, droughts, cyclones, Deaths in the family, Violence or civil unrest, Seasonality,
Trends and changes, Migration,
Technology, Markets and trade Globalisation, etc.).
c) Policies, Institutions & Processes (Policies of government/of different levels of government/of NGOs/of interational bodies); Processes that - the “rules of the game”/decision-making
processes/social norms &
customs/gender, caste, class/language.
d) Livelihood strategies (Combining - the assets they can access/Taking account of - the vulnerability context/Supported or obstructed by - policies, institutions and processes.
These variables help us to
describe/characterise the important actors in a network after the analysis of SNA data.
Measurement of Relationship (for Networks)
Data may be collected at different "levels of measurement", which are also common to a survey research. Given below are different levels of measurement for network data:
Binary measures of relations – Researcher is interested in examining whether a tie exists or not among two persons or institutions of interest. This is the most commonly used measurement in SNA. In many cases, scores are also dichotomised based on a ‘cut-off’ point. However, this incurs squandering of valuable data.
Multiple-category nominal measures of
relations – This is used when the respondents are asked to choose from a list of alternatives (e.g. name of institutions, type of services, etc.). Each alternative is coded by its type. This is commonly analysed by creating a series of binary measures.
Grouped ordinal measures of relations – Mostly used when the researcher is interested in measuring the strength of relationship (e.g. frequency or intensity). Due to less availability of analytical tools, researchers often convert ordinal data into dichotomous data or assume it to be interval data for analytical purposes (Hanneman & Riddle, 2005).
Full-rank ordinal measures of relations – This is used when a complete ranking of all available choices (e.g., Rank ‘1’ for the first choice, rank ‘2’ for second best choice and so on) are possible to record. Most commonly, this kind of data is considered to be interval during data analysis.
Interval measures of relations – This may be done by asking respondents to report the frequency or intensity of ties with others by interviewing them. However, indirect measures like communication data (e-mail, letters etc.) are often found to be more reliable than self-reporting. A wide range of mathematical manipulation is possible with these data.
Data Collection
Preparation of Interview Schedule
Based on the pre-testing and depending on the objectives, preliminary interview schedule may be formed with the help of literature survey and discussion with the experts from relevant field of livelihood analysis and Social network analysis. The interview schedule may be divided into several sections, namely
Section A: Background Information, covering socio-demographic features of the household
Section B: Livelihood Asset, covering five types of assets
Section C: Livelihood Information Network: Questions on access to (individuals) livelihood information/service/material
Section D: Livelihood Knowledge Information Network: Questions on access to (institutions) livelihood information/service/material
Before starting final data collection, entire schedule needs to be pretested for elimination, addition and alternation with respondents in a non-sample area adjacent to study locations. This is especially important for the Section D, because of the location specificity of networks. Distinct network is expected to be found on
information/service/material, which are
Techniques of Field Data Collection
Data may be collected at two levels – Micro, that is, at the community level (FGD and PRA); and at the Macro (interview with interview schedule), i.e., beyond the community level. For the network analysis, a whole community is taken up for study. Several such communities from different geographical locations and/or livelihood zones may be selected. For the Macro level, an exhaustive set of stakeholders affecting livelihoods of the given community are developed through Focus Group Discussion (FGD). This may be followed by interview with these stakeholders individually or, preferably, in the form of a workshop. FGD is also used for
identification of livelihood-supporting
information and services on which data from individual households are to be collected (through interview with interview schedule) for network analysis. Data should be collected
from all the members of a household (who are operationally eligible to livelihood vocations and survival strategies) to understand multiplicity of livelihood of all the family members, which may help in examining gendered networks. Some others may collect data with an explicit temporal (seasonal) consideration, thus, exploring the seasonal dynamics of social networks.
Data Analysis
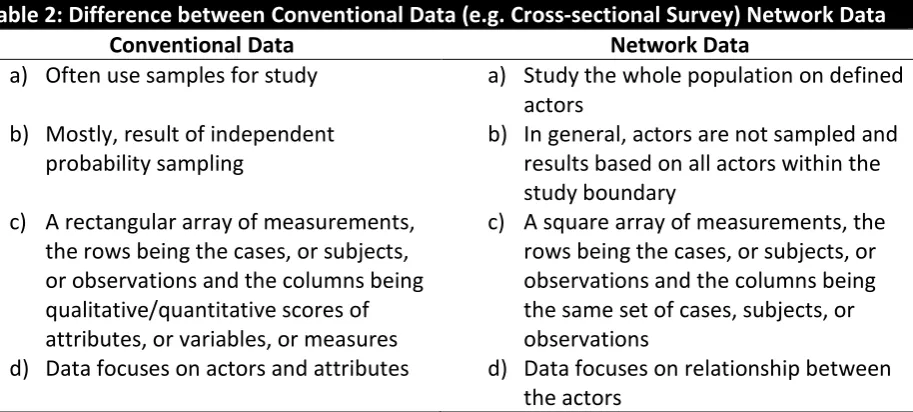
Conventional Data and Network Data Compared
Social Network Analysis approach, using both statistical and visual techniques, is undertaken to analyse the collected data. Before that, let us distinguish network data from conventional (survey) data (Table 2) with which the SNA-beginners have more acquaintance with.
Table 2: Difference between Conventional Data (e.g. Cross-sectional Survey) Network Data
Conventional Data Network Data
a) Often use samples for study a) Study the whole population on defined
actors b) Mostly, result of independent
probability sampling
b) In general, actors are not sampled and results based on all actors within the study boundary
c) A rectangular array of measurements, the rows being the cases, or subjects, or observations and the columns being qualitative/quantitative scores of attributes, or variables, or measures
c) A square array of measurements, the rows being the cases, or subjects, or observations and the columns being the same set of cases, subjects, or observations
d) Data focuses on actors and attributes d) Data focuses on relationship between the actors
Level of Network Data
Network data essentially describe the nodes
and their inter-relations for bounded
populations. In case of livelihood system
analysis, for example, interpersonal
relationship among villagers for sharing of livestock management represents a ‘one-mode’ network (see Fig. 4a). Now, this village exists
within Gram Panchayat/Community
Development Block that might in turn envisage relationship/network of Dairy Extension Officers, veterinary surgeons, Block Livestock
in networks. However, very few analyses have attempted to work on more than two modes simultaneously (Haneman and Riddle, 2005).
Multiple Relations in Livelihood Systems Analysis
In a conventional data set of cross-sectional
survey, cases/actors are described by
variable(s), while in case of social network data set (actor-actor) only one kind of relation is described. However, just like a survey researcher might get interested in multiple attributes of actors (multi-variate case), researchers in SNA work with multiple kinds of ties that connect actors in a network (Haneman & Riddle, 2005).
When we are thinking about network ties among different actors in livelihood systems (e.g. agriculture, health, small business, etc.) in an area, we are often eager to identify common stakeholders in different livelihood networks. The positions that households hold in the web of affiliations are multifaceted. Importance of an actor in seed-sharing network may/may not be similar in networks on plant protection or treatment of livestock. This kind of multi-relational networks and the structure of networks composed of multiple relations are of particular importance in livelihood systems analysis.
So far, more elaborate works have been done on single relational data than on multi-relational. There are approaches and methods such as network correlation, multidimensional scaling and clustering, and role algebras that
have been developed to work with
multirelational data.
Common Terminologies Used in SNA
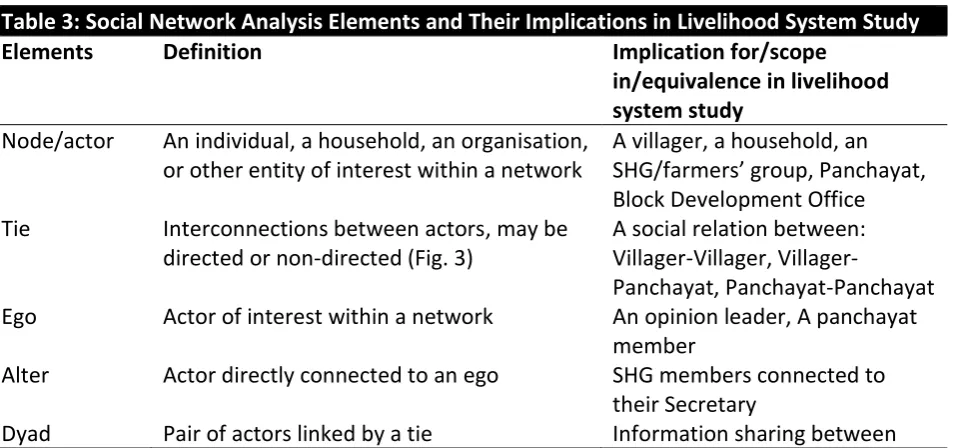
Now, we introduce some terminologies associated with SNA to make it easier to describe the features of data used in network analysis as well as its analysis and representation. We assume that the readers have basic orientation in SNA and will readily be able to connect the terminologies to livelihood systems. Else, we recommend readers to go through Haneman and Riddle (2005), a lucid and open-source text on SNA applications. Selected terminologies and their implications in livelihood system study have been given in Table 3. Please note, that the terminologies cover both directed (edges connecting nodes have direction) and non-directed (edges connecting nodes do not have direction) networks and the implications given for individual elements in this table are only demonstrative. There might be many other examples/forms of relationships, which is not given due to space constraint. We have only given examples having strategic importance in livelihood interventions.
Table 3: Social Network Analysis Elements and Their Implications in Livelihood System Study
Elements Definition Implication for/scope
in/equivalence in livelihood system study
Node/actor An individual, a household, an organisation, or other entity of interest within a network
A villager, a household, an SHG/farmers’ group, Panchayat, Block Development Office
Tie Interconnections between actors, may be
directed or non-directed (Fig. 3)
A social relation between: Villager,
Villager-Panchayat, Panchayat-Panchayat
Ego Actor of interest within a network An opinion leader, A panchayat
member
Alter Actor directly connected to an ego SHG members connected to
their Secretary
two farmers Indegree The number of ties directed towards an
actor from other actors, e.g. the number of social interactions that an actor receives from other actors
No. of queries (on
information/services) received by a farmer regarding plant protection; signifies actor’s prestige/popularity in a network Outdegree The number of ties originating from an
actor to other actors, e.g. the number of social interactions that an actor approaches to other actors
No. of services/information requested by a farmer to other fellow farmers; signifies actor’s expansibility on the network Network Graphical representation of relationships
that displays points to represent nodes and lines to represent ties; also referred to as a graph
A seed sharing network, An animal traction network NGO network
Ego Network Network that only shows direct ties of the ego to the alters and not between alters (Fig. 5a)
A network of a rural leader with his followers
Network Size Total number of nodes in a network Total number of nodes in an
Innovation System/SHG network Network
Density
Number of ties, expressed as percentage of the number of ordered/unordered pairs. When density is close to 1.0, the network is said to be dense, otherwise it is sparse (Fig. 6a & 6b).
Effectiveness of grassroots networks may be monitored
Reciprocity If two actors are directly related to each other, then two nodes are said to have reciprocal relations (for whole network); total number of reciprocal pairs of the network are standardised probabilistically and deterministically to get the measure of reciprocity of the network (Rao & Bandopadhyay, 1987)
The cohesiveness indicates
solidarity among the people constituting a network of a specific relation.
Centrality Measure of the number of ties that a node has relative to the total number of ties existing in the network as a whole; centrality measures include degree, closeness, and betweenness.
Shows the important persons or institutions in the local livelihood system
Degree Total number of ties a node has to other
nodes. A node is central, when it has the higher number of ties adjacent to it (Fig 7a).
It signifies actors connected to maximum number of actors in a system; important for
information dissemination Closeness Measure of reciprocal of the geodesic
distance (the shortest path connecting two nodes) of node to all other nodes in the network. A node is “close” if it lies at short distance from many other nodes (as in being physically proximate) (Fig. 7b).
Important for disseminating service/information in emergency
Betweenness Number of times a node occurs along the shortest path between two others (Fig. 7c).
with a potential for control over others.
Eigenvector A node’s centrality is proportional to the sum of centralities of those it has ties to (Fig. 7d).
Shows importance and control over a system
Bridge An edge is said to be a bridge if deleting it would cause its endpoints to lie in different components of a graph.
Important link between
subgroups, helps in maintaining information flow; needs special attention for mainstreaming/ formalisation
Bridge of degree k
A tie that connects nodes that would otherwise be at least k steps apart
Helps in strategic intervention for reducing lag in information dissemination/technology transfer
Path length, Distance
Number of links between two nodes, length of shortest path between them (geodesic)
Important to anticipate the time/energy required for planned information flow/service delivery Cliques Every individual is directly tied to every
other individual (Fig. 9)
Closed group might be of innovators; or organisations having understanding of resource sharing
Core Cohesive subgroup within a network in
which the nodes are connected in some maximal sense
The dominant part of a network; often spatially grouped or grouped by common interest; Periphery Nodes that are only loosely connected to
the core and have minimal or no ties among themselves
Often found to be the marginalised section of the society
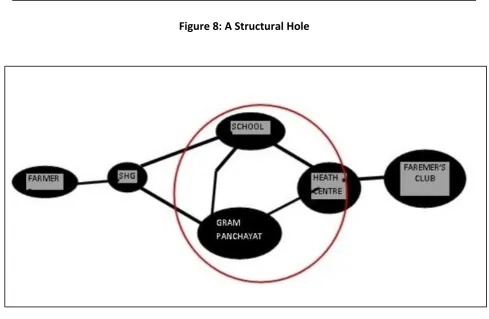
Structural hole
A structural hole occurs whenever a person (a) has a relationship with someone who is connected to a separate cluster of people and (b) has no other direct or indirect connection with the people in that cluster (Fig. 8)
A person who has a large
number of structural holes in his or her network is likely to be exposed to more diverse information and opportunities than a person who has relatively few structural holes in his or her network, e.g. an SHG is
connected to a distinct group via a District Rural Development Administration facilitator. Structural
equivalence
Actors are structurally equivalent to the extent they have the same
in-neighbourhoods
and out-neighbourhoods (Fig. 10)
Structural equivalence suggests similar intervention for
equivalent structures (e.g. a value chain)
Clustering All the actors who are directly connected to ego in a neighbourhood; when calculated for all the egos, gives clustering of the whole network
Important for controlling infectious diseases; targeting message for quick effect
Brokerage A person connecting two otherwise
unconnected people is a “broker” of
information flow. Brokerage differs from structural holes in that (a) it does not assume that groups are unconnected and (b) it more clearly describes the flow of information.
dissemination; important for controlling vested interest
Sources: Wasserman & Faust (1994); Scot & Carrington (2011); Borgatti et al (2009); Davies (2004); Hanneman and Riddle (2005); Asres et al. (2012)
Representation through Matrices: An Illustration
This section introduces readers to several graph theoretical concepts used in the analysis of the Innovation Systems Study (Temel et al., 2001). We have adapted the approach for livelihood systems study as and when found suitable.
Let the linkage matrix S is defined as a matrix that maps cross-component linkages relating to
sustainable livelihoods. The goal of livelihood system (LS) is to facilitate smooth delivery of information/services/materials that meets diverse livelihood need of a community. If the LS consists of 6 components: Policy (P), Research and Development (R), Extension (E), Credit (C), Marketing (M) and Voluntary services (V), the components are placed in the diagonal cells and their linkages are placed in the off-diagonal cells of the matrix S.
P PR PE PC PM PV
RP R RE RC RM RV
EP ER E EC EM EV
CP CR CE C CM CV
MP MR ME MC M MV
VP VR VE VC VM V
The term PR in the 1st row – 2nd column of S represents the probable binary linkage (one-to-one) between representatives of organisations under Component P with representatives of organisations under Component R, which may or may not exist. Likewise, the term RP in the 2nd row – 1st column of S represents the probable linkage of the organisations under R
with the organisations under Component P, which may or may not exist. These linkages can be flow of information, service, or materials.
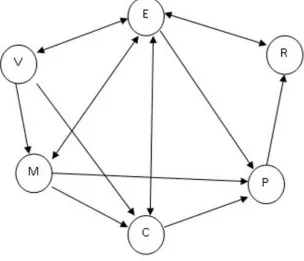
Now this Matrix S can be used as a coded linkage matrix S[c], a matrix with binary codes: ‘0’ for ‘absent’ and ‘1’ for ‘existing’ linkages. For a hypothetical situation, the matrix might look like:
P 1 0 0 0 0
0 R 1 0 0 0
1 1 E 1 1 1
1 0 1 C 0 0
1 0 1 1 M 0
0 0 1 1 1 V
Examining along the row we see, P reports linkage with R, R reports linkage with E, and E
reports linkage with all other components. If we examine along the column, E, C, and M
S=
report linkage with P. Note that the links are directed and not symmetric (since, P reports linkage with R, but R does not report linkage with P). This often happens while working in field situation, where actors perceive their linkage differently (e.g., a grassroots level NGO
may report linkage with Public extension department, while the extension agency might not report reciprocal linkage). The coded linkage matrix may be represented by a digraph having six nodes/vertices and 10 edges (Figure 2a).
The matrix S[c] can be refined when measurement of linkage strength is available with the researcher. The strength is often measured through scale (e.g. ‘0’ for a non-existent, ‘1’ for a weak, ‘2’ for a medium, and ‘3’ for a strong linkage). If this procedure is repeated for all the organisations, a total of 6 vectors will be developed. When all the linkage strengths are reduced to an average vector for
all the components, we get the following matrix. For the present example, assume that we have taken data from all stakeholders separately on the degree of linkage their organisations have developed with other stakeholders of the system. For P, we got scale value of 3, 2, 2, 3, and 3 from five stakeholders. The average of these scores was 2.6 (rounded to 3).
P 3 0 0 0 0
0 R 2 0 0 0
3 1 E 1 2 1
2 0 1 C 0 0
1 0 1 2 M 0
0 0 1 2 1 V
Figure 2a: Digraph Showing Linkage of Matrix S (c)
The row of P indicates its intensity of interaction within the system (reflected separately by P’s interaction with other components i.e. E, C & M, in the system).
A researcher might also be interested to know the strength of influence created by a component on others. This might be recorded by measuring the strength in a scale (0=no
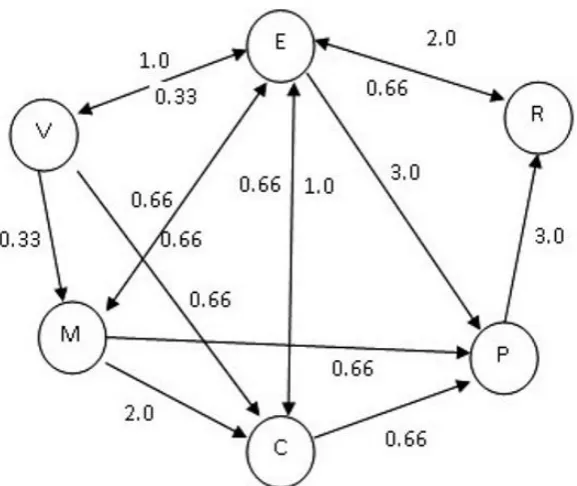
influence (n); 0.33=weak (w); 0.66=medium (m); 1.00=strong (s)). This weight may then be imposed (by multiplication) on Matrix S (r) to give rise to an adjusted refined linkage matrix S (a). ‘3s’ in S (a) indicates multiplication of 3 with the scale value for ‘strong’, that is, i.00, resulting in 3.0.
P 3s 0w 0n 0w 0w
0w R 2s 0w 0n 0w
3s 1m E 1m 2w 1s
2s 0n 1s C 0w 0w
1m 0n 1m 2s M 0w
0w 0n 1w 2w 1w V
P 3.0 0 0 0 0
0 R 2.0 0 0 0
3.0 0.66 E 0.66 0.66 1.0
0.66 0 1.0 C 0 0
0.66 0 0.66 2.0 M 0
0 0 0.33 0.66 0.33 V
This linkage matrix S (a) may now be represented as a directed graph (Figure 2b). The matrix (Figure 2b) clearly shows the influence of a component within the system. For example, Extension (E) shows high influence within the livelihood system;
however, the intensity of influence varies with components of the system, Policy (P) being highly influenced by Extension. The analysis may be taken further to cluster similar institutions having same influence within the livelihood system.
S (a)
=
=
Graphical Representation
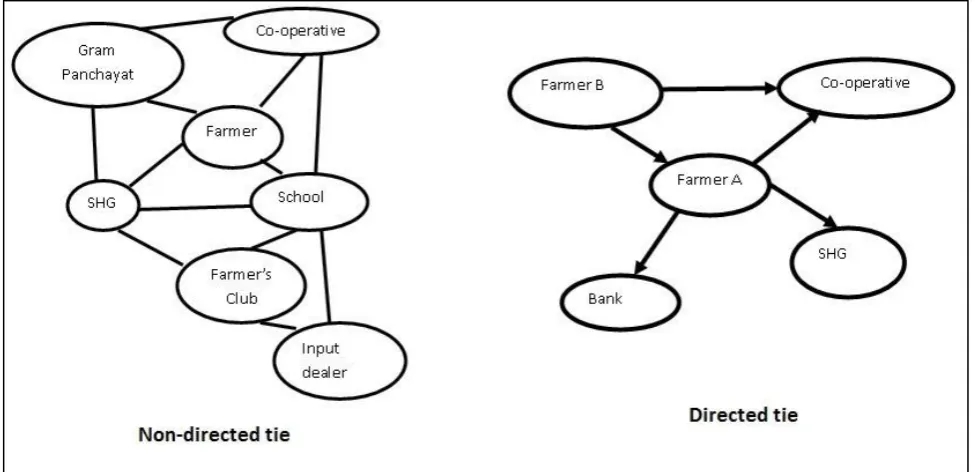
Graphical representation of social relationship makes it easier (than matrix) for the viewer to understand complex social structures when the network size is small and simplex. The graph may be directed i.e. choices are made non-directional, and directed, i.e., choices made are directional (Fig. 3). Choices are shown with arrowheads in a directed graph. It is often beneficial to use directed graphs instead of non-directed, since two individuals may not perceive the tie between them similarly (a pregnant women may mention a choice for a midwife, which might not be reciprocated by
the midwife). Again, a graph may be simplex, i.e. showing single relationship (e.g. information exchange), or multiplex, i.e. lines showing relationship on more than one type of relationship (e.g. information exchange and resource sharing). These relationships may also be shown in separate graphs. Depending on the levels of measurement, the graphs may be binary (presence or absence of relationship) or signed (attraction and repulsion) or valued (high, medium, low). A graph may also feature one-mode (Fig. 4a) and two-mode (Fig. 4b) relationship.
Figure 4a: One-mode Network Figure 4b: Multimode Network
A graph can also represent a single node, i.e., the ego network (Fig. 5a) or the whole network (Fig 5b). While a whole network shows the overall pattern of interaction in a system, an
‘ego network’ indicates the role of a node in the social system. After working out the important nodes (as indicated by their
centrality), ego network may be studies for these individual nodes.
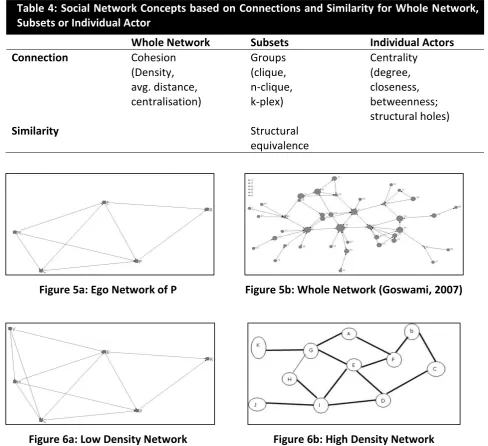
A clearly constructed graph reveals some strategically important characteristics of a system – connections among nodes, density of connections, ‘cluster’ of systems, etc. A series of figures are given below to understand the graphs, which are based on different group and individual attribute of the nodes and/or network. Borgatti (2002) summarises the social network concepts based on connections and similarity for whole network, subsets or
individual actor (Table 4). Not all the properties have, however, been explained in the text. Refer back to Table 3 for the theoretical
explanation of the concepts and its
relation/scope in livelihood system study. In some SNA software, one can also find options to impose individual properties such as centrality score on node attributes, thus making the visualisation more meaningful (since more central nodes are shown proportionately larger than other nodes of the network) (Fig. 5b & 7e).
Table 4: Social Network Concepts based on Connections and Similarity for Whole Network, Subsets or Individual Actor
Whole Network Subsets Individual Actors
Connection Cohesion (Density, avg. distance, centralisation)
Groups (clique, n-clique, k-plex)
Centrality (degree, closeness, betweenness; structural holes)
Similarity Structural
equivalence
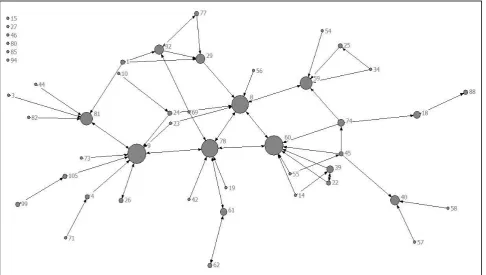
Figure 5a: Ego Network of P Figure 5b: Whole Network (Goswami, 2007)
Figure 7a: Degree Centrality Figure 7b: Closeness Centrality
Fig. 7c: Betweenness Centrality Fig. 7d: Eigenvector Centrality
Figure 8: A Structural Hole
Network data are now analysed and visualised through specialised software. Few of them are available for students’/researchers’ use.
Comparisons among few of these softwares are given below (Table 5).
Table 5: A Comparison of Commonly Used Software in SNA
Description Nature Use Proprietary
UCINET 6 Comprehensive social network analysis software
General Academic Free
Net Draw Network Visualisation software, associated with UCINET
Visualisation Academic Free
Pajek Program for large network analysis
General Academic Free
NetMiner3 Exploratory analysis and visualisation of network data
General Commercial Paid
Gephi Visualisation and exploration platform
Visualisation Academic Free
SocNetV Social Networks Visualiser Visualisation Academic Free
Conclusion
Social Network Analysis research has been adopted in diverse academic disciplines, especially for solving practical problems. Since
SNA is particularly effective in understanding complex systems, its application is being experimented in dynamic systems – be it social networking in web space or a weather forecast dissemination system for fishermen. This is also
being popularly employed for better coordination and control of organisational environment. However, application of SNA needs some serious training before applying in real world. However, a basic understanding of the analysis is often beneficial for functional purposes.
Livelihood system is not only complex due to its multiple interacting components and hierarchy of spread it has spatial and temporal variations also. With changes in any internal (health of principal earner in a family) or external conditions (withdrawal of subsidy on farm inputs) of the system, a livelihood system responds to both short and long terms. A large number of institutions associated with livelihood outcomes of a household or community adds to the complexity of the system. Decision makers must make informed decision for meaningful livelihood intervention in an area and promote innovation within the organisational environment. This will need capacity building of development professionals for better understanding of complex systems and practice this in day-to-day problems. At the methodological front, we recommend that training on SNA and its application be mainstreamed in rural development scholarship and profession.
References
Aberman, N., & Haglund, E. (2011). A
Stakeholder Map for Climate Change
Adaptation. Retrieved from
http://womenandclimate.ifpri.info/files/2012/0 2/Mali_Net-Map_En_FINAL.pdf (accessed on 12 January 2014)
Adger, W. N. (2010). Social Capital, Collective Action, and Adaptation to Climate Change. Economic Geography, 79(4), 387-404.
Anderson, J. R., & Feder, G. (2007). Agricultural Extension. Handbook of Agricultural Economics, 3, 2343-2378.
Asres, A. , Sölkner, J. , Puskur, R. , & Wurzinger, M. (2012). Livestock Innovation Systems and Networks: Findings from Smallholder Dairy Farmers in Ethiopia. Livestock Research for Rural Development. Volume 24, Article
#164. Retrieved from
http://www.lrrd.cipav.org.co/lrrd24/9/amla241 64.htm (accessed on 12 December 2013)
Bandiera, O., & Rasul, I. (2006). Social Networks, and Technology Adoption in Northern Mozambique, Economic Journal, 116: 862-902.
Belshaw, D., & Chambers, R. (1973). A Management Systems Approach to Rural Development. Discussion paper, 161, Institute for Development Studies, University of Nairobi,
Nairobi, Kenya. Retrieved from
http://opendocs.ids.ac.uk/opendocs/bitstream /handle/123456789/76/rc135.pdf?sequence=1( accessed on 23 December, 2013)
Beuchelt, T., & Fischer, I. (2006). What Do Vietnamese Farmers Do When a Crisis Occurs? Covering Lack of Resources through Social
Networks. Making Rural Households’
Livelihoods More Resilient–The Importance of Social Capital and The Underlying Social Networks, 34, 45-57.
Borgatti, S. (2002). Basic Social Network
Concepts. Retrieved from
http://www.analytictech.com/networks/basic% 20concepts%202002.pdf (accessed 9 February 2014)
Borgatti, S. P., Mehra, A., Brass, D. J., & Labianca, G. (2009). Network Analysis in the Social Sciences. Science, 323(5916), 892-895.
Burt, R. S. (1978). Cohesion Versus Structural
Equivalence as a Basis for Network
Subgroups. Sociological Methods &
Research, 7(2), 189-212.
Cavallo, R.E. (1982). Systems Methodology in Social Science Research: Recent Developments. Boston and The Hague: Kluwer Nijhoff Publishing.
Chambers, R., & Conway, G. (1992). Sustainable Rural Livelihoods: Practical Concepts for the 21st Century. UK: Institute of Development Studies.
Cinner, J. E., & Bodin, Ö. (2010). Livelihood Diversification in Tropical Coastal Communities: A Network-Based Approach to Analyzing ‘Livelihood Landscapes’. PLoS ONE, 5(8).
Conway, S., & Steward, F. (1998). Mapping Innovation Networks. International Journal of Innovation Management, 2(2), 223-254.
Crossley, N., Prell, C., & Scott, J. (2009). Social Network Analysis: Introduction to Special Edition. Methodological Innovations Online, 4, 1-7.
DFID. (1999). Sustainable Livelihoods Guidance Sheets, Numbers 1–8, London: Department for International Development.
Douthwaite, B., Carvajal, A., Alvarez, S., Claros, E., & Hernández, L.A. (2006). Building Farmers’
Capacities for Networking (Part I):
Strengthening Rural Groups in Colombia through Network Analysis. KM4D Journal, 2(2): 4-18.
Ellis, F. (2000). Rural Livelihoods and Diversity in Developing Countries. UK: Oxford University Press.
Freeman, L. (2004) The Development of Social Network Analysis: A Study in the Sociology of Science, Vancouver, CA: Empirical Press.
Goswami, R. (2007). Understanding Farmer-to-Farmer Communication within the Sustainable Rural Livelihoods Framework (Unpublished Doctoral thesis), Bidhan Chandra Krishi Viswavidyalaya, West Bengal, India.
Granovetter, M. S. (1973). The Strength of Weak Ties. American Journal of Sociology, 1360-1380.
Hall, A.J., Sivamohan, M.V.K., Clark, N., Taylor, S., & Bockett, G. (2001). Why Research Partnerships Really Matter: Innovation Theory, Institutional Arrangements and Implications for Developing New Technology for the Poor. World Development, 29(5), 783-797.
Hanneman, R. A., & Riddle, M. (2005).
Introduction to Social Network Methods,
Riverside, CA: University of California, Riverside.
Ikerd, J. E. (1993). The Need for a System
Approach to Sustainable Agriculture.
Agriculture, Ecosystems & Environment, 46(1), 147-160.
Jamali, M., & Abolhassani, H. (2006). Different Aspects of Social Network Analysis. In Web Intelligence, 2006. WI 2006. IEEE/WIC/ACM International Conference on Web Intelligence
(pp. 66-72). Retrieved from
https://www.cs.sfu.ca/~oschulte/teaching/soci alnetwork/papers/SNA-intro-mohsen.pdf (accessed on 12 October 2013)
Jana, R., & Choudhuri, A. (2013). Studying Various Aspects of Social Networkswith Socio-economic Changes in a Rural Area: A case study from West Bengal, Guru Nanak Journal of Sociology, 34 (1 & 2), 1-30.
Kossinets, G., & Watts, D. J. (2006). Empirical
Analysis of an Evolving Social
Network. Science, 311(5757), 88-90.
Lanjouw, J. O., & Lanjouw, P. (2001). The Rural Non‐farm sector: Issues and Evidence from
Developing Countries. Agricultural
Economics, 26(1), 1-23.
Lanjouw, P., & Shariff, A. (2004). Rural Non-farm Employment in India: Access, Incomes and Poverty Impact. Economic and Political Weekly, 4429-4446.
Martin, K. S., Rogers, B. L., Cook, J. T., & Joseph, H. M. (2004). Social Capital is Associated with Decreased Risk of Hunger. Social Science & Medicine, 58(12), 2645-2654.
Poole, N., & de Frece, A. (2010). A Review of Existing Organisational Forms of Smallholder Farmers’ Associations and Their Contractual Relationships with Other Market Participants in the East and Southern African ACP Region.
Retrieved from
http://eprints.soas.ac.uk/8623/1/FAO_AAACP_
Paper_Series_No_11[1].pdf (accessed 22
January 2014)
Prell, C., Hubacek, K. , & Reed, M. (2009). Stakeholder Analysis and Social Network
Analysis in Natural Resource
Management. Society and Natural
Pretty, J. (2003). Social Capital and the
Collective Management of Resources.
Science, 302(5652), 1912-1914.
Rakodi, C. (1999). A Capital Assets Framework for Analysing Household Livelihood Strategies: Implications for Policy. Development policy review, 17(3), 315-342.
Rao, A.R., & Bandyopadhyay, S. (1987). Measures of Reciprocity in a Social Network. Sankhya, Series A, 49: 141-188.
Ravnborg, H. M. (2002). Developing Regional Poverty Profiles Based on Local Perceptions (No. 291). International Centre for Tropical Agriculture, Cali, Colombia.
Reimer, B., Bollman, R. D., & Bryden, J. M. (1997). Informal Rural Networks: Their Contribution to "Making a Living" and Creating Rural Employment. In R. D. Bollman & Bryden, J. M. (Eds.), Rural Employment: An International Perspective (pp. 396-409). Wallingford: CAB International.
Scott, J., & Carrington, P. J. (Eds.). (2011). The SAGE Handbook of Social Network Analysis. London: SAGE.
Servon, L. J. (1998). Credit and Social Capital: The Community Development Potential of US Microenterprise Programs. Housing Policy Debate, 9(1), 115-149.
Spedding, C.R.W. (1988). An Introduction to Agricultural Systems. 2nd ed. London: Elsevier Applied Science.
Spielman, D. J., Davis, K., Negash, M., & Ayele, G. (2011). Rural Innovation Systems and Networks: Findings from a Study of Ethiopian
Smallholders. Agriculture and Human
Values, 28(2), 195-212.
Spielman, D. J., Ekboir, J., & Davis, K. (2009). The Art and Science of Innovation Systems Inquiry: Applications to Sub-Saharan African Agriculture. Technology in Society, 31(4), 399-405.
Temel, T., Janssen, W., & Karimov, F. (2001). Agricultural Innovation System of Azerbaijan: An Assessment of Institutional Interactions (Discussion Paper No. 01-3). The Hague, The Netherlands: ISNAR.
Temel, T., Janssen, W., & Karimov, F. (2003). Systems Analysis by Graph Theoretical Techniques: Assessment of the Agricultural Innovation System of Azerbaijan. Agricultural Systems, 77(2), 91-116.
Walby, S. (2007). Complexity Theory, Systems Theory, and Multiple Intersecting Social Inequalities. Philosophy of the Social Sciences, 37(4), 449-470.
Wasserman, S., & Faust, K. (1994) Social
Network Analysis, Cambridge: Cambridge