INTRODUCTION
Oriental goat’s rue (Galega orientalis Lam.) is a plant of the family Fabaceae Lindl., subfam-ily Fabaoideae, tribe Galegae and subtribe Gale-ginae. It is only recently that scientists world-wide [Šlepetys, 2003; Baležentienė, 2009, 2011; Egamberdieva et al., 2010; Mikkonen et al., 2011] and in Poland [Deska, 2009; Deska et al., 2012, Kozłowski and Zielewicz, 2013] have started to be interested in the plant. Indigenous to the north-ern Caucasus, the plant can be found in the wild in forested regions of Georgia, southern Arme-nia, south-western Azerbaijan and sometimes in the Crimea. Due to the fact that the plant’s green parts are rich in protein (the content ranges be-tween 16–27%), oriental goat’s rue is commonly grown in some EU Baltic countries (Estonia, Fin-land, Latvia) and in Russia. In Poland the species is relatively unpopular, just like in France, Can-ada, Croatia, Belarus and Serbia where the first attempts are being made to introduce the plant on a wider scale. Studies on the biology of growth and morphological development of the oriental
goat’s rue, conducted by Raig [2001], Ignac-zak [2010] have demonstrated that the develop-ment of the plant is a complex process. During the growing season, leaf rosettes are formed on root necks in early spring. When the minimum temperature exceeds 5oC, plants start to produce
aerial stems from root necks that have overwin-tered, and one-year-old underground roots. Dur-ing blossomDur-ing and pod maturation, cluster tips wither and shrink if rainfall is insufficient. Under the climatic conditions of Poland, pods in main clusters mature in late July. However, if late July is rainy, oriental goat’s rue’s plants develop sec-ondary and tertiary stems which produce flowers [Deska and Wyrzykowska, 2005; Deska, 2009; Deska et al., 2012].
Similarly to any other plant, the development of oriental goat’s rue can be described mathe-matically by means of indices and functions. The functions that describe the relationship: age-time, are called growth curves and make it possible to include many measurements into one equation based on several parameters which can be in-terpreted from a biological standpoint. They are
APPLICATION OF A LOGISTIC FUNCTION TO DESCRIBE THE GROWTH
OF FODDER GALEGA
Katarzyna Rymuza1, Antoni Bombik1
1 University of Natural Sciences and Humanities in Siedlce, Prusa 14, 08-110 Siedlce, Poland, e-mail: katarzyna. [email protected]
Volume 18, Issue 1, Jan. 2017, pages 125–131
DOI: 10.12911/22998993/66245 Research Article
ABSTRACT
It was attempted in the paper to describe the growth of oriental goat’s rue (Galega orientalis Lam.) growth by means of a logistic function. The studies demonstrated that the function describes empirical data well as the coefficients of determination obtained ranged between 97 to 98%, depending on the growing season. The estimated function parameters indicate that both the plant height and growth rate were condi-tioned by thermal conditions and moisture during the growing season. Plants had the longest stems in the year 2010 (127.9 cm), and the shortest in 2008 (105.9 cm). The maximum growth rate ranged from 2.12 to 3.97 cm per day in, respectively, 2009 and 2008. Also the inflection point, the point at which plants grew the fastest, depended on the conditions of the growing season.
Keywords: oriental goat’s rue, logistic function, growth equation, growth rate equa-tion, growth rate.
-5,0 0,0 5,0 10,0 15,0 20,0 25,0 30,0
1 2 3 1 2 3 1 2 3 1 2 3 1 2 3
III IV V VI VII
tempe
ra
ture
(
oC)
months and ten-day temperature
2007 2008 2009 2010 1987 - 2010
Figure 1. Ten-day and monthly temperatures (oC) in the study years
sigmoid curves consisting of three stages: “expo-nental” characterized by slow but constantly in-creasing growth, “linear” when the growth is the fastest till maximum is reached, and the stage of “growing old” when the growth slows [Gregorc-zyk, 1991; Wesołowska-Janczarek, 1993; Kara -davut et al., 2008]. Analysis of plant growth fre -quently employs the logistic function – a function which is continuous and differentiable at each point in its domain, with an inflection point with respect to which the graph is symmetrical [Tsou-laris, 2001; Tsoularis and Wallace, 2002].
The mathematical description of a completed process may contribute to enhanced knowledge of the biology of plant development, indicate moments of optimum agrotechnological actions, help to forecast yields as well as indicate mor-phological and developmental differences of in -dividuals and the whole population.
The objective of the work was to examine the growth of oriental goat’s rue Galega orien-talis Lam.) during a 4-year period by means of a logistic function.
MATERIALS AND METHODS
Analysis of data was based on measurements of stem lengths of oriental goat’s rue (Galega ori-entalis Lam.) cv. Gale which were taken during a four-year period as part of a long-term experi-ment set up in 2007 at the University of Natu-ral Sciences and Humanities experimental site (52º10’N, 22º17’E Poland).
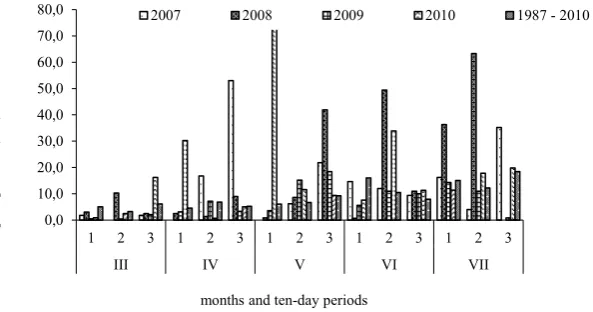
From 2007 to 2010, 70 plants were randomly selected every seven days from the start of growth to the stage of full maturity of pods. The begin-ning of growth was assumed to be the moment of forming leaf buds on root necks of the plants which overwintered. Thermal conditions and rainfall during the growing seasons are presented in Figures 1 and 2.
The temperature varied in all the study years. Relatively cool spring of 2007 saw a sudden in-crease in temperature in late April, and high tem-peratures at the end of the growing season. In the years 2008 and 2010 the beginning of the grow -ing season was characterized by quite low
tem-0,0 10,0 20,0 30,0 40,0 50,0 60,0 70,0
80,0
1 2 3 1 2 3 1 2 3 1 2 3 1 2 3
III IV V VI VII
pr
ec
ip
itatio
n (
m
m
)
months and ten-day periods
2007 2008 2009 2010 1987 - 2010
peratures, around 5oC, but later they increased
steadily. The temperature in the year 2009 was the lowest in the spring and was still around 1oC
as late as in early April. Then a sudden increase in temperature was observed.
The worst hydrological conditions were re-corded in 2007 and 2009 when the precipitation did not exceed 200 cm during the growing sea-son. Moreover, it was unevenly distributed over time. With this respect, the best year was 2010 when the high rainfall was also evenly distributed and, as a result, met the needs of plants.
The following function was used to describe the growth of oriental goat’s rue [Richards, 1969]:
t k
e
b
1
a
)t
(
y
− ⋅⋅
+
=
where: y(t) – denotes plant’s height on day t,
a – the value of asymptote,
b – an integration constant and
k – the index of growth rate.
The terms a, k and b are somehow interdepend-able. If k values are high, a values are low and de-scribe small plants. By contrast, low k values gener-ate high values, which is typical of high plants. Val-ues of the parameter b depend on initial valVal-ues and, in general, higher plants have got lower b values.
Equations of functions of average growth were estimated for each year separately. The cri-terion of goodness of fit was the determination coefficient R2, which is frequently used for this
purpose, calculated following the formula [Seber and Wild, 1989; Ryan, 1997]:
SST SSE 1
R2 = −
in which:
∑
= − = n 1 i 2 i i f ) ,y ( SSE
SST
(
y
y
)
,
n 1 i 2 i
∑
=−
=
where: yi – experimental data;
fi – values of the function fitted corre -sponding to the values yi,
y
– arithmetical mean of the experimen-tal data.Values of the coefficient are close to 1 when the fit is good, and they are close to 0 when the fit is poor. If a function examined completely dis -agree with the experimental data, the coefficient may be negative, which indicates that the function should be discarded because it is not the appropri-ate model to describe the process [Bochniak and Wesołowska-Janczarek, 2006].
Moreover, the equation of growth rate was calculated in addition to the theoretical initial value of growth and inflection points, according to the formulae [Gregorczyk, 1991]:
• equation of growth rate:
)) ( ( )
(t a y t y
a k dt
dy
• theoretical initial value of growth:
b
1
a
y
0
• coordinates of the inflection point of the function:
a
5
,
0
)
y(t
,
k
b
ln
t
i
i
In order to compare the growth patterns in individual years, the function was linearized fol-lowing the formula: lnb – k×t. Next, the hypothe-sis was checked whether or not the slopes of strait lines are equal so as to find out if the course of the straight lines examined is the same. The hypoth-esis
H
0=
k
1=
k
2=
k
3=
k
4 was checked usingTukey’s test following Elandt [1964].
All the calculations were performed using Statistica 9.0 and the Excel spreadsheet.
RESULTS
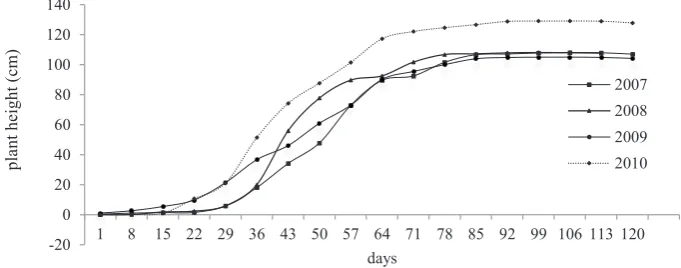
Figure 1 shows the growth of goat’s rue in the study years. It demonstrates that the growth was the best in 2010 when precipitation distribution coincided with the water needs of plants. Also function parameters, describing growth equations and growth rate equations, confirm this finding (Table 1, 2 and Figure 3). In 2010 the plants had the highest theoretical asymptotic value (param-eter a) and low values of coefficients k and b.
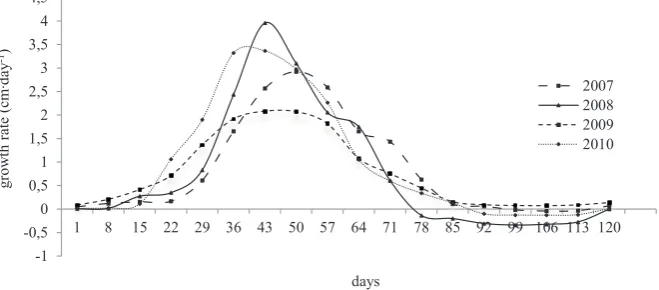
In 2010 oriental goat’s rue plants as early as after 42 days of growth reached the inflec -tion points at the stem length of 64 cm and the maximum growth rate of 3.45 cm ·day-1.
The year 2009 was the least beneficial for goat’s rue plants as it was characterised by unfa-vourable thermal and water conditions (the pre-cipitation sum did not exceed 200 mm). Low tem-perature for a long time at the start of growth did
not stimulate the growth of goat’s rue. Over the four-year period plants had the lowest empirical length of stems – 104.86, the lowest growth index k and the lowest theoretical maximal growth rate (2.12 cm in the 79th day of growth and at the stem
2007
-20 20 60 100 140
day -200
20 40 60
80
100 120
gr
ow
th
(c
m
)
2008
-20 20 60 100
day -20
20 60 100
gr
ow
th
(cm
)
2009
-20 20 60 100 140
day
-20 20 60 100
gr
ow
th
(c
m
)
2010
-20 20 60 100 140
day -20
20 60 100 140
gr
ow
th
(cm
)
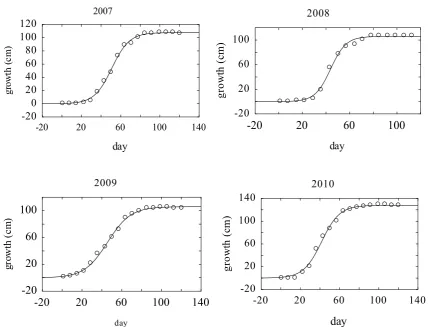
Figure 3. Fit of estimated functions to the empirical data in individual study years
Table 2. Goat’s rue growth equations and growth rate equations in the study years
Years Growth equation R2 Growth rate equation
2007 y = 107.7× [1+2.95×10²×exp(-1.11×10⁻¹t)]-1 0.998 dy/dt = 10.3×10⁻⁴×y(t)×[107.7-y(t)]
2008 y = 105.9× [1+8.06×10²×exp(-1.50×10⁻¹t)]-1 0.997 dy /dt = 14.2×10⁻⁴×y(t)×[105.9-y(t)]
2009 y = 106.0× [1+5.09×101×exp(-0.80×10⁻¹t)]-1 0.998 dy /dt = 7.8×10⁻⁴y(t)×[106.0-y(t)]
2010 y = 127.9× [1+9.19×101×exp(-1.11×10⁻¹t)]-1 0.998 dy /dt = 8.7–4×y(t)×[127.9-y(t)]
Table 1. Maximum empirical value reached by plants and logistic function parameters which approximate the elongation of goat’s rue plants in the study years
Year ymax (cm) yo (cm) Function parameters ti (day) y(ti) (cm)
dt
dy (cm∙day-1)
a b k
2007 108.0 0.268 107.7 2.95×10² 1.11×10⁻¹ 51.7 53.8 2.96
2008 108.1 0.131 105.9 8.06×10² 1.50×10⁻¹ 44.6 52.9 3.97
2009 104.9 3.04 106.0 5.09×101 0.80×10⁻¹ 49.1 53.0 2.12
2010 129.1 1.38 128.0 9.19×101 1.11×10⁻¹ 41.9 64.0 3.45
ymax – empirical maximum growth, yo – theoretical initial growth, ti, y(ti) – coordinates of inflection point, dt dy
–
length of 53 cm) (Table 1, 2). The plants of goat’s rue reached the inflection point as late as on the 52th day of growth and height of 54 cm. It was
as-sociated with maximum growth rate of almost 3 cm per day (Table 1, 2, Figure 4).
After linearization different lines were ob -tained, which was statistically confirmed. The value of F (9.40) was higher than the critical value F (3.13) so the hypothesis assuming equal regression linear coefficients (k) was refuted and the alternative hypothesis was accepted, which meant that the lines were not parallel (Figure 5).
The function applied is a good representation of the process of rue’s plant growth, as indicated by high determination coefficients as well as fig -ures demonstrating how well the estimated curves fit the empirical data (Table 2, Figure 6).
DISCUSSION
Plant growth is a complicated process which can be described by suitable mathematical
func-tions. So far, many mathematical models were developed which reflect the growth process of plants and their individual organs. Curry [1971] as well as Curry and Chen [1971] suggested a mathematical growth model of maize roots, stem and leaves. Baker et al. [1972] and Pyda [1977] developed the growth model of, respectively, cot-ton and rape plants. As science progresses, the already existing models are being replaced by new ones which produce more and more reliable values (better reflect real values) [France, 1984]. Growth processes may be described, similarly to this and other works Seidler and Gregorczyk [1986], Mustears [1989], Villegas et al. [2001], Damgaard et al. [2002], by the logistic function. Also Karadavut et al. [2008] used the logistic function to develop the model of wheat growth. As the logistic function fits empirical data well in this work, it may indicate that the function can be used to describe the growth and development of goat’s rue. Also Damgaard and Weiner [2008] and Karadavut [2009] reported a good fit of lo -gistic curve to empirical data. An appropriately
-1 -0,5 0 0,5 1 1,5 2 2,5 3 3,5 4 4,5
1 8 15 22 29 36 43 50 57 64 71 78 85 92 99 106 113 120
gr
ow
th
rate
(cm
∙d
ay
-1)
days
2007 2008 2009 2010
Figure 4. Theoretical equations of growth rate in the study years
-15 -10 -5 0 5 10
1 8 15 22 29 36 43 50 57 64 71 78 85 92 99 106 113 120
f(x)
days
2007 2008 2009 2010
Journal of Ecological Engineering Vol. 18(1), 2017
adjusted model (mathematical function) makes it easy to compare experimental data and some-times enables forecasting plant growth.
Similarly to Gregorczyk [1991], there was ob -served varied dynamics of plant elongation in in-dividual years, which was indirectly supported by the statistical comparison of lines of the estimated functions. This indicates that weather conditions had a marked impact on the growth of goat’s rue which requires quite a lot of water due to abun-dant canopy, similar findings reported by Pat -terson [1993]. The maximum theoretical growth rates calculated in this work ranged between 2.12 and 3.97 cm per days in 2009 and 2008, respec -tively. Also inflection points were different in in -dividual years. The longest inflection point was observed in 2009 and the shortest in 2010.
CONCLUSIONS
1. The logistic function enables a good approxi-mation of theoretical data to empirical data, which is supported by high values of deter-mination coefficients describing how well the growth equations determined fit the experi -mental data.
2. Weather conditions in the individual study years differently influenced the growth and de -velopment of goat’s rue, as indicated by growth function parameters, growth rate equations and linearized growth equations.
3. Asymptotic growth values ranged from 105.9 to 127.9 cm, depending on the growing season, and, in general, they were lower than the maxi-mum empirical values.
4. In individual years goat’s rue plants differed as to the maximum theoretical rate of growth and
the date at which the inflection point was ob -served. The extreme values were, respectively 1.85 cm per day and 10 days. In 2010, the in -flection point was observed on the 42th day, and
in 2007 on the 52th day of growth. Due to the
conditions of the year 2008 (rainfall which met plants’ needs), the theoretical growth rate of goat’s rue was the greatest and reached 4 cm per day whereas in 2009 the maximum growth per day was slightly above 2 cm.
REFERENCES
1. Baker D.N., Hesketh J. D., and Duncan W.G., 1972. Simulation of growth and yield in cotton. Gross photosyntesis, respiration ar growth. Crop Science, 12: 431–435.
2. Baležentienė L., 2011. Introduction and agro eco -nomical value of Galega orientalis Lam. 3rd In-ternational Symposium on Weeds and Invasive Plants, October 2–7, 2011 in Ascona, Switzerland. 3. Baležentienė L., 2009. Bioassay of phenolics ac -cumulation and activity in fodder galega (Galega orientalis Lam.) at different development stages. Agriculture, 96, 170–181.
4. Bochniak A. and Wesołowska-Janczarek M., 2006. A problem of fitting a common curve for two rep -lications on example of sprouting process of corn seeds stimulated with magnetic field. Inżynieria Rolnicza, 5, 39–47.
5. Curry R.B. and Chen L.H., 1971. Dynamic simula -tion of plant growth. Part II. Incorpora-tion of ac-tual daily weather and partitioning of net photosyn-thate. Transactions of the ASAE, 14, 1170–1174. 6. Curry R.B., 1971. Dynamic simulation of plant
growth. Part I. Development of a model. Transac-tions of the ASAE, 14, 946–959.
7. Damgaard Ch. and Weiner J., 2008. Modeling the growth of individuals in crowded plant
popula--20 0 20 40 60
80
100 120 140
1 8 15 22 29 36 43 50 57 64 71 78 85 92 99 106 113 120
pla
nt
he
ight
(c
m)
days
2007
2008 2009
2010
tions. Journal of Plant Ecology, 1 (2), 111–116. 8. Damgaard Ch., Weiner J. and Nagashima H.,
2002. Modeling the growth of individuals in plant populations: growth curves of Chemopodium al-bum at two densities. Journal of Plant Ecology, 90, 666–671.
9. Deska J. and Wyrzykowska M., 2005. Application of the path method to estimate crop components in seed production of goat’s rue (Galega orienta-lis Lam.). 51. Biom. Koll., Biometrie 2005, Halle Marz 2005, 112.
10. Deska J., 2009. Some problems of fodder galega (Galega orientalis Lam.) growing for seed in cli-matic conditions of the Siedlce Upland (in Polish). Wyd. AP w Siedlcach. Siedlce, 104 pp.
11. Deska J., Bombik A. and Rymuza K., 2012. The ef-fect of hydro-thermal conditions on the seed yield structure of fodder galega (Galega orientalis Lam.). Water-Environment-Rural Areas, 12 (2), 61–76. 12. Egamberdieva D., Berg G., Lindström, K. and
Räsänen L.A., 2010. Co-inoculation of Pseudo-monas spp. with Rhizobium improves growth and symbiotic performance of fodder galega (Galega orientalis Lam.). European Journal of Soil Biology, 46, 3–4, 269–272.
13. Elandt R., 1964. Mathematical statistics applied to agricultural experiments. PWN Warszawa, Warszawa, 595 pp.
14. Gregorczyk A., 1991. The logistic function-its ap -plication to the description and prognosis of plant growth. Acta Societatis Botanicorum Poloniae, 60(1–2), 67–76.
15. Ignaczak S., 2010. Productivity of seed plantations of fodder galega (Galega orientalis Lam.) in exten-sive utilization. Journal of Research and Applica-tions in Agricultural Engineering, 55(3), 122–127. 16. Karadavut U., 2009. Non linear models for growth
curves triticale plants under irrigation conditions. Turkish Journal of Field Crops, 4 (2), 105–110. 17. Karadavut U, Kayi S.A., Palta Ç. and Okur O.,
2008. A Growth Curve Application to Compare Plant Heights and Dry Weights of Some Wheat Va-rieties. American-Eurasian Journal of Agricultural & Environmental Sciences, 3 (6), 888–892. 18. Kozłowski S., Zielewicz W., 2013. Occurrence of
organic constituents in goat’s rue taking into
con-sideration its fodder utilization. Water-Environ-ment-Rural Areas, 44 (4), 65–76.
19. Mikkonen E., Kondo K., Lappi K., Wallenius K., Lindström, Hartikainen H. and Suominen L., 2011. Contaminant and plant-derived changes in soil chemical and microbiological indicators during fuel oil rhizoremediation with Galega orientalis. Geoderma, 160 (3–4), 336–346.
20. Mustears H..J.W., 1989. A dynamic equation for plant interaction and application to yield-density-time relations. Annals of Botany, 64, 521–531. 21. Patterson D.T., 1993. Effects of day and night
temperature on goat’s rue (Galega officinalis) and alfalfa (Medicago sativa) growth. Weed Science, 41, 38–45.
22. Pyda M., 1977. Mathematical model of rape growth (in Polish). Nowe Rolnictwo, 5, 12–13.
23. Raig H., 2001. Cutting time and frequency. In: H. Nommsalu (Editor) Fodder galega. Saku. Estonian. Research Institute of Agriculture, 55–57.
24. Richards F.J., 1969. A flexible growth function for empirical use. Journal of Experimental Botany, 10: 290–300.
25. Ryan T.P., 1997. Modern Regression Methods. Wi -ley & Sons, New York, 672 pp.
26. Seber G.A.F. and Wild C.J., 1989. Nonlinear re -gression. Wiley &Son, New York, 768 pp.
27. Seidler M. and A. Gregorczyk, 1986. A mathemati -cal description of maize leaf area growth a logistic curve. Acta Agrobotanica, 39(2), 359–365.
28. Šlepetys J., 2003. Longevity of fodder galega and grown for forage and seed on a low moor soil with removed peat layer. Agricultura, 84, 92–103. 29. Tsoularis A. and Wallace J., 2002. Analysis of
lo-gistic growth models. Mathematical Biosciences, 179, 21–55.
30. Tsoularis A., 2001. Analysis of Logistic Growth Models. Res. Lett. Inf. Math. Sci., 2, 23–46. 31. Villegas D., Aparicio N., Blanco R., and Royo C.,
2001. Biomass accumulation and main stem elon-gation of durum wheat grown under Mediterranean conditions. Annals of Botany, 88, 617–627. 32. Wesołowska-Janczarek M., 1993. Growth curves –