Meena SK et al. Int J Community Med Public Health. 2018 May;5(5):1869-1874
http://www.ijcmph.com pISSN 2394-6032 | eISSN 2394-6040
Original Research Article
Quality of life of the HIV patients in Agra: a cross sectional study
Sunil K. Meena, Sunil K. Misra, Shailendra S. Chaudhary*
INTRODUCTION
Human immunodeficiency virus (HIV) infection/ acquired immunodeficiency syndrome (AIDS) is one of the serious public health problems with severe impact on various facets of human life. Globally, an estimated 36.7 million [34.0 million -39.8 million] people living with HIV in 2015. There were 2.1 million [1.8 million–2.4 million] new HIV infections worldwide, showing a 34% decline in number of new infections from 3.4 [3.1-3.7] million in 2001.1 As per the recently released, India HIV Estimation 2015-2016 report, National adult (15–49
years) HIV prevalence in India is estimated at 0.26% (0.22%– 0.32%) in 2015. In 2015, adult HIV prevalence is estimated at 0.30% among males and at 0.22% among females.2 Traditional health indicators such as mortality and morbidity are used to measure impact of disease burden and outcome of an intervention. These indicators only quantify the disease, but do not measure quality of life (QOL) of patients, which has been described as „the missing measurement in health‟. Even though the survival of people living with HIV (PLHIV) has improved with the advent of antiretroviral therapy (ART), their life is affected by social factors like
ABSTRACT
Background: With antiretroviral therapy (ART) for human immunodeficiency virus infection (HIV) coming into picture, quality of life (QOL) has gained importance. Knowledge on the factors affecting QOL would be helpful in making important policy decisions and health care interventions. The aim of this study is to assess the quality of life of people living with HIV and to identify the factors influencing their QOL.
Methods: The Cross-sectional study was done among 160 HIV patients registered with ART Centre, at SNMC Agra (UP), India. QOL was assessed using HIV specific WHOQOLHIV-BREF questionnaire which has six domains. Association were find out by using chi square test for categorical variables and ANOVA were used for comparisons means scores among continuous variables. Correlation between continuous quantitative variables was found out by Pearson correlation coefficient.
Results: Mean age of the study subjects was 37.89 years and 61.2% of the participants were males. Quality of life score was highest in level of independence domain (12.79±2.28) and lowest in SRPB domain (10.51±3.63). A significant negative correlation (-0.49) was observed between age and physical domain. Male Subjects had significant better mean score in social and environmental domain. Family support associated with social relationship and psychological domain. Higher CD4 count is associated with better in psychological and SRPB domain. Younger age, female gender, rural background, shorter duration of HIV, non-intake of ART were the high risk factors of poor QOL.
Conclusions: Interventions such as ART, family, vocational and peer counselling would address these modifiable factors influencing QOL, thereby improving the QOL of PLWH.
Keywords: Human immunodeficiency virus, Quality of life, Social support, WHOQOLHIV-Bref Department ofCommunity Medicine, Sarojini Naidu Medical College, Agra, Uttar Pradesh, India
Received: 08 February 2018
Revised: 02 April 2018
Accepted: 03 April 2018
*Correspondence:
Dr. Shailendra S. Chaudhary, E-mail: [email protected]
Copyright: © the author(s), publisher and licensee Medip Academy. This is an open-access article distributed under the terms of the Creative Commons Attribution Non-Commercial License, which permits unrestricted non-commercial use, distribution, and reproduction in any medium, provided the original work is properly cited.
stigma/discrimination. Hence, quality of life (QOL) which gives a holistic picture of their health status has gained importance.3
Quality of life is a multi-dimensional concept. There is a lack of universally agreed definition of QOL. WHO defines QOL as “individual‟s perceptions of their position in life in context of the culture and value systems in which they live and in relation to their goals, expectations, standards and concerns”. This broader definition of QOL by WHO, indicates QOL is a subjective feeling. There are many factors which affect the QOL of patients with chronic illnesses. The identification of these factors is important in order to provide better health and social care services. Several instruments for measuring QOL have been developed and used in different settings. The validity of the WHOQOL-Bref instrument is very well established.3 There are limited studies to assess the QOL among PLWHA in this part of the country. This study assessed the QOL and some factors, influencing it among PLWHA registered at SNMC, ART Centre at Agra.
METHODS
Design and sampling
This cross sectional study was conducted during March 2016 – August 2017, based on a sample of 160 HIV patients recruited from the ART Centre of SNMC, Agra. HIV patients above 18 years willing to participate in the study were included in the study. Those HIV patients who were critically ill during the study period were excluded from the study. Ethical clearance was obtained from ethical committee of S.N. Medical College Agra.
Questionnaire
The pre-structured questionnaire consisted of 2 parts. Quality of life was assessed by WHOQOL – BREF questionnaire. Each item using 5 point Likert scale, where 1 indicates lowest (negative) perceptions and 5 indicates highest (positive) perceptions. These items were in 6 domains namely physical, psychological, level of independence, social relationships, environment and spirituality/religiousness/personal belief (SRPB). The mean score were transformed to 4–20 range. Higher the scores, better is the quality of life.3
Another part of the questionnaire included demographic information such as age, gender, place of residence, educational level, employment status and per capita monthly income. HIV related characteristics like time since diagnosis, ART use, and CD4 count were also collected.
Sample size calculation
Statistically valid sample size was drawn, based on reported 73% as the prevalence rate of adherence to ART
among HIV-infected persons receiving care in private clinics in Mumbai, India by Shah et al.4
The sample size of the study group was calculated by using the formula given below:
N = Z2α/2 PQ/L2
Zα/2 = 1.96, Value of the standard normal variate
corresponding to level of significance alpha 5%
It comes as:
N = 3.84*PQ/L2
P is the expected prevalence= 73%,
Q = 100-P = (100- 73)%= 27%,
L is the allowable error (10-20% of P). For the present study, this has been taken as 10% of P.
N, Sample size = 147 patients
Considering 10% incomplete or unusable questionnaires, a total of 160 patients were registered & interviewed.
Collection of data
The study subjects were identified during study period at ART centre, at Sarojini Naidu Medical College, Agra. Daily 3 patients were randomly selected from the OPD register of ART centre and the process was continued till the desired sample of 160 patients was reached. Every patient, who was fulfilling the inclusion criteria and visiting the ART centre was approached during each interview period. All the subjects were informed about the purpose of the study. After obtaining the informed consent, they were interviewed separately in privacy, in a language understandable to the subjects, using a pre structured questionnaire. All the information collected was based on patients self-report, with the exception of CD4 count at the start of the treatment and at present, this information was collected from the medical records.
Data analysis
RESULTS
Socio-demographic characteristics
Among 160 study subjects, 61.2% were male and 38.8% were female. The overall mean age was 37.89 years (SD=9.93). The mean age of female subjects was lower
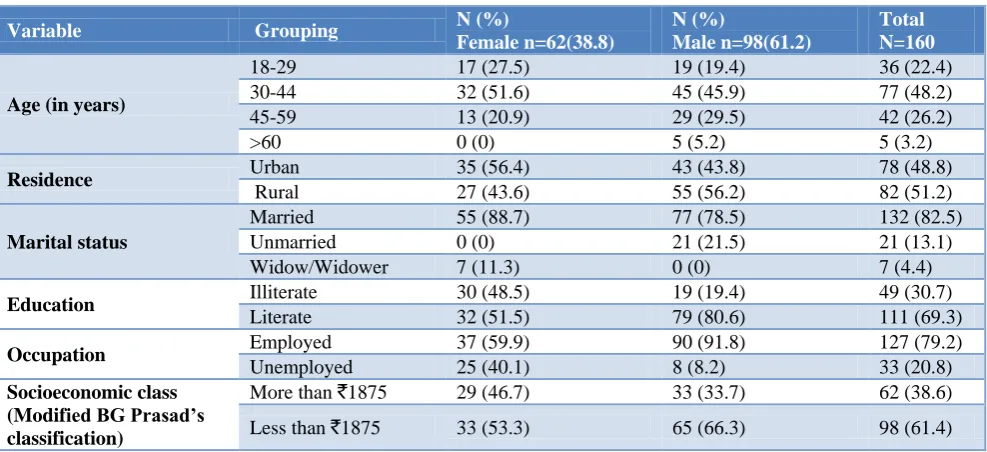
(35.58) than males (39.36), the difference is however statistically insignificant. Among all study subjects, highest proportion (48.2%) of subjects belonged to the age group of 30 to 44 years. Majority (61.4%) of the participants had per capita income less than 1875, and 30.7% of the participant‟s illiterate with only 7% of them being widowed (Table 1).
Table 1: Distribution of study population by socio-demographic characteristics.
Variable Grouping N (%)
Female n=62(38.8)
N (%)
Male n=98(61.2)
Total N=160
Age (in years)
18-29 17 (27.5) 19 (19.4) 36 (22.4)
30-44 32 (51.6) 45 (45.9) 77 (48.2)
45-59 13 (20.9) 29 (29.5) 42 (26.2)
>60 0 (0) 5 (5.2) 5 (3.2)
Residence Urban 35 (56.4) 43 (43.8) 78 (48.8)
Rural 27 (43.6) 55 (56.2) 82 (51.2)
Marital status
Married 55 (88.7) 77 (78.5) 132 (82.5)
Unmarried 0 (0) 21 (21.5) 21 (13.1)
Widow/Widower 7 (11.3) 0 (0) 7 (4.4)
Education Illiterate 30 (48.5) 19 (19.4) 49 (30.7)
Literate 32 (51.5) 79 (80.6) 111 (69.3)
Occupation Employed 37 (59.9) 90 (91.8) 127 (79.2)
Unemployed 25 (40.1) 8 (8.2) 33 (20.8)
Socioeconomic class (Modified BG Prasad’s classification)
More than `1875 29 (46.7) 33 (33.7) 62 (38.6)
Less than `1875 33 (53.3) 65 (66.3) 98 (61.4)
Note: Figure within parentheses indicate percentages.
Table 2: Distribution of study population according to HIV related characteristics (HIV disclosure to society, CD4 count, adherence to ART).
Variable Grouping Female (%)
n=62
Male (%) n=98
Total (%) N=160
HIV disclosure Disclosed 26 (41.9) 46 (46.9) 72 (45)
Not Disclosed 36 (58.1) 52 (53.1) 88 (55)
Level of CD4 count <350 40 (64.5) 70 (71.4) 110 (68.8)
>350 22 (35.5) 28 (28.6) 50 (31.2)
Adherence to ART More than 95% 51 (82.3) 88 (89.8) 139 (86.8)
Less than 95% 11 (17.7) 10 (10.2) 21 (13.2)
Note: Figure within parentheses indicate percentages.
Table 3: WHO QOL domain score.
WHO QOL domain Mean Score SD
Physical 11.95 2.02918
Psychological 11.21 2.17381
Level of independence 12.79 2.28778
Social Relationship 11.81 2.72003
Environmental 11.47 2.15387
Spiritually/religion/personal belief (SRPB) 10.51 3.63148
Overall 12.28 2.26721
HIV related characteristics of the participants. Disclosure of HIV status to society was observed in 45% study subjects. Among male 46.95% of study subjects had
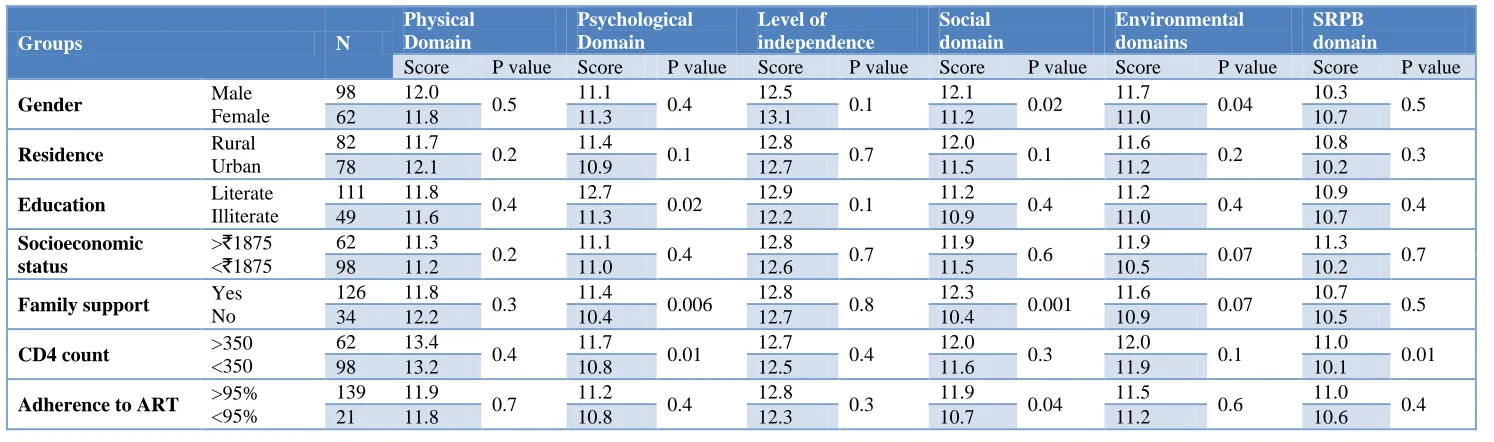
Table 4: Difference in QOL domains score according to socio-demographic and HIV related factors.
Groups N
Physical Domain
Psychological Domain
Level of independence
Social domain
Environmental domains
SRPB domain
Score P value Score P value Score P value Score P value Score P value Score P value
Gender Male
Female
98 12.0
0.5 11.1 0.4 12.5 0.1 12.1 0.02 11.7 0.04 10.3 0.5
62 11.8 11.3 13.1 11.2 11.0 10.7
Residence Rural
Urban
82 11.7
0.2 11.4 0.1 12.8 0.7 12.0 0.1 11.6 0.2 10.8 0.3
78 12.1 10.9 12.7 11.5 11.2 10.2
Education Literate
Illiterate
111 11.8
0.4 12.7 0.02 12.9 0.1 11.2 0.4 11.2 0.4 10.9 0.4
49 11.6 11.3 12.2 10.9 11.0 10.7
Socioeconomic status
>`1875 <`1875
62 11.3
0.2 11.1 0.4 12.8 0.7 11.9 0.6 11.9 0.07 11.3 0.7
98 11.2 11.0 12.6 11.5 10.5 10.2
Family support Yes
No
126 11.8
0.3 11.4 0.006 12.8 0.8 12.3 0.001 11.6 0.07 10.7 0.5
34 12.2 10.4 12.7 10.4 10.9 10.5
CD4 count >350
<350
62 13.4
0.4 11.7 0.01 12.7 0.4 12.0 0.3 12.0 0.1 11.0 0.01
98 13.2 10.8 12.5 11.6 11.9 10.1
Adherence to ART >95%
<95%
139 11.9
0.7 11.2 0.4 12.8 0.3 11.9 0.04 11.5 0.6 11.0 0.4
Among male nearly two third (71.4%) were having their CD4 count below 350 while in female group this percentage was 64.5%. Overall 13.2 percent study subjects were found to be non-adherent to ART. Adherence to ART was more among males (89.8%) as compared to females (82.3%) (Table 2).
Quality of life (QOL)
Table 3 shows the mean scores of the 6 domains of quality of life. QOL scores were high for level of independence domain (Mean=12.79, SD=2.28) and spiritually/religion/personal belief (SRPB) domain was having least score (Mean=10.51, SD=3.63). Overall mean score was derived to be 12.28 (SD=2.27). The QOL profile of subjects indicates a moderate score in all domains of QOL (Figure 1).
Figure 1: WHO QOL domains mean score.
Analysis of QOL domain scores observed significant difference of Gender with social domain and environment domain; education status with psychological domain; family support with psychological and social domain; CD4 count with psychological and SRPB domain; adherence to ART with social domain. However residual area and socioeconomic status were not found to be significantly associated with any of domains of QOL.
DISCUSSION
WHO has defined quality of life as „individual‟s perception of their position in life in the context of the culture and value systems in which they live and in relation to their goals, expectations, standards and concerns‟. In our study overall domain score of 12.28 was derived in our study which is slightly lower but comparable to other studies of Rajeev et al and Mahalakshmy et al who have reported 11.5 and 13.5 overall domain scores respectively.5,6 Highest mean score was for level of independence (12.79) whereas the lowest for SRPB domain (10.51). Similarly Mahalakshmy et al also reported highest score for level of independence and lowest score for SRPB domain.6 Contrarily Anand et al
revealed highest score for SRPB domain (14.5) and lowest for level of independence (11.8).7 In our study subjects from rural area were having better score in psychological, environment, level of independence, and SRPB domain of QOL while physical and social domains score were higher among urban subjects. Whereas Kumar et al observed subjects from urban area were having better score in all domains.8 Similarly Shukla et al has found better score in physical, psychological and environment domains among rural subjects while the higher score in social domain in urban subjects.9 In our study psychological and SRPB domain were positively correlated with CD4 count. In consonance with the present study Anand et al also found significant correlation of CD4 count with SRPB domain.7 Unlike our study they did not found correlation of CD4 count with psychological domain. In our study significantly higher psychological and social relationship domain scores were observed for the subject living with family support as compared to those living without. Unlike our study Wig et al observed significant difference in the environment domain scores of the patients in relation to the family support.10 On analysing the quality of life scores of HIV patients with adherence to ART, though a statistical difference was found in all 6 domains viz. physical, psychological, environmental, social, level of independence and SRPB (spiritual, religion and personal belief) domain but the difference was statistically significant only in case of social domain only. As in present study Shukla et al also reported significant difference in social domain though they also reported significant difference in environment domain.9
CONCLUSION
QOL in present study was found to be determined by education, income, occupation, family support and adherence to ART of the patients. QOL domains observed significant difference of Gender with social domain and environment domain; education status with psychological domain; family support with psychological and social domain; CD4 count with psychological and SRPB domain; adherence to ART with social domain. Family support and occupation provides better environment to individuals suffering from HIV/AIDS. Limitation: Sample size for the quantitative study was small and though the data is generalizable at 10% relative error, a larger sample size could have generated information closer to the reality.
ACKNOWLEDGEMENTS
We would like to acknowledge the staff at ART centre of S.N. Medical College, Agra, for his precious insights into the subject of this research work.
Funding: No funding sources Conflict of interest: None declared
Ethical approval: The study was approved by the Institutional Ethics Committeeof Sarojini Naidu medical college Agra
11.95 11.21 12.79 11.81 11.47
10.51 12.28
0 2 4 6 8 10 12
REFERENCES
1. UNAIDS. 2016 Report on the global AIDS epidemic. Available at: http://www.unaids.org/en/ KnowledgeCentre/HIVData/GlobalReport/2016/201 6_Global_report.asp. Accessed on 4 January 2018. 2. National AIDS Control Organization. Department of
AIDS Control, Ministry of Health and Family Welfare, Annual Report; 2015-16.
3. WHO. WHOQOLHIV Instrument, Users Manual, Scoring and Coding for the WHOQOL.
4. Mental Health Evidence and Research Department of Mental Health and Substance Dependence, World Health Organization, Geneva; 2002.
5. Shah B, Walshe L, Saple DG, Mehta SH, Ramnani JP, Kharkar RD, et al. Adherence to antiretroviral therapy and virologic suppression among HIV-infected persons receiving care in private clinics in Mumbai, India. Clin Infect Dis. 2007;44(9):1235-44.
6. Rajeev KH, Yuvaraj BY, Nagendra Gowda MR, Ravikumar SM. Impact of HIV/AIDS on quality of life of people living with HIV/AIDS in Chitradurga district, Karnataka. Indian J Public Health 2012;56:116-21.
7. Mahalakshmy T, Premarajan K, Hamide A. Quality of Life and its Determinants in People Living with Human Immunodeficiency Virus Infection in
Puducherry, India. Indian J Community Med. 2011;36(3):203–7.
8. Deepika A, Puri S, Mathew M. Assessment of Quality of Life of HIV-Positive People Receiving ART: An Indian Perspective. Indian J Community Med. 2012;4(6):165–9.
9. Kumar A, Girish HO, Nawaz SA, Balu PS, Kumar BV. Determinants of quality of life among people living with HIV/AIDS: a cross sectional study in central Karnataka, India. Int J Med Sci Public Health. 2014;3(11):125-8.
10. Shukla M, Agarwal M, Singh JV, Srivastava AK, Singh D. Assessment of quality of Life of HIV-Positive People on Antiretroviral Therapy in lucknow, India. Indian J Forensic Community Med. 2016;3(3):168-71.
11. Wig N, Lekshmi R, Pal H, Ahuja V, Mittal CM, Agarwal SK. The impact of HIVAIDS on the quality of life: a cross sectional study in north India. Indian J Med Sci. 2006;60(1):3-12.
Cite this article as: Meena SK, Misra SK,