Original Research Article
Patient satisfaction with ART centre services among people living with
HIV: a cross sectional study in a tertiary care hospital,
Chhattisgarh, India
Srishti Dixit*, Nirmal Verma, Neha Shrivastava, Mini Sharma,
Somen Kumar Pradhan, Shailendra Agarwal
INTRODUCTION
The global pandemic of Human Immunodeficiency Virus (HIV) infection is unprecedented in human history.1 HIV emerged as a global pandemic in the 1980s and is now endemic throughout the world, declining only slightly in the first decade of the twenty-first century.2 HIV continues to be a major global public health issue, having claimed more than 35 million lives so far. In 2015, 1.1 (940 000–1.3 million) million people died from HIV-related causes globally. Between 2000 and 2015, new HIV infections fell by 35%, AIDS-related deaths fell by 28% with some 8 million lives saved.6 The estimated
number of new HIV infections in 2015 in India was around 86 (56-129) thousand.7
The delivery of care and treatment services for people living with HIV/AIDS under the public sector is provided through ART centres, which are usually established in hospital settings like district hospitals and medical colleges. The ART centres provide comprehensive services to all PLHIV enrolled under the programme. The services include initial clinical evaluation, counselling, provision of anti retroviral drugs, prophylaxis and management of opportunistic infections, and regular follow-up of patients.
ABSTRACT
Background: ART centres provide the comprehensive care to the people living with HIV (PLHIV) in public sector. Patients‟ satisfaction is one of the commonly used outcome measures of patient care. The objective was to assess the level of satisfaction of PLHIV and factors associated with PLHIV satisfaction with the services at ART centre.
Methods: The study was a cross-sectional design carried out at a tertiary level health care centre, Raipur during March 2016 to May 2016. A total of 320 PLHIV were selected into the study using systematic sampling. A pre-designed, pre-tested questionnaire was used to obtain data from the participants.
Results: The mean age of the PLHIV was 37.76 years±8.59. The highest score was in “satisfaction with interaction with the pharmacist” (15.38±2.786), and the lowest in “satisfaction with general services” (13.67±2.822). 61.3% of all 320 respondents were satisfied with the overall services provided at ART centre. Older, less educated, those who take lesser time to reach ART centre and adherent respondents were more likely to be satisfied with the services.
Conclusions: The study shows generally high satisfaction with services but there is still need for improvement of services in some areas where the patients showed dissatisfaction.
Keywords: Satisfaction, ART centre, PLHIV
Department of Community Medicine, Pt. J. N. M. Medical College, Raipur, Chhattisgarh, India
Received: 31 March 2018
Accepted: 04 May 2018
*Correspondence:
Dr. Srishti Dixit,
E-mail: [email protected]
Copyright: © the author(s), publisher and licensee Medip Academy. This is an open-access article distributed under the terms of the Creative Commons Attribution Non-Commercial License, which permits unrestricted non-commercial use, distribution, and reproduction in any medium, provided the original work is properly cited.
The quality of medical care has been evaluated on the basis of process and structure of care, health out-comes and satisfaction with care.5 Patient satisfaction had been an important issue for health care managers and health care providers.6 The relationship between health care providers and patients (interpersonal skills) has also been reported to be the most influential factor for patient satisfaction.7 Patient-centeredness, originally defined as „„understanding each patient as a unique human being,‟‟ is now widely considered the standard for high-quality interpersonal care.8,9 Patients who report that their physicians exhibit patient-centred communication behaviours are significantly more satisfied with their care and report greater improvements in general medical condition.10-13
PLHA while availing ART services face a lot of administrative and procedural problems in hospitals which affect their level of satisfaction with services provided. Human satisfaction is a complex concept that is related to a number of factors including lifestyle, past experiences, future expectations and the value of both individual and society.14
The needs and level of satisfaction of patients is of immense epidemiological importance. This is true for patient care among those with HIV/AIDS also. It is important in improving antiretroviral therapy (ART) services, an integral part of the comprehensive response to HIV care.15
Patient satisfaction has recently emerged as an important measure of the quality of health care delivery, right alongside the more traditional health status measurements and quality of life indicators. This is based largely on the discovery that patients with higher satisfaction levels often make important behavioural changes, including: maintaining more stable relationships with health care providers and complying more closely with medical advice and treatment. Patients with higher satisfaction levels may also have improved health outcomes.14
Weakened and overloaded health systems threaten the quality of care and patient satisfaction levels, which can, in turn, seriously lessen the chances of a successful AIDS strategy. The importance of the link between human resource shortages and patient responsiveness to the ART programme, defined as the extent to which health systems meet patients' expectations of how they should be treated, has already been noted by Schneider et al.16 In a weakened health system, it is even more crucial to ensure a high quality of care and patient satisfaction, to maximize the benefits of the scarce resources. An understanding of how patients evaluate their care may help to identify deficiencies and inform improvements, to render health-care programmes more patient-centred and to increase their efficiency in a context of scarce resources.17 Satisfied patients are more likely to comply with their treatment, which is in turn associated with better clinical outcomes.18,19
As patient satisfaction is considered to be a health care outcome and predictor of treatment utilization and adherence to treatment, care and support; therefore this study is conducted to assess the level of satisfaction of PLHIV and factors associated with PLHIV satisfaction with the services at ART centre.
METHODS
A cross sectional study was conducted in ART Clinic at a tertiary level health care centre, Raipur during March 2016 to May 2016. ART Centre in Raipur was started in November 2006 and it was the first ART centre of Chhattisgarh. Taking 61.6% general satisfaction level among the PLHIVs according to previous study done by Sood et al, precision of 5.5% and confidence interval of 95%, the sample size for the study was calculated to be 303.15 For ease of calculation sample size was rounded off to 320. PLHIV of more than 18 years of age and who are on ART for at least 1 month were included in the study. PLHIV who were mentally ill, have any communication barrier, pregnant and not willing to participate in the study were excluded in the study. The participants were selected by systematic random sampling. OPD register of ART centre was taken as the sampling frame. First subject was selected randomly by lottery method from 1 to 20 number. Then every 20th PLHIV coming to ART centre was interviewed. If he/she did not fulfil the inclusion criteria then next client was interviewed consecutively.
Before taking the interview study subjects were told about the purpose of study and their informed verbal consent was taken. The participants were ensured that their identity would be kept confidential. A pre-designed, pre-tested questionnaire was used to interview the patients.
Data was entered, compiled in Microsoft excel 2007 and analysed using SPSS-16.0. Permission was taken prior to conducting the study from institutional ethics committee.
RESULTS
The baseline demographic characteristics of PLHIV are summarized in Table 1. Out of 320 study participants approximately half i.e. 42.5% of the study participants belonged to the age group of 31-40 years. The mean age of the PLHIV was 37.76 years with SD of 8.59, ranging from 20 years to 63 years. 57.2% participants were male.
70.9% of the participants were employed while 29.1% were unemployed. 49.7% participants came to ART centre from urban area while 50.3% belonged to rural area. 93.1% participants were Hindu by religion. On caste wise distribution of the study participants 38.4% were of other backward class, 35.6% were of general. 67.2% of them were married. More than half of the study participants of the study lived in nuclear family (58.4%). Distribution of study participants according to their socioeconomic status (according to modified Prasad Classification) showed that the maximum study participants belonged to lower middle class (36.6%) (Table 1).
Table 1: Distribution of PLHIV according to socio-demographic characteristics (N=320).
Socio-demographic variables Study participants
Frequency Percentage (%) Age (in completed years)
19-30 76 23.8
31-40 136 42.5
41-50 83 25.9
51-60 22 6.9
>60 3 0.9
Sex
Male 183 57.2
Female 137 42.8
Education
Illiterate 76 23.8
Upto primary 102 31.9
Upto secondary 109 34.1
College and above 33 10.2
Occupation
Labour (agriculture/non-agriculture) 78 24.4
Business/self employed/farmer 66 20.6
Service class (government/private) 65 20.3
Truck/auto/car driver and helper 18 5.6
Unemployed 93 29.1
Residence
Urban 159 49.7
Rural 161 50.3
Religion
Hindu 298 93.1
Muslim 5 1.6
Christian 17 5.3
Caste
General 114 35.6
OBC 123 38.4
SC 45 14.1
ST 38 11.9
Marital status
Married 215 67.2
Unmarried 25 7.8
Separated/divorced/widowed 80 25.0
Type of family
Joint 111 34.7
Nuclear 187 58.4
Living alone 22 6.9
Socio-demographic variables Study participants
Frequency Percentage (%) Socio-economic status (according to modified Prasad classification)
Upper class 25 7.8
Upper middle class 48 15.0
Middle class 89 27.8
Lower middle class 117 36.6
Lower class 41 12.8
Table 2: Satisfaction of PLHIV with services of the ART centre (N=320).
Variables
Mean score (standard deviation)
Percentage satisfaction
Satisfied N (%)
Dissatisfied N (%) Availability of drugs 4.09 (0.870) 254 (79.4) 66 (20.6)
Use of communication aids 3.15 (1.038) 243 (75.9) 77 (24.1)
Separate room for counselling 3.36 (1.038) 258 (80.6) 62 (19.4)
Presence of crowd in OPD 2.95 (1.210) 193 (60.3) 127 (39.7)
Satisfaction with infrastructure of ART centre 13.56 (2.865) 178 (55.6) 142 (44.4)
Comfort level to discuss matter related with disease 3.42 (1.074) 162 (50.6) 158 (49.4)
Perception that they listened to your problem 3.64 (1.125) 182 (56.9) 138 (43.1)
Availability of doctor when you needed him/her 4.21 (0.752) 283 (88.4) 37 (11.6)
Examination done by the doctor 3.62 (1.001) 164 (51.3) 156 (48.8)
Satisfaction with Interaction with the doctor 14.88 (2.806) 189 (59.1) 131 (40.9)
Comfort level to discuss matter related with disease 3.66 (1.153) 195 (60.9) 125 (39.1)
Perception that they listened to your problem 3.64 (1.125) 182 (56.9) 138 (43.1)
Availability of counselor when you needed him/her 3.77 (0.934) 203 (63.4) 117 (36.6)
Counselling done by the counsellor 3.51 (0.933) 162 (50.6) 158 (49.4)
Satisfaction with interaction with the counselor 14.58 (2.880) 177 (55.3) 143 (44.7)
Comfort level to discuss matter related with disease 3.87 (1.115) 195 (60.9) 125 (39.1)
Perception that they listened to your problem 3.88 (1.095) 202 (63.1) 118 (36.9)
Availability of pharmacist when you needed him/her 4.11 (0.961) 227 (70.9) 93 (29.1)
Instructions given by the pharmacis. 3.52 (0.930) 285 (89.1) 35 (10.9)
Satisfaction with interaction with the pharmacist 15.38 (2.786) 169 (52.8) 151 (47.2)
Laboratory services 2.76 (1.320) 178 (55.6) 142 (44.4)
Referral services 3.99 (0.955) 231 (72.2) 89 (27.8)
Waiting time 3.15 (1.038) 243 (75.9) 77 (24.1)
Experience on maintenance of confidentiality 3.77 (0.998) 190 (59.4) 130 (40.6)
Satisfaction with general services 13.67 (2.822) 179 (55.9) 141 (44.1)
Overall services 72.07 (12.17) 196 (61.2) 124 (38.8)
Table 3: Factors associated with PLHIV’s satisfaction with ART centre services (N=320).
Variables Satisfied (N=196) Dissatisfied (N=124) Odds ratio
(95% CI) P value
No. (%) No. (%) Age group
≤40 120 (56.6) 92 (43.4) 0.549 (0.335-0.900)
0.017
>40 76 (70.4) 32 (29.6) 1
Sex
Male 110 (60.1) 73 (39.9) 0.894 (0.567-1.409)
0.628
Female 86 (62.8) 51 (37.2) 1
Education
Upto primary 120 (67.4) 58 (32.6) 1.797 (1.140-2.832)
0.012
Above primary 76 (53.5) 66 (46.5) 1
Occupation
Employed 138 (60.8) 89 (39.2) 0.936 (0.569-1.538)
0.793
Unemployed 58 (62.4) 35 (37.6) 1
Variables Satisfied (N=196) Dissatisfied (N=124) Odds ratio
(95% CI) P value
No. (%) No. (%) Residence
Urban 98 (61.6) 61 (38.4) 1.033 (0.659-1.619)
0.888
Rural 98 (60.9) 63 (39.1) 1
Marital status
Married 136 (63.3) 79 (36.7) 1.291 (0.802-2.078)
0.292
Single 60 (57.1) 45 (42.9) 1
Time since ART started (in months)/treatment period
≤12 34 (59.60) 23 (40.4) 0.922 (0.514-1.654)
0.784
≥12 162 (61.6) 101 (38.4) 1
Side effects
Present 88 (56.8) 67 (43.2) 0.693 (0.441-1.089)
0.112
Absent 108 (65.5) 57 (34.5) 1
CD4 count (cells/mm3) at the start of ART
≤200 96 (62.7) 57 (37.3) 1.128 (0.719-1.771)
0.599
>200 100 (59.9) 67 (40.1) 1
WHO AIDS staging at the start of ART
Stage 1 & 2 153 (59.1) 106 (40.9) 0.604 (0.330-1.105)
0.102
Stage 3 & 4 43 (70.5) 18 (29.5) 1
Number of hospitalizations due to HIV related illness since the start of ART
Never 162 (63.3) 94 (36.7) 1.521 (0.875-2.643)
0.137
Once and more 34 (53.1) 30 (46.9) 1
Adherence
Adherent 167 (64.5) 92 (35.5) 2.003 (1.140-3.158)
0.016
Non-adherent 29 (47.5) 32 (52.5) 1
Distance to the ART centre (in kms)
≤50 130 (65.0) 70 (35.0) 1.519 (0.957-2.413)
0.076
>50 66 (55.0) 54 (45.0) 1
Time to reach ART centre (in hours)
≤1 103 (66.5) 52 (33.5) 1.712 (1.037-2.827)
0.036
>1 59 (53.6) 51 (46.4) 1
Cost incurred to collect drugs (INR)
≤50 101 (64.7) 55 (35.3) 1.334 (0.849-2.095)
0.211
>51 95 (57.9) 69 (42.1) 1
Believe that ART prevents HIV/AIDS progression
Yes 46 (56.8) 35 (43.2) 0.780 (0.467-1.301)
0.756
No 150 (62.8) 89 (37.2) 1
Believe will get sicker if you stop taking their medication
Yes 92 (62.2) 56 (37.8) 1.074 (0.684-1.687)
0.341
No 104 (60.5) 68 (39.5) 1
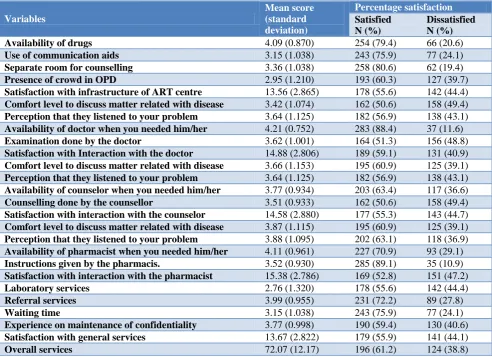
Table 2 shows the mean satisfaction score of components, domains and overall satisfaction score. In a band score of (0; 5), the mean scores of all components were variable; it was the highest in “Availability of doctor when you needed him/her” (4.21±0.752), and the lowest in “laboratory services” (2.76±1.320). In a band score of (0; 20), the mean scores of all domains were high; it was the highest in “Satisfaction with Interaction with the pharmacist” (15.38±2.786), and the lowest in “satisfaction with general services” (13.67±2.822). The percentages of respondents completely satisfied with infrastructure of ART centre, interaction with the doctor, counsellor, pharmacist and with general services are 55.6%, 59.1%, 55.3%, 52.8% and 55.9% respectively.
The respondents were most satisfied with the component “instructions given by the pharmacist” (89.1%) and least satisfied with component “comfort level to discuss matter related with disease with the doctor” (50.6%) and “counselling done by the counsellor” (50.6%). 61.3% of all 320 respondents were satisfied with the overall services provided at ART centre (Table 2).
centre (OR=1.712, p=0.036) and adherent to HAART (OR= 2.003, p=0.016) (Table 3).
DISCUSSION
Patient satisfaction is a response to the evaluation of services, consumption and their experience. Patient satisfaction with medical services is an area of less
research because of issues of measurement,
reproducibility and interpretation. Findings in the study are consistent with previous studies, which assessed patient satisfaction with HIV/AIDS care and treatment services.
The mean age of the respondents was 37.76±8.59 years, which is similar to what was observed in previous studies i.e. Sood et al, Beach et al, Sullivan et al.5,15,20 These similarities in mean age seen at the ART clinics may reflect the fact that most people present to the clinic within the age range of 31 to 40 years & most of the participants belonged to the same age group in this study (42.5%). Patients who reported their provider knows them „„as a person‟‟ were older.20
More than half of the patients were male in this study. Similarly almost half of the HIV / AIDS patients were male in study done in North-West India.15 Contrary to this study most of the participants were male in study done by Sullivan et al. & Devnani et al. respectively.5,14 23.8% of participants were illiterate in this study while a study done in Chandigarh 90% participants were literate.14 Similar to this study almost 20% participants were unemployed in study done by Bhagat et al.21 While more than 70% of patients were unemployed or had unstable jobs in other study.23 In this study almost half of the participants were from rural area which is same as study done in Chandigarh.14 While up to 75.2% of the respondents were resident in urban areas in study done by Oche et al.23 Most of the respondents were married in this study which is similar to studies done by Tran et al, Devnani et al.14,22
Drug delivery is one of the most important component of ART services. Almost 80% participants were satisfied with availability of drugs. Though only 1.2% of participants were not satisfied with the availability of drugs in the study done in Nigeria.23 80% of participants were satisfied with the presence of separate counselling room. Almost all of patients were satisfied with the condition of consulting room in study done by Oche et al.
In this study almost 60% participants were satisfied with their interaction with doctor. Various factors influence the satisfaction level as Beach et al. in their study suggests that there are modifiable factors such as remembering a patient‟s name, establishing good rapport, listening carefully, asking questions to learn about their lives and later remembering and following up on this information with patients might be useful to providers interested in improving their relationships with patients.20 In a study done in Boston patients reported being comfortable discussing Personal issues, understanding the instructions that physician‟s gave regarding HIV
infection, medications, and treatment plans well and perceiving their physicians as empathetic and more than half of the sample reported complete satisfaction with primary care physicians.5 67.8% of participants were satisfied with the time spent with the doctor in study done by Sood et al.15 All participants felt comfortable in talking to Doctor and said that doctors listened to their problems patiently in study done by Devnani et al.14 Satisfaction of participants with feel of ease with doctor, ability to tell problem, listening of problem, understanding complaints, attitude towards patient, explained effectively, help in improving health was more than 85% in study done by Bhagat et al.21
Assessment of patients‟ satisfaction with medical care reflects not only their interaction with physician but also specific attributes of non-physician staff, attributes of the clinic, and related services such as laboratory and general features of the institution. In this study satisfaction with the interaction with counsellor and pharmacist was also assessed separately. 92.5% of participants said health education talk was given to them during the visit in study done by Oche et al.23 In other study 74% of participants were satisfied with the behaviour of staff.14 Similarly the Staff Construct was associated with overall satisfaction in study done by Dang et al.24
More than half of participants were satisfied with the laboratory services of the ART centre while
99.2% of participants were satisfied with waiting time in the laboratory in study done in Nigeria.23
Time spent in various activities specially waiting time, is considered very strongly to be associated with patient satisfaction. Wait time has also been cited as a source of patient dissatisfaction in many studies.25 75.9% of the participants were satisfied with the waiting time in this study while 99.2% of participants were satisfied with the waiting time at ART centre in another study.23 On the other hand proportion of respondents who were completely satisfied with waiting time was 44.6% in another study.22 Maintenance of confidentiality of HIV status of a patient is essential because of social stigma attached to the disease. Only 60.1% of respondents were satisfied with the confidentiality maintained by the ART centre in study done in Vietnam.22 While the mean score for confidentiality of personal information in the hospital as perceived by patients was high in study done by Devnani et al.14
61.2% of participants were satisfied with overall services of ART centre. Similar finding was obtained in study done by Sood et al (61.6%).15 While levels of general satisfaction were higher in other studies.14,23,26
attainment and age in study done in Nigeria similar to this study.23 While higher satisfaction with the primary care physician was found among women, patients with lower income and those reporting better health status in study done by Sullivan et al.5 Lower satisfaction with „„quality and convenience‟‟ was found in men, the richest group, and in patients who had higher CD4 cell counts in study done in Vietnam.22 The chronicity of the disease requires constant care and treatment facilities puts a lot of financial burden on the patient. Though the treatment is free, there is loss of daily wages and travel cost when they have to travel large distances to collect their medicines every month.
Quality of patient-provider relationship is significantly associated with adherence to HAART.27,28 Other study suggests that the essence of patient-centeredness may be one important aspect of patient adherence and may directly influence the health of patients with HIV.20
Though patients‟ believe that ART prevents HIV/AIDS progression and they will get sicker if stopped taking their medication were not significantly related to their patients. While in other study patients who reported their provider knows them „„as a person‟‟ reported more positive beliefs about HAART therapy and believe that they would get sick if don‟t take Medicines.20
Limitation of the study is that satisfaction over time could not be measured as it was a cross sectional, also it was possible to establish association but not causal relationship. Because of assessment of single location, the findings of this study should not be generalised.
CONCLUSION
In conclusion understanding what accounts for patient impression, particularly patients‟ perception of their relation with doctor, counsellor & pharmacist is critical to implementing quality improvement efforts. This study shows high levels of patient satisfaction with services provided at ART center in Chhattisgarh, India. The high levels of satisfaction showed by patients should encourage health care providers to continue providing high quality services in order to even increase and sustain patients‟ satisfaction. The factors associated with patients‟ satisfaction level have also been assessed. Better quality ART Services can be provided to PLHIV by addressing these factors.
Funding: No funding sources Conflict of interest: None declared
Ethical approval: The study was approved by the Institutional Ethics Committee
REFERENCES
1. Kilmarx PH. Global epidemiology of HIV. Current Opinion in HIV and AIDS. 2009;4(4):240-6.
2. Vermund SH, Leigh-Brown AJ. The HIV epidemic:
high-income countries. Cold Spring Harbor
perspectives in medicine. 2012;2(5):a007195.
3. WHO, Media centre, HIV/AIDS, Fact sheet,
Updated November 2016. Available at:
http://www.who.int/mediacentre/factsheets/fs360/en /. Assessed on 8 June 2017.
4. NACO Annual Report 2016-17, Chapter 24
Available at: http://naco.gov.in/sites/default/files/ NACO%20ANNUAL%20REPORT%202016-17.pdf. Assessed on 10 July 2017.
5. Sullivan LM, Stein MD, Savetsky JB, Samet JH. The Doctor–Patient Relationship and HIV‐infected Patients' Satisfaction with Primary Care Physicians. J General Internal Med. 2000;15(7):462-9.
6. Young GJ, Meterko M, Desai KR. Patient
satisfaction with hospital care: Effects of demographic and institutional characteristics. Med care. 2000;38:325-34.
7. Cleary PD, McNiel BJ. Patient satisfaction as an indicator of quality of care. Inquiry. 1998;25:25-36. 8. Balint E. The possibilities of patient-centred
medicine. J Roy Coll GenPract. 1969;17:269–76. 9. Committee on Quality Health Care in America.
Crossing the Quality Chasm: A New Health system for the 21st Century. Washington, DC: National Academy Press; 2001.
10. Kaplan SH, Gandek B, Greenfield S, Rogers W, Ware JE Jr. Patient and visit characteristics related to physicians‟ participatory decision-making style. Results from the medical outcomes study. Med Care. 1995;33:1176–87.
11. Brody DS, Miller SM, Lerman CE, Smith DG, Caputo GC. Patient perception of involvement in medical care: relationship to illness attitudes and outcomes. J Gen Intern Med. 1989;4:506–11. 12. Lerman CE, Brody DS, Caputo GC, Smith DG,
Lazaro CG, Wolfson HG. Patients‟ perceived involvement in care scale: relationship to attitudes about illness and medical care. J Gen Intern Med. 1990;5:29–33.
13. Brody DS, Miller SM, Lerman CE, Smith DG, Caputo GC. Patient perception of involvement in medical care: relationship to illness attitudes and outcomes. J Gen Intern Med. 1989;4:506–11. 14. Devnani M, Gupta AK, Wanchu A, Sharma RK.
Factors associated with health service satisfaction among people living with HIV/AIDS: a cross sectional study at ART center in Chandigarh, India. AIDS care. 2012;24(1):100-7.
15. Sood A, Mazta S, Sharma A, Bhardwaj A, Raina SK, Chander V. Scoring satisfaction among patients, attending ART Centre of a medical college in north-west India. AIDS care. 2013;25(12):1477-80.
17. Wensing M, Grol R. Patients' views on health-care: a driving force for improvement in disease management. Disease Management and Health Outcome. 2000;7(3):117-25.
18. Renzi C, Abeni D, Picardi A, Agostini E, Melchi CF, Pasquini P, et al. Factors associated with patient satisfaction with care among dermatological outpatients. Br J Dermatol. 2001;145:617-23. 19. Sandoval GA, Levington C, Blackstien-Hirsch P,
Brown AD: Selecting predictors of cancer patients' overall perceptions of the quality of care received. Ann Oncol. 2005;17(1):151-6.
20. Beach MC, Keruly J, Moore RD. Is the Quality of the Patient‐Provider Relationship Associated with Better Adherence and Health Outcomes for Patients with HIV? J General Internal Med. 2006;21(6):661-5.
21. Kishor BV, Pal DK, Lodha Rama S, Bankwar V. Clients‟ satisfaction with Anti retroviral therapy services at Hamidia Hospital Bhopal. National J Community Med. 2011;2(2):241-3.
22. Tran BX, Nguyen NP. Patient satisfaction with
HIV/AIDS care and treatment in the
decentralization of services delivery in Vietnam. PloS one. 2012;7(10):e46680.
23. Okafoagu N, Ango JT, Gana G, Kaoje AU, Raji MO, Oche MO, et al. Clients satisfaction with anti retroviral therapy services in a tertiary hospital in Sokoto, Nigeria. J AIDS HIV Res. 2013;5(9):328-33.
24. Dang BN, Westbrook RA, Rodriguez-Barradas MC,
Giordano TP. Identifying drivers of overall satisfaction in patients receiving HIV primary care:
a cross-sectional study. PLoS One.
2012;7(8):e42980.
25. Wouters E, Heunis C, van Rensburg D, Meulemans
H. Patient satisfaction with antiretroviral services at primary health-care facilities in the Free State, South Africa–a two-year study using four waves of cross-sectional data. BMC Health Services Res. 2008;8(1):210.
26. Suvorova A, Belyakov A, Makhamatova A, Ustinov
A, Levina O, Tulupyev A, Niccolai L, Rassokhin V, Heimer R. Comparison of satisfaction with care between two different models of HIV care delivery
in St. Petersburg, Russia. AIDS Care.
2015;27(10):1309-16.
27. Schneider J, Kaplan SH, Greenfield S, Li W, Wilson IB. Better physician- patient relationships are associated with higher reported adherence to antiretroviral therapy in patients with HIV infection. J Gen Intern Med. 2004;19:1096–103.
28. Bakken S, Holzemer WL, Brown MA, Powell-Cope
GM, Turner JG, Inouye J, et al. Relationships between perception of engagement with health care provider and demographic characteristics, health status, and adherence to therapeutic regimen in persons with HIV/AIDS. AIDS Patient Care STDS. 2000;14:189–97.