Themed Section : Engineering and Technology
Content Based Image Retrieval using Multi Channel Decoded
Local Binary Patterns with Relevant Feedback
Mumthaz Muhammed M1, Amitha Mathew2
1 M.Tech Scholar, Department of Computer Science and Engineering, Rajagiri School of Engineering and
Technology, Ernakulam, Kerala, India
2 Assistant Professor, Department of Computer Science and Engineering, Rajagiri School of Engineering and
Technology, Ernakulam, Kerala, India ABSTRACT
The tremendous growth in the multimedia applications has resulted in exponential growth in the size of the image database. The proper management, retrieval and indexing of relevant images based on a context may affect the proper functioning of the systems in various image related applications. Content based image processing is an essential and efficient tool which rectifies the issue by putting more emphasis on content of the image rather than texts, tags or annotations. The content of the image can be extracted by using various image features including color, texture and shape. The selection of proper features in various applications is important as it may affect the efficiency of the entire system. The proposed system is to develop a content based retrieval mechanism which will provide semantically close query results quickly and efficiently with the help of relevant feedback. The relevant feedback can increase the level of perception and quality of query results during the successive levels. The comparison of the images are done based on the distance measures such as Euclidean distance, squared Euclidean distance, L1 distance, chi-square distance, earth movers distance and cosine distance.
Keywords: CBIR, TBIR, Relevance Feedback.
I.
INTRODUCTIONA single image can convey more idea than 1000 words.
Moreover, human brain is capable of processing images faster rather than words. These are some of the reasons why the images are being used in many of the applications to make its working more effective. This tremendous growth in the multimedia applications has resulted in exponential growth in the size of the image database. So there arise a need for proper management and efficient retrieval of these images. Two methods for retrieving similar images are:
Content based image retrieval
The former one retrieves the similar images by comparing the images with the tags, texts or naming used to annotate the images, while the latter one retrieves by actually comparing the contents. Text based retrieval scheme have many issues including rise in the semantic gap and ambiguity level, subjective nature of images and is a time killing process. Content based retrieval process overcomes these issues by actually comparing its contents.
amount of discrepancies with the retrieval results. This discrepancy is due to the semantic gap problem.
Semantic gap problem is nothing but the difference between the interpretation about the concepts of an individual and that by a system, in a particular situation. It is very difficult to predict the region of interest from a complex picture from an individual‟s perspective. For example, in the figure 1, mountain and the lake make the scene complex and the choice is completely with the user to analyze whether it is a mountain, lake or even an island. This problem can be removed by having human intervention in decision making process. The decision made on the retrieval results by choosing the relevant images, in the form of feedback can be given to the system to make it more effective. The performance of the system can be improved by providing the user with a provision to select the relevant or irrelevant images from the given set of retrieved images.
Fig. 1. Natural Scene
II.
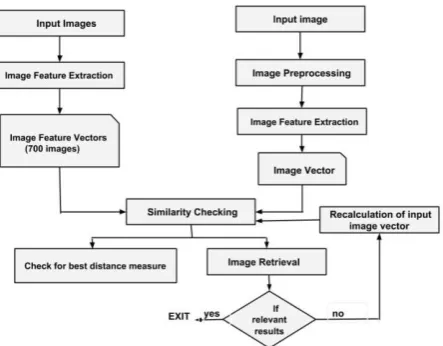
PROPOSED METHODThe main objective of content based image retrieval is to retrieve the similar images based on their contents. The contents of an image are calculated by their features. Some of the features which are commonly used are explained in [2], [4], [5] and [6]. The block diagram of the proposed system is shown in figure 2.
Fig. 2. Block diagram of CBIR
Fig. 3. Flow Chart of the Proposed System
A.Database and Input Images
The system provides an option to the user regarding the selection of a particular query image either from the test image database or from the outside of the image database. The images in the database are of dimension 256 * 384 or as 384 * 256. The database used in the method is Corel-1k, which consist of 1000 images in 10 classes of categories. The various categories include Africans, beaches, monuments, dinosaurs, elephants, horses, roses, buses, mountains and foods.
B. Image Preprocessing
All the images in the Corel-1k database are of dimensions 256*384 or in 384*256. Since the proposed system accepts the query image from the outside database, it needs to be as the same size. In addition to that, it is very difficult to process the over sized images and is a time consuming task. The resizing of the image is the process changing the size of image without changing the number of pixels. It is actually the arrangement of these pixels in a loosely or closely manner. The inputted query image needs to be resized to the dimensions 256*384 or in 384*256.
C. Feature Extraction
1) Multi channel decoded local binary pattern: The LBP operator works with single channel and during computation most of the information gets suppressed after converting into binary form. So the best practice is to evaluate by each channel. Multichannel decoded local binary pattern is based on[4]:
Multichannel adder based LBP
Multichannel decoder based LBP
For an n input color channel, multichannel adder based LBP produces n+1 output and decoded based LBP Forms 2^n output levels.
2) HSV color histogram: HSV color space is closer to human perception towards the color. It is in the form of a three dimensional inverted cone. The central line indicates the intensity value. The input image should be converted into HSV color space. Hue indicates the color intensities expressed in terms of their angular dimensions which ranges from 0º to 360º. Saturation indicates the percentage of gray in the image and value point the intensity. Each component in HSV scale is being properly scaled. The hue is scaled to 8 groups, saturation to 2 groups and value to 2 groups. Finally we get a 32 component histogram after treating all these groups together. The variation in number of groups indicates the degree of priority or importance. The order of priority is as, hue followed by value and then saturation. Each pixel is converted into its corresponding HSV value and the histogram for that pixel is computed. Later each pixel contributes in making full histogram.
Color moment feature set, which is used for feature extraction in image processing, includes mean, standard deviation, kurtosis and skewness. Mean and standard deviation are also known as first order color moment and second order color moment, and are the lower color moment. These lower values provide more information than the higher moments. Various color moments can be formulated as[2]:
Mean: indicates an average value of color in the entire image and can be formulated as:
∑ ( )
(1)
where is the value of the jth pixel in the color
channel i and N is the total number of pixel
Standard Deviation: Square root of variance is the standard deviation. Variance is actually the variation from the mean value. It is formulated as:
√ ∑ (2)
Skewness : It indicates the asymmetry in color distribution and is formulated as:
√ ∑ (3)
Kurtosis: it is similar to the skewness, in addition to the color it also specifies shape information, i.e how tall or short from the normal distribution.
4) Color auto-correlogram: Histogram contributes information regarding the number of times each of the color in the bins get repeated in the entire image and do not provide information about the neighboring pixel colors. In simple words, histogram is the probability of finding a pixel of a particular color in the entire image. That is, histogram cannot provide spatial information about the neighboring pixels.
Color auto correlogram, unlike histogram, provide a mapping between the spatial relation of colors(in pixel pairs) with distance. In other words it is
probability of finding a pixel of color at a distance „d‟ away from another pixel and can be formulated as[1]:
| | (4)
By this method, no two similar image can have same correlogram as in the case of histogram.
5) Color and edge directivity descriptor: Color and edge directivity descriptor(CEDD)[3] is a joint feature which extracts the color and texture information from the image. It is low level feature. It extracts the information into a 144 bin histogram, 24 bin for color and 6 bin for texture feature. It involves two steps:
Extracting color information: A two step fuzzy linking system is used for extracting color information. Firstly image is converted into HSV color space. In the first step, 20 fuzzy rules in addition with the 3 input channels produce a 10 bin quantized histogram. Each bin is presetted with a set of colors as Red to Orange, Orange, Yellow, Green, Cyan, Blue, Magenta and Blue to Red. It is done based on the vertical edge position in the input image.
In the second step, the value of pixels in S and V, 10 bin histogram and additional 4 fuzzy rules produce a 24 bin histogram. The 24 bins colors are Black, Grey, White, Dark Red, Red, Light Red, Dark Orange, Orange, Light Orange, Dark Yellow, Yellow, Light Yellow, Dark Green, Green, Light Green, Dark Cyan, Cyan, Light Cyan, Dark Blue, Blue, Light Blue, Dark Magenta, Magenta, Light Magenta.
6) Wavelet packet decomposition: Wavelet packet decomposition divides the input image based on the frequency into various sub-bands. It is also known as sub band tree, which is a wavelet transform where time signal is passed through more filters to form a full binary tree. It is decomposed into 4 levels:
LL- Approximation coefficient
LH- Horizontal detail coefficient
HL- Vertical detail coefficient
HH- Horizontal detail coefficient
In order to generate next level, all the detail as well as approximation coefficients are taken. For n levels of decomposition, it forms different coefficients.
The above said feature of the input image is extracted and is stored as a feature vector of dimension 3414. The dimension of the features such as Multi-channel adder based LBP, multi-channel decoder based LBP, HSV histogram, color moments, color auto correlogram, color and edge directivity descriptor and wavelet packet decomposition are 1024, 2048, 32, 6, 128, 144 and 32 respectively. The feature vector of the query image is thus computed and is stored for comparison.
D. Similarity Checking
The main objective in the similarity checking is to retrieve the similar images based on the query image. The similarity between the query image and that of the images in the database are calculated by means of distance measure. The distance measures are applied to the feature vectors. The distance between the feature vector of the query image and the entire database images are calculated. For that, feature vectors of the input image and that of the entire images are compared using various distance measures.
1) Selecting the best distance measure: The distance measures used in the proposed system are:
Eucleidian distance
Squared Eucleidian distance
Chi-Square distance
L1 distance
Cosine distance
emd distance
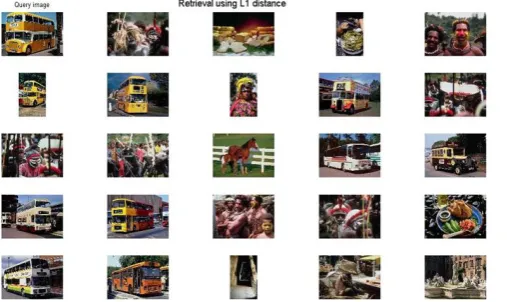
Based on the calculations and the analysis, best among them is the chi-square and that the worst is the emd distance. The results of this analysis are shown in the figures 4, 5, 6, 7, 8 and 9. So the first phase of similarity is calculated by choosing the distance measure as ‟chi-square‟.
Fig. 4. Retrieval results using Euclidean distance
Fig. 5. Retrieval results using Squared Eucleidian distance
Fig. 6. Retrieval results using Chi-Square distance
Fig. 7. Retrieval results using L1 distance
Fig. 8. Retrieval results using Cosine distance
Fig. 9. Retrieval results using emd distance
subsequent retrievals. Figure 11 shows a typical marking of a retrieval result.
Fig. 10. Retrieval feedback
Updation of the feature vector: The feature vectors of the relevant images are properly indexed and mean of the relevant images‟ feature vectors are calculated.
∑ ( )
(5)
Where N is the total number of images which are selected as relevant. This mean is of the same dimension as that of feature vector, i.e., 3414. Thus the input image feature vector gets updated iteratively.
Calculating similarity: The similarity is measured by chi-square distance metric. Then the distance between the updated feature vector and that of the images in the database are calculated and are sorted. Then the irrelevant images gets updated by the images having less distance value. The figure 12 shows the images of second iteration of the relevant feedback. The relevant images are also marked. Note that the number of relevant images has increased from the previous results.
Fig. 12. Second iteration results
III.
RESULTS AND DISCUSSIONThe images in the database are of dimension 256 * 384 or as 384 * 256. The database used in the method is Corel-1k, which consist of 1000 images in 10 classes of categories. The various categories include Africans, beaches, monuments, dinosaurs, elephants, horses, roses, buses, mountains and foods. The feature vector of the database images are extracted aforetime. Then the test image is tested to retrieve the similar images.
IV.
CONCLUSIONThe spontaneous information gain has resulted in large data. The proper tool for effective management of these data can be done by using content based image retrieval. The proposed system reduces the semantic gap problem by intervening user. It mainly analyze the original data contents. Several feature extraction and similarity measurements are analyzed. It is very well understood that all methods work well for different purposes. The proper selection of features based on various applications can help in improving the efficiency of the system. Selection of chi-square distance from various distance measure yields better result and helps to retrieve images faster. Relevance Feedback involve the user in decision making thus reducing the semantic gap problem. Multi channel decoded Local Binary Pattern is one of the efficient way to extract the features for analyzing the images.
V.
REFERENCES[1] Jing Huang, S.R. Kumar, M. Mitra, Wei-Jing Zhu, R. Zabih, „Image indexing using color correlograms.”, Computer Vision and Pattern recognition, 1997. Proceedings., 1997 IEEE Computer Society Conference on Computer Vision and Pattern Recognition, 17-19 June 1997.
[2] Naveena A K and N.K. Narayanan, “Image Retrieval using combination of Color, Texture
and Shape Descriptor.”, International Conference on Next Generation Intelligent Systems (ICNGIS), 2016.
[3] Savvas A. Chatzichristofis and Yiannis S. Boutalis, “CEDD: Color and edge directivity descriptor: A compact descriptor for image indexing and retrieval.” Proceedings of the 6th International Conference on Computer Vision Systems (ICVS08), pp. 312322, 2008.
[4] Shiv Ram Dubey, Satish Kumar Singh and Rajat Kumar Singh, “Multichannel Decoded Local Binary Patterns for Content Based Image Retrieval.” IEEE Transactions on Image Processing,Volume: 25, Sept. 2016.
[5] Dr. S. D. Ruikar and Rohit S. Kabade, “Content Based Image Retrieval by Combining Feature vector.” International Conference on Wireless Communications, Signal Processing and Networking (WiSPNET), Vol. 25, Sept. 2016. [6] Nidhi Tripathi, Pankaj Sharna and Manish