Quality of life among Visually Impaired Elderly People
KHADIJEH FALAHATY
1, LOKE SENG CHEONG
1and MUHAMMAD BIN HAJI MOHD ISA
21Institute of Gerontology,Universiti Putra Malaysia, 43400 UPM Serdang, Selangor Darul Ehsan,
Malaysia
2Ophthalmology Department, Faculty of Medicine and Health Sciences,Universiti Putra Malaysia,
43400 UPM Serdang, Selangor Darul Ehsan, Malaysia Corresponding author E-mail: Muhammad@medic.upm.edu.my
DOI: http://dx.doi.org/10.13005/bpj/895
(Received: August 10, 2015; accepted: November 05, 2015) ABSTRACT
The purpose of this study was to determine factors are associated to visual impairment and assess quality of life among two welfare home residents. A cross-sectional design was employed to determine the factors that are associated with visual impairment among elderly people. A total of 150 subjects were selected by simple random sampling from two welfare homes (Cheras in Selangor, and Seremban) in Malaysia. The socio-demographic variables (age, gender, ethnicity, income), health behavior (smoking) and self-reported medical condition (diabetic, eye disease, hypertension, heart disease, and stroke) were examined in relationship with visual impairment. Instruments used in this study included eye exam test by Snellen E Chart and a list of questions about socio-demographic factors, health behavior and self-reported medical conditions and disease. Data analyzes were carried out using SPSS, 20. Descriptive analysis such as mean, standard deviation (SD) and frequency were utilized to describe the characteristics of the respondents. The mean age of respondents was 69 years (SD = 7.31). A chi-square test (Pd” 0.05) and multiple linear regression (R2=0.64) analyzes were utilized to determine predictors of
visual impairment. Also independent t test were utilized to determine quality of life among elderly people. It was found that the majority respondents had visual impairment (46%) and blindness (28%) in compare with normal vision (26%).Sociodemographic factors (age,gender,ethnicity,income) health behavior (smoking) and disease (diabetic,eye disease, heart disease, hypertension and stroke) were associated to visual impairment. Also the subjects with visual impairment had poorer quality of life than subjects without visual impairment. The results indicated the important role of visual impairment on quality of life among elderly people. Health care providers are in position to prevent and control of visual impairment. Visual impairment should be acknowledged and emphasized in policy and intervention programs are needed to improve quality of life in older Malaysians.
Key word: visual impairment, quality of life, welfare homes, elderly.
INTRODUCTION
The ageing population has become a global phenomenon. World Health Organization revealed that the cohort of 60 years and above is expected to increase globally from 600 million in 2000 to 1.2 billion in 2050 (World Health Organization, 2006).
Malaysia like many other countries world-wide is experiencing the population aging phenomenon, owing to declining fertility rates combined with increasing life expectancy over the latter half of the 20th century (Ong, 2002). With
people were visually impaired that 39 million were blind and 246 million had low vision. About 90% of the worlds visually impaired lived in developing countries. Globally, uncorrected refractive errors were the main cause of visual impairment. Cataracts remained the leading cause of blindness in middle and low income countries. The number of visually impaired people from infectious diseases had greatly reduced in the last 20 years and 80% of all visual impairments could have been avoided or cured (WHO, 2011). Visual impair ment and blindness are recognized as important determinants of decreased quality of Life (Jacobs et al, 2005).The impact of visual impairment on quality of life includes loss of independent living, loss of confidence and depression (McDonnall, 2009).Likewise age related eye diseases was found to be associated with physical impairment and poorer health related quality of life (Datta, 2008; Li Y et al, 2011). Despite the rapid ageing of the population and increasing number of visually impaired elderly, there is a little study about visual impairment among elderly people in Malaysia. Consequently, it is necessary to do this research and identify factors which affect the visual impairment among elderly people. Investigating about risk factors that predict visual impairment among elderly can be useful for identifying needs in treatment and rehabilitation services, planning and implementing blindness prevention programs, and determining priorities for aging population. The purpose of this study is to determine the factors that are associated with visual impairment and quality of life of older persons in two welfare homes in Malaysia.
Research Framework
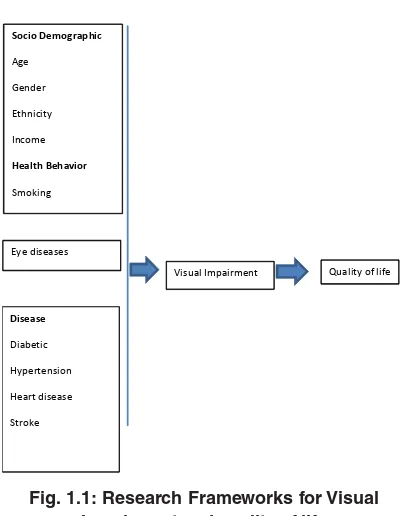
Based on the literature review that examined the visual impairment; risk factors for visual impairment and the association between visual impairment and quality of life a research framework is proposed. The framework classifies three types of risk factors; first, socio-demographic factors, secondly, health behavior factors and thirdly, diseases or impairment. The socio-demographic factors include age, gender, ethnicity and socioeconomic. Health behavior includes smoking. In this framework, diseases are classified as medical conditions such as: Diabetic, eye disease, hypertension, heart disease and stroke. The
outcomes in this research framework are visual impairment and quality of life. Visual impairment is defined as scores of Snellen E Chart .A global evaluation item is used to measure quality of life. Risk factors of visual impairment in old age Socio demographic factors
Age
Visual acuity (VA) declines and the prevalence of visual impairment increases with increasing age; Visual acuity declines with age and this deterioration is faster in higher age (Klein et al., 2006). The prevalence of visual impairment increases from 0–0.6% in persons aged 40–49 years to 3–12% in persons aged 70 years and older and to 6–27% in persons aged 80 years and older (Häkkinen 1984;Tielsch et al., 1990;Ponte et al., 1994;Hirvelä &Laatikainen, 1995;Taylor et al., 1997;Cedrone et al., 2006).
Gender
A meta-analysis of population-based surveys on blindness prevalence in Asia, Africa, and the industrialized countries in 2000 indicated that women bear approximately two-thirds of the burden of blindness in the world (Abou-Gareeb, 2001). Two large population-based surveys in Africa showed a statistically higher prevalence of blindness (adjusted for age) among women compared to men.
Ethnicity
Many of the differences by race can also be attributed to interactions between race and life expectancy, as well as health disparities, and socioeconomic variables. A study in UK reported that blacks and south Asians had a higher prevalence of visual impairment compared to white people (Sivaprasad et al., 2012). According to the chronic disease center (CDC) in 2006 year, the prevalence of “vision troubles” among African Americans is 9.4%, but only 8.9% for their white counterparts. According to The Eye Diseases Prevalence Research Group (2004a), the specific pathological causes of blindness and visual impairment differ by race.
Socioeconomic (income)
poorer access tocorrective lenses. A study in Malaysia reported that the prevalence of visual impairment and blindness varies geographically due to socio-economic factors, availability of health services and awareness of eye diseases among the population (Thevi et al., 2012). Having a low income and lower Educational attainment were significantly associated with reported vision problems (Anthony et al., 2010).
Health behavior factors in visual impairment Smoking
Smoking is linked to self-reported visual impairment among older adults with age-related eye diseases, particularly cataract and age-related macular degeneration (Xinzhi Zhang,Theodore,&Thompson, 2011). Smoking is thought to depress antioxidant levels, decrease luteal pigments in the retina, activate the immune system, reduce choroid blood flow, reduce drug detoxification by the retinal pigment epithelium, and potentiate nicotine antigenic activities, all of which have been hypothesized to be involved in the pathogenesis of AMD(Ivan et al., 2004).
Disease and impairments
Eye Disease affecting vision in old age
In addition to normal age related changes in vision, many primary ocular disease as well as systematic disease affect visual functions. Age related macular degeneration (AMD) is an ocular disease that causes damage to the retinal macula, mostly in the older people. AMD is a disease that gradually destroys sharp, central vision ultimately leaving the affected individual with only orienting vision and the peripheral visual field (Binder &Falkner –Radler, 2008).
Central vision is needed for seeing objects clearly and for common daily tasks.AMD occurs in two main forms: wet and dry. Wet AMD occurs when abnormal blood vessels behind the retina start to grow under the macula. These new blood vessels tend to be very fragile and leak blood and fluid .the blood and fluid raise the macula from its normal place.
Damage to the macula and consequently loss of central vision may occur rapidly in days or weeks. Dry AMD occurs when the light sensitive
cells in the macula slowly break down gradually blurring central vision (Saari, 2001).normal aging processes can lead to structural and blow flow changes that can predispose patients to AMD, also advanced aged does not inevitably cause AMD .however age as well as family history smoking and hypertension are considered risk factors for age related macular degeneration (Ting et al., 2009). AMD is the leading cause of visual deterioration and legal blindness in patients over 60 years of age in the western world (Congdon et al., 2004).
Cataract is a common cause of visual loss in older population (Congdon et al., 2004). cataract occurs as the lens become cloudy and yellowish with aging .the normal lens is clear .cataract reduces visual acuity and the loss of transparency in the lens may also contribute to a decrease in the ability to discriminate colours .in addition to advanced age smoking diabetes and exposure to UVB light have consistently been identified as risk factors for cataract development(Abraham et al., 2006).the prevalence cataract increases significantly with age from 2%in persons under 65to 67%in those aged 85 or older(Laitinen et al., 2009).
Glaucoma is considered one of the leading causes of visual impairment in the world .primary open angle glaucoma is the most common form of the disease, representing around 90% of all cases (Gupta, 2005). Risk factors for glaucoma include age (glaucoma is significantly more common after age 45), family history, diabetes, and most notably, race/ethnicity (Ryskulova et al., 2008).Anthony et al in 2010 year, reported that Cataracts, diabetes, and glaucoma in particular, weresignificantly associated with reported vision problems (Anthony et al., 2010).
Diabetic
is one of the leading causes of visual loss in older people. Diabetic retinopathy is the result of micro vascular retinal changes.
Heart disease
A recent meta-analysis of nine cohort studies failed to demonstrate any significant association between primary open-angle glaucoma and all-cause or cardiovascular mortality (Ophthalmology, 2011). Studies examining the association between retinal vein occlusion (RVO) and mortality have found as much as a two-fold increase in the risk of cardiovascular mortality in persons with RVO (Cugati, 2007). Other systematic disease especially cardiovascular disease, hypertension, thyroid and romatoide disease, may affect the eye (Saari, 2001). Cataract may be associated with cardiovascular disease, diabetes and hypertension (Borger et al., 2003). Cataract has also shown to be associated with increased cancer and cardiovascular mortality risk (Thiagarajan et al., 2005).
Hypertension
Systolic blood pressure was identified as the major correlate of intraocular pressure (IOP) (Paul& Foster1, 2011).Hypertension and diabetes were associated to the prevalence of visual impairment (George & Ploubidis, 2012). Hypertensive retinopathy refers to retinal micro vascular signs that are related to raise blood pressure (Wong TY, 2001).
Stroke
Stroke can lead to a variety of ocular motility disorders including infra nuclear cranial nerve palsies, supra nuclear gaze disorders, intern clear ophthalmoplegia, nystagmus and ocular dysmetria (C, 2003).Visual field loss has many causes but is a well-recognized complication of stroke, with an incidence in acute stroke patients reported as 20% (Allen , 1988).
Quality of life
Definition of Quality of Life
Quality of life is a personal idea that is not easily defined or explained and there is no consensus on its definition (Arnold, 1991; Bowling, Banister, Sutton, Evans, & Windsor, 2002; Ormel, Lindenberg, Steverink, & Vonkorff, 1997). World
Health Organization (WHO) (1997) conceptualized it as “an individual’s perception of their position in life in the context of the culture and value systems in which they live and in relation to their goals, expectations, standards and concerns”.
Disability and Quality of Life
Quality of life is relevant to all outcomes of the stages in the disablement process in determining how individuals cope (Lamb, 1996; Pope & Tarlov, 1991). As mentioned earlier there were few studies on disability and quality of life of older people with disability. Disability has considerable negative impact on older person’s quality of life (Hellström, Persson, & Hallberg, 2004; Hellström, Andersson & Hallberg 2004). A study from Taiwan by Tseng and Wang (2001) found that for older people residing in nursing homes, higher educational level, higher socioeconomic status, better physical function and activities of daily living, social support provided by families and the frequency of interaction with the families were significantly related to higher overall quality of life. Social support from nurses, nursing aids and family members had a significant positive relationship with quality of life but longer time of residence in a nursing home was associated with lower overall quality of life.
Vision relation to quality of life
World Health Organization (1996) defines quality of life as; Quality of life is defined as individual’s perceptions of their position in life in the context of the culture and value system where they live, and in relation to their goals, expectations, standards and concerns. It is a broad ranging concept, incorporating in a complex way a person’s physical health, psychological state, level of independence, social relationships, personal beliefs and relationship to salient features of the environment.
2000). Promoting independence, limiting disability, preventing secondary problems, and promoting wise use of health services are all necessary components of minimizing the effects of shrinking resources as larger numbers of older persons require services. Attending to quality of life and the importance of helping persons adjust to and manage their health problems is a way of avoiding more costly situations such as nursing homes and hospitals(Kemp, et al., 2004; Nesbitt & Heidrich, 2000).
Measurement of Quality of Life
Considering quality of life focuses on the person, and each person views it differently, using multidimensional scales to assess quality of life is vital. A variety of self-administered measurements have been developed to assess quality of life (McDowell, 2006) such as global, generic or specific instruments. Global scales have been developed to measure quality of life that may be a single question about overall quality of life or an instrument that assesses satisfaction in several domains (Scott & Garrood, 2000). The Sickness Impact Profile (SIP) was developed as a measure of perceived health status to assess the impact of disease on physical behavior. The Nottingham Health Profile (NHP) was a shorter scale than the SIP that evaluate the level of emotional, social, and physical distress that is caused by ill health. These two scales more closely measure HRQOL than general quality of life.
MATERIAL AND METHODS
A cross-sectional design, utilizing eye exam and questionnaire was employed in this study. In the first step elderly people 60 years and above were asked to participate in the survey. In the second step those who agreed to participate were written informed consent. The survey was conducted in two welfare homes in Serdang and Seremban states of the Malaysia country. Every registered elderly who live in welfare homes had a recorded document called personal file in the welfare home center.
According to inclusion and exclusion criteria and using a complete list of identification number for every older people the simple random sampling (using computer) was used to select every
subject for this study. We invited and explained for elderly people in coming to this study and fortunately most of them accepted.
The study adopted face to face interview technique for questionnaires to gather data. It has done from the first day of august 2012 through the first day of November 2012.
Independent variable measurement Socio-demographic characteristics
Age was used as a continuous variable for descriptive purposes. For the analysis, age was categorized into age groups and coded as 1 = 60 -69 years, 2 = 70-79 years, 3 = 80 years and above. Gender was dichotomous, dummy coded variable and coded as male = 1 and Female = 2 .Ethnicity was defined as Malay, Chinese, Indian and others (Malay= 0, Chinese = 1, Indian=2 and others=3).Income was a continuous variable and thus was recoded as a two categorical variable: 1= RM 1-49, 2= RM 50-99.
Health behaviors
A single item that used to assess health behavior statues was smoking. Cigarette smoking statues was categorized at baseline as those who never smoked ,were former smokers or who currently smoked .those who never smoked were identified according to the question “ have you ever smoked at least 100 cigarettes in your entire life?” Those with a history of smoking were asked “do you smoke cigarettes now?” to distinguish former from current smokers.
Dependent variables
The three main outcomes of the study were any visual impairment, disability and quality of life. The assessment in visual impairment was done by Snellen E Chart and the determination of disability status as measured by ADL and IADL difficulties was based on the respondent’s reported difficulties to perform the six activities of daily living and eight instrumental activities of daily living. Quality of life was based on the respondent’s subjective or perceived overall quality of life. Eye exam test by snellen e chart
standardized measure for visual analysis (DB, 1983). This assessment is widely used because it can be understood by literate and illiterate individuals, and it is easy-to-use and low-cost (Lee, 2003). The test is performed with the individual seated six meters from the chart, which is fixed to the wall at eye level of the assessed individual. The individual must state the direction that the letter “E” faces (up, down, right or left).
Measurement of Quality of Life
A variety of self-administered measurements have been developed to assess quality of life (McDowell, 2006) such as global, generic or specific instruments. Global scales have been developed to measure quality of life that may be a single question about overall quality of life or an instrument that assesses satisfaction in several domains (Scott & Garrood, 2000).
The Sickness Impact Profile (SIP) was developed as a measure of perceived health status to assess the impact of disease on physical behavior. The Nottingham Health Profile (NHP) was a shorter scale than the SIP that evaluate the level of emotional, social, and physical distress that is caused by ill health. These two scales more closely measure HRQOL than general quality of life. The Medical Outcomes Study (MOS) a 36-item Short Form Health Survey (SF-36) is another frequently used generic instrument that recognizes physical symptoms and the subjective aspects of quality of life, including social and emotional issues. The World Health Organization Quality of Life-100 (WHOQOL-100) is a cross-culturally validated assessment of well-being that focuses on multiple dimensions of quality of life, including 100 items 34 representing 25 facets that is organized into six domains. Also in pretest for this study, we used of SF12 for measuring quality of life but of 20 elderly only third person could answer to questions. We were trying for using another questionnaire but unfortunately elderly were confused for questions and leave the study.
Justification for using single question in perceived quality of life
There is no “gold standard” and there is no “external criterion of quality of life against which measures could be tested” (Hunt, 1997, p.206).
Since quality of life is a subjective concept, the best way to derive ratings of importance would be by asking respondents directly what is important for their quality of life or to ask respondents to rate the various aspects of life on a scale of importance to their quality of life (Saxena et al, 2001). The fundamental issue is to determine what is important to the person’s quality of life, taking into account the cultural orientation of an individual. Bowling (2005) postulates “if one question works, why ask several?” (p.344). Single item measures have obvious benefits for research in terms of reduced burden and costs and ease of interpretation. Quality of life
Quality of life was defined as a personal construct influenced by the cultural orientation of the individual. It is the respondent’s evaluation of his/her life contents as was pointed out by Gill and Feinstein (1994), quality of life is a uniquely personal perception. A single item, perceived quality of life was used to measure overall quality of life (QOL). Respondents were asked, “Overall, how would you describe your quality of life? Excellent, good, moderate, poor or very poor” Responses were coded as very poor = 0, poor = 1, moderate = 2, good = 3, or excellent = 4.
Statistical analysis
Prior to analyzing data, a new data file that integrates the relevant measures was created. Data were analyzed using the Statistical Package for the Social Sciences (SPSS 20, for Windows). Descriptive statistics including mean, standard deviation, frequency, and percentage were used to describe socio demographic characteristic, health behavior status, and self-reported medical condition, the prevalence of visual impairment, disability and quality of life. For analyses a p value d” 0.05 (two-sided) was considered as significant.
RESULTS Exploratory Data Analysis (EDA)
Fig. 1.1: Research Frameworks for Visual Impairment and quality of life
RISKFACTORS
Socio Demographic
Age
Gender
Ethnicity
Income
Health Behavior
Smoking
Visual Impairment Quality of life
Eye diseases
Disease
Diabetic
Hypertension
Heart disease
Stroke
Table 1: The inclusion and exclusion criteria for the subjects
Inclusion criteria Exclusion criteria
Age 60 years or above Patient too ill
Patient with written informed consent No written informed consent No dementia or other mental disease dementia or other mental disease skewness and kurtosis. According to the rule of
thumb, a variable is reasonably close to normal if its skewness falls between -1.0 and +1.0, and kurtosis has value between –2.0 and +2.0 (Peat & Barton, 2005).
Independent variable
Socio-demographic characteristics
The sample consisted of 150 persons living in the two welfare homes in Malaysia, ranging in age from 60 to 92 ages. Table 4.2 presents the socio-demographic characteristics of the respondents. The mean age of the sample was 69.39 age (S.D. = 7.31). The majority of the respondents were aged between 60 and 69 age (86%), 47.0% were aged between 70 - 79 age, and
about17.0% were aged 80 years and over. Respondents comprised the different ethnic groups in Malaysia; Malays (41.3%), Chinese (25.3%), Indians (24%), and Others slightly more than nine percent (9.3%). More than half of the respondents reported a monthly income less than RM49.00 (67.3%).
Health behavior
The health behavioral characteristics of the respondents are presented in Table 4.3. More than half of the respondents were smoked in former (57.3%), current smoker (15.3) and about twenty seven percent (27.3%) never smoked
Self-reported medical condition or disease Table 4.4 displays the prevalence of medical conditions or disease reported by the respondents. The most common medical conditions or disease were diabetes mellitus (78.7%), hypertension (76.7%), heart disease (76.0%), eye disease (76.0%), and stroke (56.7).
Prevalence of visual impairment and blindness Table 4.5 shows to the prevalence of visual statues reported by the elderly to snellen E chart. The normal vision (6/6- 6/12) among welfare home residents were about 26%, impaired vision (6/18-6/36) reported 46% and blindness (6/60) 28%. Prevalence of Blindness, Visual Impairment and Adequate Vision by Selected Socio Demographic Characteristics, Health Behavior (Smoking) And Self-Reported Medical Condition (Disease)
Table 4.2: Percentage distribution of socio-demographic characteristics
Demographic n %
characteristic Age group
60-69 86 53.7
70-79 47 31.3
80+ 11.3
Age (means ± SD) 17
Gender 69.39 ±7.31 46.0
Male 69 54.0
Female 81
Ethnicity 41.3
Malay 62 25.3
Chinese 38 24.0
Indian 36 9.3
othersincome 14 67.3
Less than RM 49 101 32.7
RM 50- RM 99 49 32± 47
Income (means ± SD)
Table 4.3: Percentage distribution of health behavior characteristics
Health behavior characteristics n % Smoking statues
Never smoked 41 27.3
Former 86 57.3
Current 23 15.3
Table 4.4: Prevalence of self-reported medical condition or disease
Medical condition n %
Diabetic 118 78.7
Eye disease 114 76.0
Heart disease 114 76.0
Hypertension 115 76.7
Stroke 85 56.7
Table 4.5: The Prevalence of visual impairment among elderly
Visual acuity group n %
Normal (6/6 – 6/12) 39 26.0 Impairment (6/18-6/36) 69 46.0
Blind (6/60) 42 28.0
increased with age ranging from 34.6% in subjects 60-69 years of age to more than 71% in subjects 70-79 years of age. Female subjects (54.5%) were somewhat more like to be visually impaired compared to males (47.6%).Also female subjects (36.9%) more like to be were blind in compared to males (15.2). Although Chinese subjects were more like to be visually impaired (73.7%) but Malay subjects were more to be blind (33.9%) compared to other races. additionally lower level socioeconomic was associated to increasing visual impairment (51.9%).
Smoking statues was correlated with impaired vision although former smokers had a
higher prevalence of visual impairment (36%) and blindness (21.3%) compared to current smokers or subjects who never smoked. Also subjects with diabetic, eye disease, heart disease, hypertension and stroke were significantly more likely to be blind or visually impaired (p<0.01).
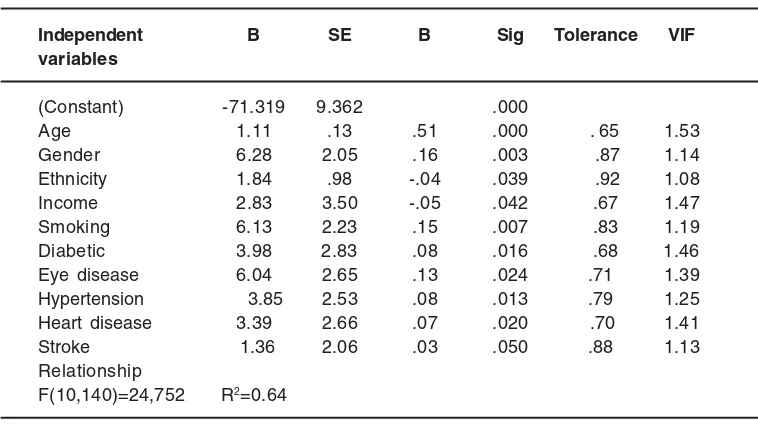
Multiple Regressions
Table 4.11 displays the results of the enter method multiple regression analysis utilizing visual impairment as the dependent variable. The variables which entered the regression model were age, gender, ethnicity, income, smoking, diabetic, eye disease, heart disease, hypertension and stroke in relationship.
Table 4.9: Prevalence of blindness, visual impairment and adequate vision by selected socio demographic characteristics
Normal Impairment Blind Total χχχχχ2
(6/6-6/12) (6/18-6/36) (6/60)
n % n % n % n
Age group
60-69 31 59.6 18 34.6 3 5.8 52 19.27
70-79 2 3.0 48 71.6 17 25.8 67
80+ 0 0.0 10 32.3 21 67.7 31
Gender
Male 20 30.3 36 47.6 10 15.2 66 10.44
Female 13 15.5 40 54.5 31 36.9 84
Ethnicity
Malay 13 21.0 28 45.2 21 33.9 62 16.59
Chinese 2 5.3 28 73.7 8 21.1 38
Indian 13 36.1 14 38.9 9 25.0 36
Other 5 35.7 6 42.9 3 21.4 14
Income
RM 0-RM49 22 16.8 68 51.9 41 31.3 131 19.00
RM50-RM99 11 57.9 8 42.1 0 0.0 19
P<0.05
Table 4.10: Prevalence of blindness, visual impairment and adequate vision by selected health behavior (smoking) and self-reported medical condition (disease)
Normal Impairment Blind Total χχχχχ2
(6/6-6/12) (6/18-6/36) (6/60)
n % n % n % n
Smoking
Former 0 0.0 54 62.8 32 37.2 86 43.32
Current 0 0.0 14 60.9 9 39.1 23
Nonsmoker 33 22.0 8 5.3 0 0.0 41
Disease
Diabetic 16 13.6 63 53.4 39 33.1 118 25.33
Eye disease 12 10.5 64 56.1 38 33.1 114 37.48
Heartdisease 14 12.3 62 54.4 38 33.3 114 27.94
hypertension 19 16.5 58 50.4 38 33.0 115 12.60
Stroke 15 17.6 47 55.3 23 27.1 85 12.52
P<0.05
heart disease, hypertension, stroke and visual impairment.
Objective two
An independent t test revealed a significant difference in mean quality of life scores
Table 4.11: Result of Multiple Regressions to predict visual impairment of elderly people
Independent B SE B Sig Tolerance VIF
variables
(Constant) -71.319 9.362 .000
Age 1.11 .13 .51 .000 . 65 1.53
Gender 6.28 2.05 .16 .003 .87 1.14
Ethnicity 1.84 .98 -.04 .039 .92 1.08
Income 2.83 3.50 -.05 .042 .67 1.47
Smoking 6.13 2.23 .15 .007 .83 1.19
Diabetic 3.98 2.83 .08 .016 .68 1.46
Eye disease 6.04 2.65 .13 .024 .71 1.39
Hypertension 3.85 2.53 .08 .013 .79 1.25
Heart disease 3.39 2.66 .07 .020 .70 1.41
Stroke 1.36 2.06 .03 .050 .88 1.13 Relationship
F(10,140)=24,752 R2=0.64
P< 0.05
increasing visual impairment quality of life is decreasing.
DISCUSSION
The first specific objective for this study is: to determine the relationships between socio-demographic factors (age, gender, ethnicity and income), health behavior factors (smoking) and diseases (diabetes mellitus, eye diseases, hypertension, heart disease and stroke) and visual impairment among elderly. This finding showed that with increasing age, vision will be decreased. On the whole, the results of this study was consistent with and support current literature (Munoz et al., 2000;Sjöstrand, Laatikainen, Hirvela, Popovic, & Jonsson, 2011) which found that visual impairment increased significantly with increasing age. Other finding from the study showed that sex significantly contributed toward visual impairment. Older women reported higher level of visual problems than men. This results in general replication of past findings that older women had lower levels of vision than male counterparts (Kyari, 2009;Herrieth ,et al., 2011)), because women are less likely to express a need for sight due to fear of being seen as a burden, and some household heads seem to be
more inclined to support surgery for elderly men than elderly women(Geneau, 2005).
eye diseases and visual impairment is another result of regression model. This result is parallel with other studies about eye disease and visual impair ment (Binder &Falkner –Radler 2008; Congdon et al.2004). Also heart disease had a significant association with visual impairment .the relationship between heart disease and visual impairment reported in some studies (Ophthalmology, 2011; Cugati S, 2007).moreover hypertension had a significant association with visual impairment in regression model. Some studies reported that persons with increasing blood pressure are more probably to report visual impairment (Paul J, Foster L, 2011; George B, Ploubidis, 2012) and finally stroke had a significant association with visual impairment in regression model. The results of some studies confirmed the relationship between stroke and visual impairment (C, 2003; Simon JE, 2003). The second specific objective for this study is assessing the effect of visual impairment on quality of life among elderly people. The findings, showing that the visually impaired subjects had lower level of quality of life than the subjects without visual impairment. Furthermore, vision loss has a negative impact on health-related quality-of-life (Lamoureoux, 2009). Summery
In this cross sectional study, predictors of visual impairment in elderly people in Malaysia were examined. 150 older people were selected by simple random sampling in two welfare homes (Cheras in Selongor and Seremban). Instrument used in this study included the eye exam by Snellen
E Chart, quality of life scale and other questionnaire about socio demographic factors, health behavior and self-reported medical conditions. Data analyses were carried out using SPSS, 20. The mean age was 69.39 age (S.D. = 7.31). Malay respondents were more (41.3%), in compare to Chinese (25.3%), Indians (24%), and Other races (9.3%).Female gender were (54%) more than male (46%). More than half of the respondents reported a monthly income less than RM49.00 (67.3%).it was found that former smoking (54% )and older people with diabetic (78%) were more in compare to other disease in this study. the major ity respondents had visual impairment (46%) and blindness (28%) in compare with normal vision (26%). A chi-square test showed that visual impairment increased with age ranging from 34.6% in subjects 60-69 years of age to more than 71% in subjects 70-79 years of age. Female subjects (54.5%) were somewhat more like to be visually impaired compared to males (47.6%). Although Chinese subjects were more like to be visually impaired (73.7%) but Malay subjects were more to be blind (33.9%) compared to other races. additionally lower level socioeconomic was associated to increasing visual impairment (51.9%). analysis of multiple linear regression showed that age, gender, race, income, smoking statues, diabetes, eye disease, heart disease, hypertension and stroke associated to visual impairment. Follow up analysis showed that quality of life of respondents was different based on visual impairment. Respondents with visual impairment reported significantly lower quality of life than the respondents with normal vision.
REFERENCES
1. Abraham AG, Condon NG,West Gover E. The new epidemiology of cataract. Ophthalmology Clinics of North America 19: 415-425 (2006).
2. Abou-Gareeb I, L. S., Bassett K, Courtright P. Gender and Blindness: A Meta-Analysis of Population-Based Prevalence Surveys. Ophthalmic Epidemiol. 8: 39–56 (2001). 3. AHRQ, 2010. Vision rehabilitation: Care and
benefit plan models. Available at: http:// w w w . a h r q . g o v / c l i n i c / v i s i o n /
vision1.htm#definitionandgoals.
4. Asbell PA, D. I., Mindel J, BrocksD, AhmadM, EpsteinS. (2005). Age-related cataract. Lancet, 365: 599–609 (2005).
5. Allen CM, M. M., Wade DT. (1988). The Management of Acute Stroke. Kent: Castle House Publications,. 172–176.
Essentials of statistics for business and economics. Boston, Massachusetts: South-Western College ((2008)).
8. Artal.P, Aging effects on the optics of the eye. In: Cavallotti CA, Cerulli L.(Ads) Age related changes of the human eye. Rome, Italy: Human Press.pp.35-40 (2008).
9. Arokiasamy, J.T. Demography and epidemiology aspects of ageing in the developing world: Focus on Malaysia. Retrieved December 12, 2006 , from http:// www5.Jaring.my/gem/epidemo.htm1 10. Arias, E. (2010). United States life tables,
2006. In National Vital Statistics Report, 58(21). Hyattsville, MD: National Center for Health Statistics.
11. Arnold, S. B. (1991). Measurement of quality of life in the frail elderly. In J. E. Birren, J. E. Lubben, J. C. Rowe & D. E. Deutchman (Eds.), The concept and measurement of quality of life in the frail elderly (pp50-73). San Diego: Harcourt Brace Jovanovich.
12. Attebo K, Mitchell P, and Smith w, (1996): visual acuity and the causes of visual loss in australia. The Blue Mountains eye study. Ophthalmology 103: 357-364
13. Australian Institute of Health and Welfare. Vision problems among older Australians (Bulletin No.27, AIHW Cat.No. AUS 60). Canberra: ABS (2005).
14. Bertelsen G, P. T., Lindekleiv H, Schirmer H, Solbu MD, Toft I, Sjølie AK, Njølstad I. Tromsø eye study: prevalence and risk factors of diabetic retinopathy. C (2012),
15. M. Visual problems following stroke and their effect on rehabilitation. Br Orthopt J, 60: 10– 14 (2003).
16. Berger S, P. F. The association between low vision and function. J Aging Health., 20(5): 504-525 (2008).
17. Bergner, M., Bobbitt, R., Carter, W., & Gilson, B. The Sickness Impact Profile: development and final revision of a health status measure. Medical Care, 19(8), 787-805 (1981). 18. Berhane Y, W. A., Bejiga A, Adamu L,
Alemayehu W, Bedri A, et al. Prevalence and causes of blindness and low vision in Ethiopia. Ethiop J Health Dev. 21: 204–210 (2007).
19. Brezin AP, L. A., Fagnani F, Mesbah M,
Berdeaux G. Prevalence and burden of self-reported blindness, low vision, and visual impairment in the French community: A nationwide survey. Arch Ophthalmol, 123: 1117-1124 (2005).
20. Brody, B.L., Gamst, A.C, Williams, R.A., Smith, A.R., Lau, P.W., Dolnak, D., Rapaport, M.H., Kaplan, R.M., & Brown, S.I. Depression,visualacuity,comorbidity,and disability associated with age related macular degeneration. Ophthalmology, 108(10): 1893-1900 (2001).
21. Broman, A. T., Munoz, B., Rodriguez, J., et al. The impact of visual impairment and eye disease on vision-related quality of life in a Mexican American population: Proyecto VER. Investi-gative Ophthalmology & Visual Science, 43(11): 3393–3398 (2002). 22. Borglin, G., Jakobsson, U., Edberg, A., &
Hallberg, I. R. Older people in Sweden with various degrees of present quality of life: their health, social support, everyday activities and sense of coherence. Health and Social Care in the Community, 14 (2), 136-146 (2006).
23. Borger PH.Van Leeuwen R,Hulsman CA,Wolfs RC,Van der kuip DA, Hofman A,De Jong PT. Is there a direct association between age related eye diseases and mortality?The Roterdom Study. Ophtalmology 110: 1292-1296 (2003).
24. Bowling, A., Banister, D., Sutton, S., Evans, O., & Windsor, J. A multi-dimensional model of the quality of life in older ages. Aging & Mental Health, 6(4): 355-371 (2002). 25. Bowling, A. Just one question: If one question
works, why ask several? Journal of Epidemiology and Community Health, 59: 342 - 345 (2005).
26. Bonnel S.Sahel JA. The aging of the retina. experimental gerontology 38: 825-831 (2003).
27. Bicas HE. Acuidade visual. Medidas e notações. Arq Bras Oftalmol. 65: 375-84 (2002).
(2008).
29. Biddle, S., & Mutrie, N. Psychology of physical activity: Determinants, well-being, and interventions: Routledge (2008).
30. Buch H,Vinding T,Ia cour M,Jensen GB,Prause JU,Nielson NV. Age Related Macula Pathy :a risk indicator for poorer survival in women: The Copenhagen City Eye Study. Ophtalmology 112: 305-312 (2005).
31. Burns, M., Nixon, G., Foy, C., & Harris, N. Standardisation of data from real-time quantitative PCR methods–evaluation of outliers and comparison of calibration curves. BMC Biotechnology, 5(1): 31-43 (2005).
32. Buss, D. M. The evolution of happiness. American Psychologist, 55(1): 15-23 (2000). 33. Burmedi,D. Behavioural consequences of
age related low vision. 4: 15-45 (2002a). 34. Cedrone C, Nucci C, Scuderi G, Ricci F,
Cerulli A and Culasso F, prevalence of blindness and low vision in an Italian population: a comparison with other European studies. Eye 20: 661-667 (2006). 35. Centers for Disease Control and Prevention. Summary Health Statistics for U.S. Adults: National Health Inter view Sur vey, 2004.National Center for Health Statistics. Vital Health Statistics 10(228): (2006). 36. Cerroli L. Misseroli F. Aging of the cornea . In:
Cavalloti CA, Cerolli A. (Eds). Age-related changes of the human eye. Rome,Italy: Human Press.pp. 45-60 2008.
37. Coeckellbergh TR, Cornelissen FW,Brouwer WH, Kooijman AC. Age related changes in the functional visual field: Future evidence for an inverse age x eccentricity effect.The jurnals of Gerontology Series B: Psychological Siences and Social Sciences 59, P11-8 (2004).
38. Coleman, D. Population ageing: An unavoidable future. The Journal of the Biology Society, 66(7): 1- 11(2001). 39. Coleman AL,Cummings SR,Yu F, Ensrud
KE,Gutierez P,Stone KL, et al., Visual Field Loss And Risk Of Fractures In Older Women. J AM Geriatr SOC (2009).
40. Coleman AL,Cummings SR,Yu
F,Kodjebacheva G,Ensrud KE,Gutierez P, et
al., Binocular visual field loss increases the risk of future falls in older white women. J AM Geriatr SOC, 55(3), 357-364 (2007). 41. Congdon N, O’Colmain B, Klaver CC, Klein
R, Muñoz B, Friedman DS, Kempen J, Taylor HR, Mitchell P; Eye Diseases Prevalence Research Group. Causes and prevalence of visual impairment among adults in the United States. Arch Ophthalmol. 122(4):477-85 (2004).
42. Crews Je and Campbell VA Vision impairment and hearing loss among community-dwelling older American’s: implications for health and functioning. Am J Public Health 94: 823-829 (2004).
43. C, M. visual problems followingstroke and their effect on rehabilitation. Br Orthopt J, 60: 10–14 (2003).
44. Cummings,S.R.,Nevitt,M.C ,Browner, W.S.,Stone,K.,Fox,K.M .,Ensrud, K.E. ,Cauley, J .,Black ,D.,&Vogt,T .M. (Study of Osteoporotic Fractures Research Group). Risk factors for hip fracture in white women. New England Journal of Medicine, 332: 767-773 (1995).
45. Cugati S, W. J., Knudtson MD, et al. Retinal vein occlusion and vascular mortality: pooled data analysis of 2 population-based cohorts. Ophthalmology, 114(3): 520-524 (2007). 46. Czaja, R., & Blair, J. Designing surveys: a
guide to decisions and procedures (2nd Ed). Thousand Oaks, California: Pine Forge Press (2005).
47. Daley, M. J. & Spinks, W. L. Exercise mobility and aging. The Australian Journal of Sports Medicine, 29(1): 1-12 (2000).
48. Dandona R, D. L. (2001). Socioeconomic status and blindness. Br J Ophthalmol, 85: 1484-1488 (2001).
49. Datta, S., Foss, A. J., Grainge, M. J., et al. (2008). The importanceof acuity, stereopsis, and contrast sensitivity for health-related quality of life in elderly women with cataracts. Investigative Ophthalmology & Visual Science, 49(1)(1-6).
51. Dunlop DD, Manheim LM, Sohn MW, Liu X and Chang RW, Incidence of functional limitation in older adults: the impact of gender, race, and chronic conditions. Arch Phys Med Rehabil 83: 964-971 (2002).
52. Dunlop ,D.D., Semanik ,P.,Song, J., Manheim, L.M.,Shih,V.,&Chang,R.W.(2005). Risk factors fo r functiona l decline in older adults with arthritis. Arthritisand Rheumatism, 52: 1274-1282.
53. Evanglista O, McLaughlin MA .2009.Review of cardiovascular risk factors in women. Gender Medicine 6 SuppI 1, 17-36. 54. Edwards R, T. J., Ajit R, Harrison RA, Kelly
SP. Cigarette smoking and primary open angle glaucoma: a systematic review. J Glaucoma, 17(7), 558-566 (2008).
55. Feher J,Olah Z. Age related changes of the eye lid. . In: Cavalloti CA, Cerolli A. (Eds). Age-related changes of the human eye. Rome, Italy: Human Press.pp.9-34 (2008) 56. Freeman EE, Munoz B, Rubin G, & West SK,
Visual field loss increases the risk of falls in older adults: the Salisbury evaluation. Invest Ophtalmol Vis Sci, 48(10): 4445-4450 (2007).
57. Freeman EE, M. B., West SK,et al. (2008). Glaucoma and quality of life: the Salisbury Eye Evaluation. Ophthalmology, 115: 233-238 (2008).
58. Freeman EE, Egleston BL,West SK,Bandeen-Roche K, Rubin G. 2005 .Visual acuity change and mortality in older adults. Investigative Ophthalmology & Visual Science 46: 4040-4045 (2008).
59. Felson, D.A., Anderson, J.J., Hannan,M.T., Milton,R.C ,Wilson,P.W., & Koel,D.P. Impaired vision and hip fracture. The Framingham Study .Journal of The American Geriatric Society, 57(6): 495-500 (1989)
60. Fotiou DF,Brozou CG,Tsiptsios DJ, Fotiou A,Kabitsi A,Nakou M,Giantselidis C,Goula A. Effect of age on pupillary light reflex: Evaluation of pupil mobility for clinical practice and research. Electromyography and Clinical Neurophysiology 47: 11-22 (2007).
61. Frick,K.D.,Gower,E.W., Kempen ,J.H.,& Wolff ,J.L. Economic impact of visual impairment and blindness in the United States . Archives
of Ophthalmology, 125(4), 544-550 (2007). 62. Fillenbaum, G. The well-being of the elderly: Approaches to multidimensional assessment. WHO Offset Publication No. 84. Geneva: World Health Organization (1984). 63. Fr iedr ich, D. Personal and societal intervention strategies for successful ageing. Ageing International, 28(1): 3-36 (2003). 64. George B. Ploubidis, W. M., Bianca De
Stavola, Emily Grundy, Allen Foster, Hannah Kuper. Socioeconomic position and later life prevalence of hypertension, diabetes and visual impairment in Nakuru, Kenya. Int J Public Health (2012).
65. Geneau R, L. S., Bronsard A, Paul I, Courtright P. The social and family dynamics behind the uptake of cataract surgery: Findings from Kilimanjaro Region, Tanzania. Br J Ophthalmol. 89: 1399–1402 (2005). 66. Gohdes DM, B. A., Larsen BA, Maylahn C.
Age-related eye diseases: an emerging challenge for public health professionals. Prev Chronic Dis, 2 :A17 (2005).
67. GoldD, Z., HodgeWG. Perspectives on lowvision service in Canada: a pilot study. Can J Ophthalmol, 41: 348–354 (2006). 68. Gignac, M.A.M., Cott, C., & Badley, E. M.
Adaptation of chronic illness and disability and its relationship to perceptions of independence and dependence. The Journals of Gerontology, 55B(6): 362-372 (2000).
69. Gupta, D. Glaucoma diagnosis and management .Philadelphia : Lippincott Williams & Wilkins .(2005).
70. Gill, T. M., & Feinstein, A. R. A critical appraisal of the quality of quality-of –life measurements. The Journal of the American Medical Association, 272(8): 619 – 626 (1994).
a. Graf, C. (2007). The Lawton Instrumental Activities of Daily Living (IADL) Scale. Retrieved September 4, 2008, from http:// wwwGeroNurseOnline.org.
71. Hair, J., Black, W., Babin, B., Anderson, R., & Tathham, R. Multivariate data analysis. New Jersey: Pearson, Prentice-Hall (2006). 72. Haymes SA, Johnston AW, Heyes AD.
Ophtalmic & Phisiological Ophtics 22: 79-91 2002.
73. HE, B. Acuidade visual. Medidas e notações. Arq Bras Oftalmol., 65: 375-384 (2002). 74. Hayman KJ, Kerse NM, La Grow SJ,Wouldes
T,Robertson MC & Campbell AJ, Depression in older people:visual impairment and subjective ratings of health. Optom Vis Sci, 84(11): 1024-1030 (2007).
75. Häkkinen L, vision in the elderly and its use in the social environment. Scand J Soc Med Suppl 35: 5-60 (1984).
76. Herrieth Mganga, S. L., and Paul Courtright. Overcoming Gender Inequity in Journal of Advanced Nursing Prevention of Blindness and Visual Impairment in Africa. Middle East Afr J Ophthalmol. 2011 Apr-Jun, 18(2): 98– 101 (2011).
77. Hellström, Y., Andersson, M., & Hallberg, I. R. Quality of life among older people in Sweden receiving help from informal and / or formal helpers at home or in special accommodation. Health and Social Care in the Community, 12(6): 504 516 (2004). a. Hellström, Y., Persson, G., & Hallberg, I.R.
Quality of life and symptoms among older people living at home., 48(6): 584-594 (2004).
78. Hirvelä H and Laatikainen L, visual acuity in a population aged 70 years or older; prevalence and causes of visual impairment. Acta Ophthalmol Scand 73: 99-104 (1995). 79. Hirai FE, T. J., Klein BE, Klein R. Ten-year change in vision-related quality of life in type 1 diabetes: wisconsin epidemiologic study of diabetic retinopathy. Ophthalmology, 118: 353–358 (2011).
80. Hong, T., Mitchell, P., de Lor yn, T., Rochtchina, E., Cugati, S., &, & Wang, J. J. Development and progression of diabetic retinopathy 12 months after phacoemulsification cataract surgery (2009). 81. Hunt, S., McEwen, J., & McKenna, S. Measuring health status: a new tool for clinicians and epidemiologists. The Journal of the Royal College of General Practitioners, 35(273): 185-188 (1985). 82. Hunt, S. M. The problem of quality of life.
Quality of Life Research, 6: 205-212 (1997). 83. Ivan J. Sun˜er, 1, 3, Diego G.
Espinosa-Heidmann, 2, Maria E. Marin-Castano, 2, . . . 2. (2004). Nicotine Increases Size and Severity of ExperimentalChoroidal Neovascularization.
84. Jacobs JM, H.-R. R., Maaravi Y, Cohen A,, & J, S. the impact of visual impairment on health, func-tion and mortality. Aging Clin Exp Res 17: 281–286 (2005).
85. Jung S, Colernan A, Weintraub NT, Vision screening in the elderly. JAMA. 8(6): 355-362 (2007).
86. Jessa Z, E. B., Thomson D, Rowlands G. Vision screening of older people. Ophthalmic Physiol Opt, 27(6), 527-546 (2007). 87. Jakobsson, U., & Hallberg, I.R. Quality of life
among older adults with osteoarthritis. Journal of Gerontological Nursing, 32 (8), 51-60 (2006).
88. Javitt,JC,Zhou,Z, & Willke,RJ. association between vision loss and higher medical care costs in medicare benefeciaries costs are greater for those with prograssive vision loss. Ophtalmology, 114(2): 238-245 (2007). 89. Jette, A. M. Physical disablement concepts
for physical therapy research and practice. Physical Therapy, 74: 380-386 (1994). 90. Johansen A, W. S., Waraisch P. Screening
for visual impair-ment after stroke: validation of the Cardiff Acuity Test. Arch Gerontol Geriatr 36, 289–293 (2003).
91. J L Y Yip1, T. A., T-Y Wong3, D Machin4, P T Khaw5, K-T Khaw, S Seah2, P J Foster6. Socioeconomic status, systolic blood pressure and intraocular pressure: the Tanjong Pagar Study. Br J Ophthalmol, 91: 56-61 (2007).
a. Katz, S., Ford, A. B., Moskowitz, R. W., Jackson, B. A., & Jaffe, M. W. Studies of illness in the aged. The index of ADL: a standardized measure of biological and psychosocial function. Journal of American Medical Association, 185: 914-919 (1963).
92. Kalasa, B. Population and ageing in Africa. A policy dilemma. Country report, 84: 1 -14 (2004).
94. Klaver CC, Wolfs RC, Vingerling JR, Hofman A and de Jong PT: Age-specific prevalence and causes of blindness and visual impairment in an older population: the rotterdam study. arch ophthalmol 116: 653-658 (1998).
95. Lee KE.2003.Relationship of measures of frailty to visual function:The Beaver Dam Of Eye Study.Trancactions of the American Ophtalmological Society 101,191-6; discussion 196-9.
96. Klein R, K. B., Moss SE, Cruickshanks KJ. (1999). Association of ocular disease and mortality ina diabetic population. Arch Ophthalmology, 117, 1487–1495.
97. Klein r, Klein Be, linton Kland de mets dl(1991b): the Beaver dam eye study: visualacuity. ophthalmology 98: 1310-1315. 98. Klein BE, Moss SE, Klein R, Lee KE & Cruickshanks KJ, 2003b.Associations of visual function with physical outcomes and limitations 5 years later in an older population: The Beaver Dam Eye Study. Ophthalmology, 110(4), 644-650.
99. Kyari F, G. M., Sivsubramantam S, Gilbert CE, Abdull MM, Entekume G, et a. (2009). Nigeria National Blindness and Visual Impairment Study Group.Prevalence of blindness and visual impairment in Nigeria: The National Blindness and Visual Impairment Survey. Invest Ophthalmol Vis Sci. 2009, 50, 2033– 2039.
100. Landers J, H. T., Craig J. (2010). The prevalence and causes of visual impairment in indigenous Australians within central Australia: The central Australian ocular health study. Br J Ophthalmol 2010, 94, 1140-1144. 101. Lasheras, C., Patterson, A. M., Casado, C., & Fernandez, S. (2001). Effects of education on the quality of life, diet, and cardiovascular risks factors in an elderly Spanish community population. Experimental Aging Research, 27, 257-270.
102. Lam BL, Christ SL ,Lee DJ, Zheng DD,Arhear t KL.2008.Repor ted visual impairment and risk of suicide: The 1986-1996 National Health Interview Survey. Archives of ophthalmology 126,975-980. 103. Laitinen a, Koskinen s, Harkanen t,
Reunanen a, Laatikainen L and Aromaa A,
(2005). ANationwide population-based survey on visual acuity, near vision, and self-reported visual function in the adult population in Finland. Ophthalmology 112: 2227-2237.
104. Laitinen A, Sainio P, Koskinen S, Rudanko SL, Laatikainen L,Arroma A.2007. The association between visual acuity and functional limitations: findings from a nationally representative population survey. Ophthalmic Epidemiology 14, 333-342. 105. Lamb, V. L. (1996). A cross-national study of
quality of life factors associated with patterns of elderly disablement. Journal of Social Science Medicine,42 (3), 363-377.
106. Lamoureux, E. L., Hassell, J. B., & Keeffe, J. E. (2004). The determinants of participation in activities of daily living in people with impaired vision.American Journal of Ophthalmology, 137, 265-270.
107. Laitinen A, Lattikainen L. Harkanen T.Koskinen S.Reuanen A, Aromma A.2009.Prevalence of major eye disease and causes of visual impairment in the adult finnish population. A nationwide population based- survey. Acta ophtolmologica DOL 10/1111/J.1755-3768.2009.01566.X. 108. Lawton, M. P., & Brody, E. M. (1969).
Assessment of older people: Self-maintaining and instrumental activities of daily living. The Gerontologist, 9 (3), 179 – 186.
109. Leibowitz, H. M., Krueger, D. E., Maunder, L. R., Milton, R. C., Kini, M. M., Kahn, H. A., et al. (1980). The Framingham eye study monograph: An ophthalmological and epidemiological study of cataract, glaucoma, diabetic retinopathy, macular degeneration, and visual acuity in a general population of 2631 adults, 1973 – 1975.Survey of Ophthalmology, 24(suppl.), 335-610. 110. Lee DJ. Gomes- Marin O, Lam BL. Zheng
K., Ensrud, K.E., Fink, H.A., Sarkisian ,C.A., Coleman, A.L., & Mangoine, C.M. (2004). Vision impairment and Combine dvision and hearing impairment predict cognitive and functional decline in older women. Journal of the American Geriatric Society, 52: 1996-2002.
113. Li Y, C. J., Elam-Evans LD, Fan AZ, Zhang X, Elliott AF, Balluz L. Visual impairment and health-related quality of life among elderly adults with age-related eye diseases. Qual Life Res. 20(6): 845-852 (2011).
114. Lotery AJ, W. M., Jackson AJ et al. Correctable visual impairment in stroke rehabilitation patients. Age Aging, 29: 221–222 (2000). 115. Maxwell, C.J., & Hirdes, J.P. The prevalence
of smoking and implications for quality of life among the community-based elderly. American Journal of Preventive Medicine, 9 (6), 338-345 (1993).
116. McDonnall MC. The effects of developing a dual sensory loss on depression in older adults: A longitudinal study . Journal of Aging and Health 21: 1179-1199 (2009).
117. McDowell, I. Measuring health: a guide to rating scales and questionnaires: Oxford University Press, USA (2006).
118. McKean-CowdinR, V. R., Wu J, et al. (2007). Severity of visual field loss and health-related quality of life. Am J Ophthalmol, 143: 1013-1023 (2007).
119. Mer tler, C. A. V., R. A. Advanced and multivariate statistical methods (3rd Ed.): Glendale, CA. Pyrczak Publishing (2005). 120. Mitchell P, W. J., Wong TY, Smith W, Klein R,
Leeder SR. Retinal microvascular signs and risk of stroke and stroke mor-tality. Neurology 65: 1005–1009 (2005).
121. Mukesh BN, L. A., Dimitrov PN, Ahmed S, Taylor HR, , & CA, M. Development of cataract and associated risk factors — the Visual Impairment Project. Arch Ophthalmol, 124(1): 79-85 (2006).
122. Murthy GV, G. S., Bachani D, Jose R, John N. Current estimates of blindness in India. Br J Ophthalmol, 89: 257-260 (2005) (2005). 123. Muñoz B, West K, Rubin S et al. Causes of
blindness and visual impairment in a population of older Americans. The Salisbury Eye Evaluation Study. Arch Ophthalmol; 118:
819 – 825 (2000).
a. Nagi, S.Z. An epidemiology of disability among adults in the United States. Milbank Memorial Fund Quarterly, 54: 439-467 (1976).
124. Nagi, S. Z. (1991). Disability concepts revisited: Implications for prevention. In A. M. Pope & A. R. Tarlov (Eds.), Disability in America: Towards a National Agenda for prevention (pp. 309-327). Washington, DC: National Academy Press.
125. National Center for Health Statistics, 1988. Current estimates form the National Health Interview Survey: United States, 1987. Washington, DC: U.S. Department of Health and Human Services.
126. Nesbitt, B. J., & Heidrich, S. M. Sense of coherence and illness appraisal in older women’s quality of life. Research in Nursing & Health, 23. 25-34 (2000).
127. Nevitt,M.C ,Cummings,S.R ,Kidd, S., & Black, D. Risk factors for recurrent non syncope lfalls.A prospective study. Journal of the American Medical Association, 261(IS): 2663-2668 (1989).
128. Newell FW.1969.Ophtalmology. Principles and concepts . London: Mozby Company. 129. Nirmalan, P. K., Tielsch, J. M., Katz, J., et al.
Relation-ship between vision impairment and eye disease to vision-specific quality of life and function in rural India: The Aravind Com-prehensive Eye Survey. Investigative Ophthalmology & Visual Science, 46(7): 2308–2312 (2005).
130. Obata H.2008.Aging of the lachrymal gland. In: Cavalloti CA, Cerolli A. (Eds). Age-related changes of the human eye. Rome,Italy: Human Press.pp.305-318.
131. Orfila, F., Ferrer, M., Lamarca, R., Tebe, C., Domingo-Salvany, A., & Alonso, J. Gender differences in health-related quality of life among the elderly: The role of objective functional capacity and chronic conditions. Social Science & Medicine, 63: 2367-2380 (2006).
132. Osterweil D, Martin M, Syndulko K. Predictors of skilled nursing home placement in a multilevel long-term-care facility. J Am Geriatr Soc; 43:108 – 111 (1986).
133. Ong, F. S. Aging in Malaysia: Areview of national policies and programmes. In D. R. Philips & C. M. Chan (Eds), Ageing and long -term care:National policies in the Asia Pacific (pp. 107-149) (2002).
134. Ophthalmology, A. A. O. Comprehensive adult medical eye evaluation—October 2010.
135. Paul J. Foster1, D. C. B., David F. Garway-Heath1, Jennifer L. Y. Yip3, Robert Luben3, Shabina Hayat3, Nichola Dalzell3, Nicholas J. Wareham4 and Kay-Tee Khaw3. Intraocular Pressure and Corneal Biomechanics in an Adult British Population: The EPIC-Norfolk Eye Study. UCL Institute of Ophthalmology, (2011).
136. Pedula KL,Coleman AL, Hillier TA, Ensrud KE, Nevitt MC, Hochberg MC et al., visual acuity, contrast sensitivity and mortality in older women: study of osteoporotic fractures.J AM Geriatr Soc, 54(12): 1871-1877 (2006).
137. Peat, J., & Barton, B. Medical statistics: A guide to data analysis and critical appraisal. New York: Wiley.revention, C. f. D. C. a. (2010). Vision health initiative (2005). Available at: http://www.cdc.gov/visionhealth/ .
138. Pedhazur, E.J. Multiple regression in behavioral research, third edition. New York: Harcourt Brace College Publishers. ISBN 0-03-072831-2 (1997).
139. Pope, A. M. & Tarlov, A. R. (Eds.). Disability in America: Towards a national agenda for prevention. Division of Health Promotion and Disease Prevention, Institute of Medicine. Washington, D.C.: National Academy Press (1991).
140. Ponte F, Giuffre G and Giammanco R, prevalence and causes of blindness and low vision in the casteldaccia eye study. Graefes Arch Clin Exp Ophthalmol 232: 469-472 (1994).
141. Pluijm, S.M.F., Bardage, C., Nikula, S., Blumstein, T., Jylhä, M., Minicuci, N., et al. A harmonized measure of activities of daily living was a reliable and valid instrument for
comparing disability in older people across countries. Journal of Clinical Epidemiology, 58: 1015-1023 (2005).
142. P l e i s , J . R . , & L e t h b r i d g e - C e j k u , M . Summaryofhealthstatisticsfo rU.S. adults :National Health Interview Sur vey,2006.NationalCenterfo r Health Statistics. Vital Health Statistics, 10(235): 1-163 (2007).
143. Ramrattan RS, W. R., Panda-Jonas S, Jonas JB, Bakker D, Pols HA, et , & allen CM, M. M., Wade DT. Prevalence and causes of visual field loss in the elderly and associations with impairment in daily functioning: the Rotterdam study. Arch Ophthalmol, 119(12): 1788-1794 (2001).
144. Rani PK, R. R., Chandrakantan A, Pal SS, Perumal GM, Sharma T. Risk factors for diabetic retinopathy in self-reported rural population with diabetes. Journal of Postgraduate Medicine, 55: 92-96 (2009). 145. Ramrattan RS, Wolfs RC, Panda-Jonas S,
Jonas JB, Bakker D, Pols HA, et al. Prevalence and causes of visual field loss in the elderly and associations with impairment in daily functioning: the Rotterdam study. Arch Ophthalmol.; 119(12):1788-94 (2001)
146. Rejeski, W. J., & Mihalko, S. L. Physical activity and quality of life in older adults. Journals of Gerontology: Medical Sciences, 56A(11): 23-35 (2001).
147. Resnikoff S, Pascolini D, Etya’ale D, Kocur I, Pararajasegaram R, Pokharel GP and Mariotti SP. Global data on visual impairment in the year 2002. Bulletin of the World Health Organization. 82 (11): 844-851 (2004). 148. Reuben DB, Mui S, Damesyn M, Moore AA
and Greendale GA, (1999): the prognostic value of sensory impairment in older persons. J Am Geriatr Soc 47: 930-935. 149. Rovner Bw and Ganguli M: Depression and
disability associated with impaired vision: the movies project. J Am Geriatr Soc 46: 617-619 (1998).
Survey. American Journal of Public Health, 98: 454-461 (2008).
151. Saari KM.2001.Silmatautioppi.Helsinki:K and idaattikustannus Oy.Sannapaneni Kr ishnaiah, K. V., Bindiganavale R. Shamanna, Gullapalli N. Rao,, & Ravi Thomas, a. D. B. Smoking and Its Association with Cataract: Results of the Andhra Pradesh Eye Disease Study from India (2004). 152. Sannapaneni Kr ishnaiah, K. V.,
Bindiganavale R. Shamanna, Gullapalli N. Rao,, & Ravi Thomas, a. D. B. Smoking and Its Association with Cataract: Results ofthe Andhra Pradesh Eye Disease Study from India. Invest Ophthalmol VisSci. 46, 58–65 (2005).
a. Saxena, S., Carlson, D., Billington, R., & Orley, J. The WHO quality of life assessment instrument (WHOQOL-Bref): The importance of its items for cross-cultural research. Quality of Life Research, 10: 711-721 (2001). 153. Scott, D., & Garrood, T. Quality of life
measures: use and abuse. Best Practice & Research Clinical Rheumatology, 14(4): 663-687 (2000).
154. Seet B, Wang TY, Tan DTH et al., Taking a public health approach.Br J Ophtalmol, 85: 521-6 (2001).
155. Sloan FA, Picone G, Brown Dsand, Lee PP, longitudinal analysis of the relationship between regular eye examinations and changes in visual and functional status. J Am Geriatr Soc 53: 1867-1874 (2005b). 156. Sloan FA, ostermann J, Brown Dsand, lee
PP, Effects of changes in self-reported vision on cognitive, affective, and functional status and living arrangements among the elderly. Am J Ophthalmol, 140: 618-627 (2005a). a. Stevens, J. Applied multivariate statistics for
the social sciences(3rd edn).Mahway, NJ: Lawrence Erlbaum (1996).
157. Swanson MW and Mcgwin G, Visual Impairment And Functional Status From The 1995 National Health Interview Survey On Disability. Ophthalmic Epidemiol 11: 227-239 (2004).
158. Sjöstrand, J., Laatikainen, L., Hirvela, H., Popovic, Z., & Jonsson, R. The decline in visual acuity in elderly people with healthy eyes or eyes with early age-related
maculopathy in two Scandinavian population samples. Acta Ophthalmol, 89(2): 116-123 (2011). doi:10.1111/j.1755-3768.2009.01653.xAOS1653 [pii]
159. Simon JE, M. S., Pexman JHW, Buchan AM. (2003). CT assess-ment of conjugate eye deviation in acute stroke. Neurology, 60, 135–137.
160. Sit AJ, C. M., Trope GE. (2004). Blindness registrations and socioeconomic factors in Canada: an ecologic study. Ophthal-mic Epidemiol, 11, 199–211 (2004).
161. Tabachnick, B. G. F., L. S. (2001). Using Multivariate Statistics (4th Ed.). Boston: MA. Allyn & Bacon.
162. Tan JS, W. J., Younan C, Cumming RG, Rochtchina , & E, M. P. Smoking and the long-term incidence of cataract: the Blue Mountains Eye Study. Ophthalmic Epidemiol, 15(3): 155-161 (2008) (2008).
163. Taylor HR, Livingston PM, Stanislavsky YL, McCarty CA. Visual impairment in Australia : Distance visual acuity, near vision, and visual field findings of the Melbourne Visual Impairment Project. American Jurnal Of Ophthalmology 123: 328-337 (1997). 164. Tengku-Aizan, H. Aging issues in Malaysia.
The Study of Social Relations, 2(2), 47-66 (1996).
165. Ting AY, Lee TK, MacDonald IM. Genetics of age related macular degeneration. Current Opinion in Ophthalmology 20: 369-376 (2009).
166. The Eye Diseases Prevalence Research Group. Causes and prevalence of visual impairment among adults in the United States. Archives of Ophthalmology, 122: 477-485 (2004a).
167. The Eye Diseases Prevalence Research Group. Theprevalence of refractive errors among adults in the United States, western Europe, and Australia. Archives of Ophthalmology, 122: 495-505 (2004b). 168. Thiagarajan M, Evans JR, Smeeth
L,Wormald RP, Fletcher AE. Cause specific visual impairment and mortality :Results from a population based study of older people in United Kingdom. Archives Of Ophthalmology 123: 1397-1403 (2005).
Harrison, R., Buchan, & Kelly, S. (2005). Smoking and age-related macular degeneration: a review of association. 170. Tsaloumas MD, K. J., Vinhall H et al. Nine
year follow-up study of morbidity and mortality in retinal vein occlusion. Eye, 14: 821–827 (2000).
171. Tielsch, J. M., Sommer, A., Witt, K., Katz, J., & Royall, R. M. Blindness and visual impairment in an American urban population. The Baltimore eye sur vey. Archives of Ophthalmology, 108: 286-290 (1990).
172. Tournier M, Moride Y, Ducruet T, Moshyk A, & Rochon S, 2008.Depression and mortality in the visually impaired ,community dwelling ,elderly population of Quebec. Acta Ophtalmol, 86(2): 196-201.
173. Tseng, S., & Wang, R. Quality of life and related factors among elderly nursing home residents in Southern Taiwan. Public Health Nursing, 18(5), 304-311 (2001).
174. Tumosa,N. Eye disease and the older diabetic.Clinicsin Geriatric Medicine, 24(3): 515-527 (2008).
175. Van den Born B, H. C., Hoekstra JBL, Schlingemann, & RO, v. M. G. (2005). Value of routine funduscopy in patients with hypertension: systematic review. BMJ, 331: 73–76.
176. Varma R, C. J., Foong AW, Torres M, Choudhury F, Azen SP. Four-year incidence and progression of visual impairment in Latinos: The Los Angeles Latino Eye Study. Am J Ophthalmol, 149: 713-727 (2010). 177. Verbr ugge, L.M., & Jette, A. M. The
disablement process. Social Science & Medicine, 38(1): 1-14 (1994).
178. Veenhoven, R. Developments in satisfaction-research. Social Indicators Research, 37(1): 1-46 (1996).
179. Wang JJ,Smith W,Cumming RG,Mitchell P. Variables deter mining perceived global health ranks:Findings from a population based study. Annual of the Academy of Medicine 35: 190-197 (2006).
180. Wang, J. J. , Mitchell, P., Simpson, J.M., dimming, R.G., & Smith, W. Visualimpairment, age -relatedcataract, and mortality. Archives of Ophthalmology, 119:
1186-1190 (2001).
181. Wang JJ, Mitchell P, Cumming RG & Smith w, Visual impairment and nursing home placement in older Australians: The Blue Mountain Study. Ophtalmic Epidemiol, 10(1), 3-13 (2003).
182. Ware, J., & Sherbourne, C. The MOS 36-item short-form health survey (SF-36): I. Conceptual framework and item selection. Medical Care, 30(6), 473-483 (1992). 183. Watten, R. G., Syversen, J. L., & Myhrer, T.
Quality of life, intelligence and mood. Social Indicators Research, 36(3): 287-299 (1995). 184. West SK, R. G., Broman AT, Muñoz B, Bandeen-Roche K, Turano K. How does visual impairment affect performance on tasks of everyday life? The SEE project. Slisbury eye evaluation. Arch Ophthalmol, 120(6): 774-780 (2002).
185. World Health Organization Quality of Life Group (1996). What Quality of Life? Geneva: World Health Organization.
186. World Health Organization. (2004). Magnitude and causes of visual impairment (Fact Sheet 282).Geneva, Switzerland: WHO. 187. WHO. (2004). Vision 2020: developing an action plan to prevent blindness and national, provincial and district levels. Geneva: WHO;.
188. World Health Organization, 2004. Global burden of disease, 2004 update. Part 3: Disease incidence, prevalence and disability, 2008, P 5-6.
189. WHO. (2004a). developing an action plan to prevent blindness and national, provincial and district levels. . Geneva: WHO.
190. WHO. (2004b). Vision 2020: developing an action plan to prevent blindness and national, provincial and district levels. Geneva: WHO.
191. World Health Organization. the world is aging fast have we noticed? Accessed on September 17, 2010 at: http//www.who.int/ features/qa/42/en/index.htm1.
192. World Health Organization, International statistical classification of disease and related health problems, 10th
revision,2007.Chapter V11.H54.Blindness and low vision 2007.
impairment and blindness.
a. World Health Organization. International classification of functioning and disability (ICF) introduction. Retrieved September 29, 2004, from http://www.who.int/classification/ icf/intros/ICF_Eng_Intro.pdf
194. Wong TY, K. R., Klein BE, Tielsch JM, Hubbard L, Nieto FJ. Retinal microvascular abnormalities and their relationship with hypertension, cardiovascular disease, and mortality. Surv Ophthalmol, 46; 59–80 (2001). 195. Whoqol Group. The World Health Organization Quality of Life assessment (WHOQOL): Development and general psychometric properties. Social Science and Medicine, 46: 1569-1585 (1998).
196. Xinzhi Zhang, M., PhD; Jennifer Kahende, PhD; Amy Z. Fan, MD, PhD; Lawrence Barker,
PhD; , & Theodore J. Thompson, M. A. H. M., PhD; Yan Li, MD, MPH; Jinan B. Saaddine, MD, MPH. Smoking and Visual Impairment among Older Adults with Age-Related Eye Diseases (2011).
197. Xu L, W. Y., Wang J, Jonas JJ. . Mortality and ocular diseases: the Beijing Eye Study. Ophthalmology, 116(4); 732-738 (2009). 198. Zhang,X.,Andersen,R.,Saaddine,J .B.
B e ck l e s, G . L . A . , D u e n a s , R . , & L e e , P. P. Measuring accessto eye care: A p u b l i c h e a l t h p e r s p e c t i v e . O p h t h a l m i c Epidemiology, 15: 418-425 (2008).