Original Research Article
Seasonal variation of allergy profile of patients visiting a tertiary
care hospital in hilly areas of Himachal Pradesh
Manpreet S. Nanda
1*, Rama Devi
2INTRODUCTION
Allergic diseases are the major cause of morbidity in India and their prevalence is increasing due to lifestyle and environmental changes.1 Allergen is a substance which causes allergic reaction.2 Allergy is defined as a immediate type I hypersensitivity reaction to the allergen.3 Role of allergens vary according to climatic conditions.4 So the knowledge about the seasonal variation of these allergies is very important for diagnosis and management. There is very limited data on the seasonal variation of these allergens in Himachal Pradesh
Skin prick test (SPT) is a diagnostic procedure where wheal and flare is developed over a period of 15–20
minutes after introduction of allergen to which the patient is sensitized.5 It is a gold standard for diagnosis of allergic diseases and is highly sensitive, specific, simple and inexpensive.1,6 So this study was planned to find out the seasonal variation of various allergies in our region by way of history taking, examination and SPT.
METHODS
This prospective study was conducted in Allergy Clinic, Department of ENT of our Medical College and Hospital from November 2017 to October 2018. The approval of Institutional Ethical Committee was taken. A total of 686 patients with allergic complaints visited the clinic in that period. These patients were analysed for–
ABSTRACT
Background: Allergic diseases are very common and are caused by allergen whose role varies according to climate changes. Not many studies are available regarding the same in our region. Skin prick test is a diagnostic procedure for allergy testing. The aim of the present study was to find out the seasonal variation of different allergies in our region.
Methods: A total of 686 patients with allergic complaints were assessed for age and sex distribution, seasonal variation of number of allergy patients and seasonal variation of patient symptoms. 608 patients who gave consent and were found fit for skin prick tests underwent the tests and were analysed for allergy profile of the patients in different seasons.
Results: The majority of patients were females and of younger age group. The majority of the patients had nasal symptoms and these symptoms were more in summer and rainy season during which pine mix and grass pollen were common allergens. Pulmonary symptoms were maximum in winters with dust mite and moulds being the common allergens. Dust mite was overall the most common allergen involved. Sensitization to allergens was less in winter months.
Conclusions: This study focussed on seasonal variation of allergies and found pine mix and grass pollens to be major cause of nasal allergy and dust mite and mould mix to mainly cause pulmonary symptoms.
Keywords: Allergens, Seasonal variation, Sensitization, Skin prick tests
1
Department ofOtolaryngology Head and Neck Surgery, 2Allergy Clinic, Maharishi Markandeshwar Medical College and Hospital, Kumarhatti, Solan, Himachal Pradesh, India
Received: 13 November 2018
Accepted: 30 November 2018
*Correspondence:
Dr. Manpreet S. Nanda,
E-mail: [email protected]
Copyright: © the author(s), publisher and licensee Medip Academy. This is an open-access article distributed under the terms of the Creative Commons Attribution Non-Commercial License, which permits unrestricted non-commercial use, distribution, and reproduction in any medium, provided the original work is properly cited.
Seasonal variation of number of patients with allergic complaints attending the clinic
Age and sex profile of the patients
Patient symptoms. Seasonal variation of the patient symptoms was also noted.
The patients who gave consent for Skin prick tests (SPT) underwent the tests for common allergens like dust mite mix, cockroach, mould mix, grass pollen mix, cat pelt, peanut and local allergen pine mix as this region has mainly pine trees. Histamine was used as positive control and saline as negative control. A wheal 3 mm or more greater than the negative control was taken as positive for allergen.5 All the allergens used were standardized allergens imported from Hollister Steir Company USA through Pranav Pharma Bengaluru.
The exclusion criteria for SPT were recent intake of anti-allergic drugs like antihistaminics, antipsychotic drugs, recent history of anaphylaxis, exacerbation or anaphylaxis and patients with severe dermatographism.7 After exclusion and consent 608 patients underwent SPT.
The SPT findings were analysed for
Percentage of patients sensitized. Seasonal variation of percentage of patients sensitized was also noted.
Number of patients sensitized to each allergen and their seasonal variation.
Seasons were defined as November and December (cold winters), January and February (very cold winters), March and April (Spring), May and June (Summers), July and August (Rainy season) and September and October (Autumn).
The results were noted and analysed.
RESULTS
Out of the total 686 patients, the majority of patients were in the younger age group of 21–40 years (62%). The youngest patient was 8 years old and the eldest was of 70 years age. There was female predominance among the allergic patients in all age groups (overall 60%) (Table 1).
Table 1: Age and sex distribution.
Age group Male Female Total
< 20 years 20 22 42
21–40 years 163 268 431
41–60 years 73 103 176
> 60 years 18 19 37
Total 274 412 686
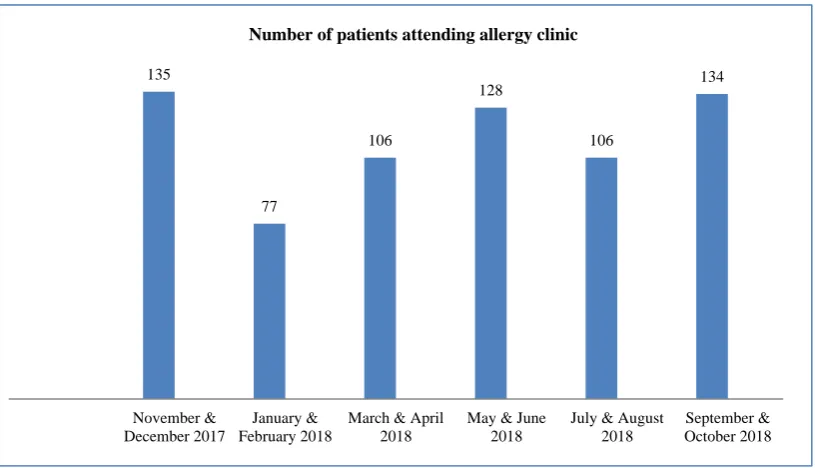
Regarding number of patients visiting the allergy clinic, it was almost equally distributed among various seasons with a little dip in January and February due to cold harsh weather and snowfall in many surrounding areas during that period (Figure 1).
Regarding patient symptoms, the majority of patients had nasal symptoms (70%) followed by pulmonary (35%) and skin symptoms (31%). The nasal symptoms were maximum in summer and rainy season whereas pulmonary symptoms were maximum during harsh winters (Table 2).
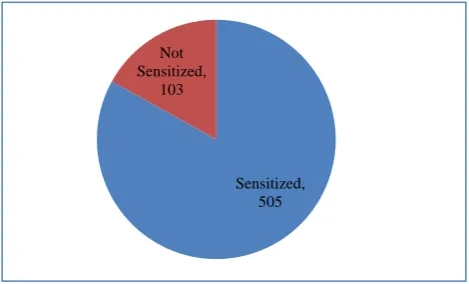
Regarding sensitization of patients to any of the tested allergens, out of 608 patients who underwent SPT, 17% were not sensitized (Figure 2).
Figure 1: Seasonal variation of number of patients attending the allergy clinic. 135
77
106
128
106
134
November & December 2017
January & February 2018
March & April 2018
May & June 2018
July & August 2018
September & October 2018
Table 2: Patient symptoms and their seasonal variation.
Symptoms
Nov–Dec 2017 n=135
Jan–Feb 2018 n=77
Mar–Apr 2018 n=106
May–Jun 2018 n=128
Jul–Aug 2018 n=106
Sept–Oct 2018 n=134
Total n=686
N (%) N (%) N (%) N (%) N (%) N (%) N (%)
Nasal 87 (64) 50 (65) 74 (71) 94 (73) 78 (75) 93 (69) 476 (70)
Pulmonary 49 (36) 31 (40) 35 (32) 38 (30) 35 (33) 48 (36) 236 (35)
Skin 44 (33) 25 (32) 32 (30) 38 (30) 31 (30) 40 (30) 210 (31)
Eyes 30 (22) 17 (22) 23 (21) 31 (24) 24 (22) 28 (21) 153 (22)
Ear 12 (09) 07 (09) 09 (09) 10 (08) 11 (10) 13 (10) 62 (09)
Gastro intestinal 06 (04) 03 (04) 04 (04) 06 (05) 05 (05) 05 (04) 29 (04)
N=Number of patients
Table 3: Allergen wise sensitization.
Allergen
Nov–Dec 2017 n=94
Jan–Feb 2018 n=54
Mar–Apr 2018 n=86
May–Jun 2018 n=93
Jul–Aug 2018 n=80
Sept–Oct 2018 n=98
Total n=505
N (%) N (%) N (%) N (%) N (%) N (%) N (%)
Dust mite mix 85 (90) 48 (89) 50 (58) 45 (48) 65 (81) 67 (68) 360 (71)
Cockroach 71 (74) 43 (80) 52 (60) 58 (62) 56 (70) 53 (54) 333 (66)
Pine mix 07 (08) 06 (11) 71 (82) 80 (86) 24(30) 16 (17) 204 (40)
Grass pollen mix 10 (10) 09 (16) 18 (21) 23 (26) 25 (31) 26 (27) 111 (22)
Mould mix 31 (33) 18 (33) 15 (18) 06 (06) 18 (23) 17(18) 105 (21)
Peanut 09 (09) 07 (13) 11 (13) 11 (12) 07(09) 09 (09) 54 (11)
Wheat 01 (01) 01 (02) 00 (00) 00 (00) 00 (00) 01 (01) 03 (01)
Cat pelt 01 (01) 00 (00) 00(00) 00 (00) 01 (01) 01 (01) 03 (01)
N=Number of patients sensitized
Figure 2: Number of patients sensitized.
Regarding seasonal variation the maximum number of patients not sensitized was in winter months (24%) whereas the maximum number sensitized was in summer months (Figure 3).
Regarding specific allergen sensitization, the most common allergen found positive in SPT was Dust Mite mix (71%) followed by cockroach (66%) and Pine mix (40%). The dust mite sensitization was maximum during winter months and minimum during summer months. Whereas pine mix sensitization was maximum during months of March to June. Grass pollen sensitization was maximum during rainy season and mould was maximum
during winters. Peanut and cockroach sensitization was present throughout the year (Table 3).
Figure 3: Season wise sensitization of patients.
DISCUSSION
In this study we studied the allergy incidence and SPT findings in different seasons of the year. Most of the patients who visited our Allergy Clinic were in the younger age group (Table 1). Similar results were obtained in other studies with mean age of 29.3 years.8 In our study majority of patients with allergy complaints were females (60%). Rasool et al in their study also showed female predominance.9 In our study we found Sensitized,
505 Not
Sensitized, 103
Nov & Dec 2017
Jan & Feb 2018
March & April
2018
May & June 2018
July & August 2018
Sept & Oct 2018
94 54 86 93 80 98
29 16 11 12 12 23
Seasonal sensitization
almost equal number of patients visiting the clinic for allergy complaints (Figure 1). There was a little dip in months of January and February due to harsh cold weather conditions and snowfall in this region.
Regarding the patient complaints, the majority of symptoms were nasal followed by pulmonary and dermatological symptoms (Table 2). Nasal allergies accounted for 70% of total allergies in our study. Wigar also reported nasal allergies to be predominant and 55% of all allergies.10 The pollens disperse in air with tree pollens from March to June and grass from May to October.11 The skin test reactivity to pollen is maximum during or immediately after the pollen season.12 In our study we found the sensitization to allergens was most common in summer months as compared to winters (Figure 2). In winters many of the patients were of non allergic rhinitis with the most common trigger being the cold climate.
Dust mite was the most common allergen in our study followed by cockroach and pine mix (Table 3). A study by Oladeji et al also found dust mite to be the most common allergen followed by tree pollen.13 In a study by Giridhar et al, the most common offending allergen was cockroach.14 Regarding the seasonal variation of allergens, dust mite allergy was maximum in winter and rainy season and least in summer months. Whereas pine mix allergy was more prevalent in months of March to June, that is during and after pollination season. Grass pollen allergy is maximum during rainy season and mould mix during winters. There was no seasonal variation of cockroach and peanut allergies (Table 3).
Regarding the seasonal variation of symptoms, pulmonary symptoms were more in winter months when dust mite and mould allergies were more common during that period and nasal symptoms were maximum in summers when pollen and pine allergies were maximum (Table 2). This shows a correlation between pulmonary symptoms and dust mite and mould allergies and between nasal symptoms and pollen and pine allergies. Other studies have also reported dust mite to be a common allergen for asthma and pollens to be the main cause for rhinitis.15,16 Another study had also shown mould allergy to be more common in winters.17 In another study the rate of sensitization to dust mite was lower in summers.18 These studies go along with findings we obtained. Another study has shown dust mite allergies to be maximum during fall (autumn).19
So we can conclude that Nasal allergies are most common allergies seen in this region. The most common offending allergen is dust mite in our area. These allergies are more common in females and younger age group. For nasal allergies the most common offending allergens are pine mix and grass pollen and they are most common in summers and rainy season. For pulmonary symptoms the most common offending allergens are dust mite and moulds and more common in winters. Allergies
to cockroach and peanut are seen throughout the year. There is higher incidence of non-allergic rhinitis in winters due to sensitization to cold climate.
ACKNOWLEDGEMENTS
We would like to thank our Medical College and Hospital for its support and the patients for participating in this study.
Funding: No funding sources Conflict of interest: None declared
Ethical approval: The study was approved by the Institutional Ethics Committee
REFERENCES
1. Brozek JL, Bousquet J, Baena‑Cagnani CE, Bonini S, Canonica GW, Casale TB, et al. Allergic rhinitis and its impact on asthma (ARIA) guidelines:2010 revision. J Allergy Clin Immunol. 2010;126:466‑ 76.
2. Gell PG, Coombs RR, editors. Clinical Aspects of Immunology. Oxford, England: Blackwell; 1963. 3. Bousquet J, Khaltaev N, Cruz AA, Denburg J,
Fokkens WJ, Togias A, et al. Allergic rhinitis and its impact on asthma (ARIA) 2008 update (in collaboration with the world health organization, GA(2) LEN and AllerGen). Allergy. 2008;63(86):8-160.
4. D’Amato G, Liccardi G, D’Amato M, Cazzola M. Outdoor air pollution, climatic changes and allergic bronchial asthma. Eur Respir J. 2002;20 (3):763-76. 5. Nelson H. Diagnostic procedures in allergy:allergy
skin testing. Annals of allergy. 1983;51(4):411-8. 6. Ten RM, Klein JS, Frigas E. Allergy skin testing.
Mayo Clin Proc. 1995;70:783-4.
7. Nanda MS, Singh K, Devi R. Allergy profile of patients visiting a tertiary care hospital in hilly areas of Solan, Himachal Pradesh, India. J Clin Diagnos Res. 2018;12(2):1-3.
8. Desalu OO, Salami AK, Iseh KR, Oluboyo PO. Prevalence of self reported allergic rhinitis and its relationship with asthma among adult Nigerians. J Investig Allergol Clin Immunol. 2009;19(6):474-80. 9. Rasool R, Shera IA, Nissar S, Shah ZA, Nayak N, Siddiqi MA, et al. Role of skin prick test in allergic disorders:a prospective study in Kashmiri population in light of review. Indian J Dermatol. 2013;58(1):12-7.
10. Wiqar SA. Allergic rhinitis in allergy and asthma-a clinical primer. IJCP. 1999:65.
11. Oh JW, Lee HB, Kang IJ, Kim SW, Park KS, Kook MH, et al. The revised edition of Korean calendar for allergenic pollens. Allergy Asthma Immunol Res. 2012;4:5-11.
13. Oladeji S, Nwawolo C, Adewole O. Allergic rhinitis among adult bronchial asthmatic patients in Lagos, Nigeria. J West Afr Coll Surg. 2013;3(2):01-14. 14. Giridhar BH, Kumar S, Verma AK, Singh A, Kumar
D, Prasad R et al. A study on profile of allergens sensitivity and associated factors in naso-bronchial allergic patients. Natl J Med Res. 2012;2(1):70-6. 15. Han ER, Choi IS, Lee S, Cho YW. Airway
hyperresponsiveness-related aeroallergens in suspected asthma. Korean J Asthma Allergy Clin Immunol. 2007;27:105-10.
16. Gergen PJ, Turkeltaub PC. The association of individual allergen reactivity with respiratory disease in a national sample:data from the second National Health and Nutrition Examination Survey, 1976-80 (NHANES II). J Allergy Clin Immunol. 1992;90:579-88.
17. Sharma R, Gaur SN, Singh VP, Singh AB. Association between indoor fungi in Delhi homes
and sensitization in children with respiratory allergy. Med Mycol. 2012;50:281-90.
18. Choi IS, Ki WJ, Kim TO, Han ER, Seo IK. Seasonal factors influencing exercise-induced asthma. Allergy Asthma Immunol Res. 2012;4:192-8. 19. Kim E, Kim MJ, Lee JS, Yoon JS. Association
between autumnal exacerbation and
Dermatophagoides pteronyssinus specific IgE in childhood asthma. Pediatr Allergy Respir Dis. 2007;17:242-8.