Maximum Utility Function Approach for Detection of
Primary User Emulation Attack in Cognitive Radio
Networks
Abbas Ali Sharifi
Department of Electrical Engineering, University of Bonab, Bonab, Iran
Mohammad Mofarreh-Bonab
Department of Electrical Engineering, University of Bonab, Bonab, Iran
ABSTRACT
Inherent nature of Cognitive Radio (CR) networks has imposed some serious threats to wireless communications. One of the common threats is Primary User Emulation Attack (PUEA). In PUEA, some malicious users try to imitate primary signal characteristics and defraud CR users to prevent them from accessing the spectrum holes. As a countermeasure against PUEA, we propose Maximum Utility Detection (MUD) approach. A 3-level hypotheses test is considered and maximum utility criterion is applied to choose the hold hypothesis. Simulation results are provided to indicate the superiority of the proposed MUD method against PUEA compared with conventional method.
General Terms
Security, Spectrum Sensing, Cognitive Radio
Keywords
Cognitive Radio, Spectrum Sensing, Primary User Emulation Attack, Maximum Utility Detection.
1.
INTRODUCTION
Cognitive Radio (CR) has been widely adopted as a promising technology to overcome the spectrum scarcity by authorizing CR users to operate opportunistically in the free space of the licensed frequency bands in co-existence of the Primary Users (PUs) [1]. Spectrum sensing, with the aim of finding the idle frequency bands (spectrum holes), is the main function of CR networks [2, 3]. Collaborative Spectrum Sensing (CSS) is known as an effective approach to improve the detection performance [3]. Unfortunately, spectrum sensing process is vulnerable to Primary User Emulation Attack (PUEA) [4]. In PUEA, some malicious users send signal similar to that of PU transmitter and causes the CR users to immediately relinquish the desired frequency band [4]. To mitigate the problem of PUEA, many approaches have been proposed.
In [5], an analytical model of the PUEA is proposed and a lower bound on the probability of a successful attack is achieved. In [6], a Received Signal Strength (RSS)-based localization defense strategy under the PUEA is proposed to determine the location of PUEA by deploying sensor network. Collaborative sensing in the presence of PUEA is investigated in [7], where the Fusion Center (FC) assigns an appropriate weight to each CR user’s sensing measurement and then combines them to maximize detection probability in Neyman-Pearson (N-P) test. In [8], the authors introduce a smart PUEA which is aware of the PU activity and performs spectrum sensing and sends the fake signals with the desired signal occurrence over special frequency band. The authors also investigated the smart PUEA in [9] which applies the target
destructive strategy according to its obtained analysis of the radio environment. In [10], the authors present a comprehensive introduction to PUEA, from the attack motivation and its impact on CR networks, to detection and defense approaches. They propose a two-level database-assisted detection approach to detect of PUEA. Energy detection and location verification are combined for fast and reliable detection. In [11], we introduce an intelligent PUEA with full knowledge of radio environment and exactly co-located with the PU transmitter and transmit with the same power level. The channel occupancy rate of the PUEA is estimated as attack parameter and then the modified N-P criterion is exploited to improve the CSS performance. We also explore an attack-aware threshold selection approach to combat with the PUEA in [12].
In the current study, without deploying additional sensor network and requiring any prior information about location of the PU transmitter, we propose Maximum Utility Detection (MUD) approach. We consider a 3-level hypotheses test based on channel status and utility function is applied to the MUD scheme. Finally, the hold hypothesis is chosen by comparing utility values in each sensing interval.
2.
SYSTEM MODEL
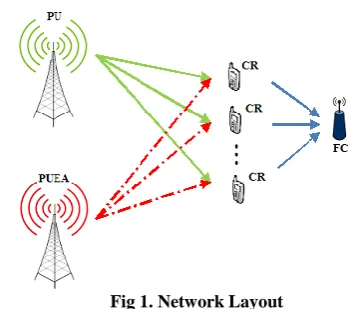
The considered system model is a centralized CR network including a PU transmitter, N collaborative CR users, an FC and a PUEA. Each CR user independently conducts its spectrum sensing and then local measurements are sent to the FC to take the global decision about the presence or absence of the licensed PU signal. The network model is shown in Fig. 1.
Fig 1. Network Layout
signal to disrupt the CR network operation. We further assume that the attacker is able to distinguish exactly between occupied and unoccupied frequency bands allocated to the PU. Based on the presence or absence of the PU and PUEA, there are three possibilities which can be expressed as:
0 1 2
only Noise under
PU + Noise under
PUEA+ Noise under
H H H
The first state H0 occurs when the CR users receive only noise. Moreover, the channel is neither occupied by the PU nor by PUEA. The second state H1 happens when the PU transmits over the channel while the PUEA is absent. If the PU is absent and PUEA transmits the fake signal, the CR users receive only the PUEA signal plus noise, as stated by the third hypothesis H2. We assume that two hypotheses
H
1 andH
0 indicate the presence and absence of PU signal, respectively. Similarly, the presence and absence of the PUEAsignal are denoted by on
E and off
E , respectively. Based on
the above mentioned assumptions, the probability of each hypothesis
H
k , denoted by k, is determined as0 0 0 0 0
1 1 1 1 1
2 2 0 0 0
( ) ( , ) ( ) ( ) ( ) ( , ) ( ) ( ) ( ) ( , ) ( ) ( ) off off off off on on
P H P H E P E H P H P H P H E P E H P H
P H P H E P E H P H
(1)
Let the parameter (called attack strength through the study) be the conditional probability regarding the presence of the
fake PUEA signals in the hypothesis H0, (i.e.
0
( )
on
P E H
). Thus, the above equation can be simplifiedto
0 0
1 1
2 0
(1 ) ( )
( ) ( ) P H P H P H
(2)By considering the 3-level hypotheses, the received signal at the thi sample of the jth CR user, xij, can be formulated as 0 1 2
i ji i i
j j j j
i i
j j j
n
H
x
p
n
H
e
n
H
(3)
where nij is the Additive White Gaussian Noise (AWGN) at
the jth CR user. The parameters
jp
ij and
je
ij are the received PU and PUEA signal with the powersj and
j
, respectively. We assume that the noise at each sample (
i j
n ), the PU signal (pij), and PUEA signal sample (eij) are independently and identically distributed Gaussian random variables with zero mean and unit variance. We further assume that the CR users experience independent Rayleigh fading channels with the same average SNRs. This condition is relevant for CR network which is geographically far from
the PU and PUEA transmitters. Thus,
j and
j vary from (observation) period to period while their Probability Density Functions (PDFs) are identically as exponential distribution with the average values and
, respectively. The parameter is also defined as / . Obviously, a larger value of ( 1) indicates a more powerful PUEA. As mentioned in equation (3) and with regard to the aboveassumptions, the received signal,
x
ij, is a Gaussiandistributed as [13],
(4)
Moreover,
M
samples are used for local energy detection at each CR user during one detection interval. The observed energy of the jth user,j
E , is given by
0 2
1 1
2
~ ( 1)
( 1)
M ji
j j j j
i
j j
a H
E = x b H
c H
(5)
where the random variables aj, bj and cj follow a central
Chi-square distribution with
M
degree of freedom. But, according to central limit theorem, if a large number of samples are considered (i.e.M
10
), these random variables can be assumed to be Gaussian distributed.In conventional Equal Gain Combining (EGC) scheme [13], in the absence of the PUEA, all of the sensing reports are summed up and compared with a predefined threshold to determine the channel status. The output signal at the FC is
1 0 1
H H N j jY E (6)
where
is the global threshold and determined by the target false alarm or miss detection probability. In the presence of the PUEA, the decision statisticsY
is a Gaussian distributed as (7) where 0 0 2 1 1 2 2 2 , 2( 1) , 2 ( 1)
( 1) , 2 ( 1)
MN MN MN MN MN MN
Let Qfa and Qm be the probabilities of global false alarm and miss detection, respectively. Then we have
0
,
1
on off
fa m
Q P D H Q P D H (8)
evaluate the performance of CSS in the presence of the PUEA and compare it to conventional method, in which the PUEA is not considered, we use global error probability Qe. The parameter Qe defines probability of making a wrong decision in PU detection and it can be written as
0 1 0 1 ( , ) ( , ) ( ) ( ) on off e fa m
Q P H D P H D
P H Q P H Q
(9)
3.
THE PROPOSED MAXIMUM
UTILITY DETECTION APPROACH
In this section, the proposed MUD criterion is applied to find the hold hypothesis. For a 3-level test, each utility function is defined as
0 0 0
1 1 1
2 2 2
( )
( )
( )
U Y
P Y H
U Y
P Y H
U Y
P Y H
(10) where
22
(
)
1
exp(
)
0,1, 2
2
2
k k k kY
H
k
P Y
The values of
U Y
k( ),
(
k
0,1, 2)
are calculated in FCand the hold hypothesis
H
r is chosen if( )
( )
for all
r k
U Y
U Y
r
k
(11)The proposed MUD approach is summarized in Algorithm 1.
Algorithm 1: The CSS process in the presence of malicious
PUEA using MUD3-Level Hypotheses Test method
Input:Spectrum sensing reports Ej for j1,2,...,N
1) Calculate Y using equation (6)
2) Calculate U Y0( ), U Y1( ) and U Y2( ) using equation (10)
3) Compare U Y0( ), U Y1( )and U Y 2( )
4)
r
argmax
0 k 2U
k( )
Y
Output: Selecting H as a hold hypothesisr
4.
PRACTICAL CONSIDERATION
In previous sections, we investigated collaborative sensing in the presence of a PUEA theoretically, without considering practical limitations. For instance, to find the hold hypothesis by (10), the FC needs to get the value according to (2). There might be several different methods for FC to get the parameter
but here, we propose a method based on the mean value of received sensing reports. Two parametersm
and mathematical expectation of m are defined as
1 1
1
1
,
( )
(
)
N j
N
jj j
m
E
m
E
N
N
(12)
By considering three different hypotheses
H
0,
H
1,
andH
2 we have0 0 1 1 2 2
0 1 2
(
)
(
)
(
)
(
)
(
1)
(
1)
j j j j
j j
E
E H
E H
E H
M
M
M
(13)
By substituting equation (13) into equation (12), we have
0 1 2
( )
(
1)
(
1)
m
M
M
M
(14)Finally, the value of attack strength
is estimated as1 2
( ( ) ) /
m
(15)where two parameters
1 and
2 are defined as1
MP H
(
0)
M
(1
) (
P H
1) ,
2
M P H
(
0)
5.
SIMULATION RESULTS AND
DISCUSSIONS
In the proposed system model there are 12 CR users that use
energy detection by
M
30
samples. The channels areassumed to be Rayleigh fading. Moreover, prior probabilities
0
(
)
P H
andP H
(
1)
are assumed to be 0.8 and 0.2,respectively. Throughout the simulations, we have depicted that there is not any PUEA signals labeled by “EGC (No Attack)” curves and the case that there is PUEA signals and the FC is not aware of the fake signals labeled by “Conventional” curves.
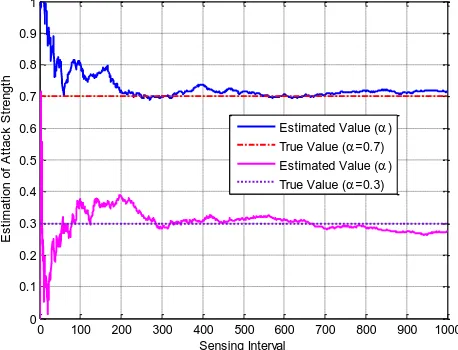
Figure (2) shows the convergences of attack strength for
0.3 and 0.7
. The estimated value for isconverged to constant values after applying almost 300 rounds of sensing. In the simulation, the initial stage can be set as the first 500 sensing intervals where the attack strength is estimated.
Fig. 2. The convergences of attack strength (0.3 , 0.7) Figure (3) shows the probability of error versus average SNR for attack strength 0.3 and 0.9. As shown, using the proposed MUD method improves performance of CSS under PUEA signals. In conventional method, the presence of PUEA
0 100 200 300 400 500 600 700 800 900 1000 0 0.1 0.2 0.3 0.4 0.5 0.6 0.7 0.8 0.9 1 E s ti m a ti o n o f A tt a c k S tr e n g th Sensing Interval
signals leads to high energy level in the FC. Consequently, the error probability increases with increasing the average SNR.
Fig. 3. Probability of error versus average SNR () with 0.5
Figure (4) depicts the error probability versus attack strength
for
1/ 2
and
2
in
5dB.
As shown in the figure, in conventional method, increasing
and
leads to more probability of error at the FC, in contrary, by the proposed method, increasing
and
causes a little changes in the rate of error probability.Fig. 4. Probability of error versus attack strength ()
Figure (5) shows the error probability versus attack parameter
for attack strength 0.3 and 0.9 in
5dB.
As shown, using the proposed MUD method improves performance of collaborative sensing in the presence of a malicious PUEA.6.
CONCLUSION
In this study, a novel Collaborative Spectrum Sensing (CSS) scheme in the presence of PUEA based on Maximum Utility Detection (MUD) approach for 3-level hypothesis test was introduced. The proposed MUD method tried to find the hold hypothesis by comparing utility function of each hypothesis. The obtained results verified the effectiveness of the proposed
Fig. 5. Probability of error versus
7.
REFERENCES
[1] J. Mitola, G. Q. Maguire, “Cognitive radio: making
software radios more personal,” IEEE Personal
Communication, vol. 6, no. 4, pp. 13-18, 1999.
[2] S. Haykin, “Cognitive radio: brain-empowered wireless communications,” IEEE Journal on Selected Areas in Communications, vol. 23, no. 2, pp. 201-220, 2005. [3] I. F. Akyildiz, W. Y. Lee, M. C. Vuran, S. Mohanty,
“NeXt generation/dynamic spectrum access cognitive radio wireless networks: A survey,” Computer Networks, vol. 50, no. 13, pp. 2127-2159, 2006.
[4] R. Chen, J. M. Park, “Ensuring trustworthy spectrum sensing in cognitive radio networks,” In 1st IEEE Workshop on Networking Technologies for Software Defined Radio Networks, pp. 110-119, 2006.
[5] S. Anand, Z. Jin, K. Subbalakshmi, “An analytical model
for primary user emulation attacks in cognitive radio networks,” In Proceeding IEEE International Dynamic Spectrum Access Networks, pp. 1-6, 2008.
[6] R. Chen, J. M. Park, J. H. Reed, “Defense against primary user emulation attacks in cognitive radio
networks,” IEEE Journal of Selected Area in
Communications,vol. 26, no. 1, pp. 25-37, 2008. [7] C. Chen, H. Cheng, Y. D. Yao, “Cooperative spectrum
sensing in cognitive radio networks in the presence of the primary user emulation attack,” IEEE Transactions on Wireless Communications, vol. 10, no. 7, pp. 2135-2141, 2011.
[8] M. Haghighat, S. M. S. Sadough, “Cooperative spectrum
sensing for cognitive radio networks in the presence of
smart malicious users,” International Journal of
Electronics and Communications (AUE), vol. 68, no. 6, pp. 520-527, 2014.
[9] Haghighat M, Sadough SMS. Smart primary user
emulation in cognitive radio networks: defense strategies against radio-aware attacks and robust spectrum sensing. Transactions on Emerging Telecommunications Technologies, vol. 26, no. 9, pp. 1154-1164,2015. [10] R. Yu, Y. Zhang, Y. Liu, S. Gjessing and M. Guizani,
User Emulation Attacks,” IEEE Network, vol. 30, no. 6, pp. 62-69, 2016.
[11]A. A. Sharifi, M. Sharifi, M. J. Musevi Niya. “Collaborative Spectrum Sensing under Primary User Emulation Attack in Cognitive Radio Networks,” IETE Journal of Research, vol. 62, no. 2, pp. 205-211, 2016. [12]A. A. Sharifi, M. Sharifi, M. J. Musevi Niya. Secure
cooperative spectrum sensing under primary user emulation attack in cognitive radio networks:
Attack-aware threshold selection approach. AEU - International Journal of Electronics and Communications, vol. 70, no. 1, pp. 95-104, 2016.
[13]J. Ma, G. Zhao, Y. Li, “Soft combination and detection for cooperative spectrum sensing in cognitive radio
networks,” IEEE Transactions on Wireless
Communications, vol. 7, no. 11, pp. 4502-4507, 2008.
[14]P. K. Varshney, “Distributed Detection and Data