* To whom all correspondence should be addressed. E-mail: [email protected]
Quality Assessment of Educational Services Technical
Complex Tehran (Tehran Representation) Based on Seroquel
Hossein Abasian1, Hassanreza Zeyn Abadi1 and Maryam Sasanian2*
1Department of Management, University of Al-Khwarizmi, Karaj, Iran. 2Department of Education, University of Al-Khwarizmi, Karaj, Iran.
DOI: http://dx.doi.org/10.13005/bbra/1956
(Received: 25 September 2015; accepted: 03 November 2015)
The aim of this study was to evaluate the quality of educational services Technical Complex Tehran (Tehran representation) is based on SERVQUEL model. SERVQUEL model has dimensions of tangible, reliability, responsiveness, assurance and empathy is. The purpose of this study, is an applied research and the collection of data and analysis is a descriptive study and survey. The population of the study consisted of all students complexes of Tehran (representing Alborz) up to 285 people, among them a randomly selected sample. Data were collected by questionnaire Parasuraman (1994) that its validity and reliability were confirmed by standard methods. In this study, the Kolmogorov– Smirnov statistic and descriptive data to determine the normality of the data and Wilcoxon tests were used to test the hypotheses. The results show that in all aspects of Servquel (of tangible, reliability, responsiveness, assurance and empathy) between what the students understand and what about the quality of educational services is expected, there is a significant difference at the 0.05 level
Key words: Assessment, educational services, SERVQUEL, complexes of Tehran.
In a competitive environment, organizations are competing to attract customers, customer satisfaction is a key element in the success and excellence of services provided by organizations and an important factor for profitability and customer loyalty to the organization (Manuel, 2008) . Today, more than ever, the issue of quality of service as an important factor for growth, success and sustainability of the organization and as a matter of strategic, effective and comprehensive management of organizations has been on the agenda (Daglas & Firdaus, 2006). As organizations have realized the extent to which expectations and feedback Lack of information on customers’ perceptions of the
services provided to organizations, will create problems (Alvani and Riahi, 2003)
customers feel they should be (expectations) by a judgment which has the services (perceptions). This is defined as the difference between customer expectations of product and service, and this is because of customer dissatisfaction (Enayati et al,2011). Overall quality is a complex concept and various aspects (Shieldes, 1999) and its meaning varies according to the mentality of the people. Quality can be anything appropriate to use a specific definition (Enayati et al,2011).
Education in any society vital role in the development of various aspects of economic, social and cultural. So that the growth and development of all systems related to the development of quantitative and qualitative aspects of education, especially higher education. In other words, developing countries are tied to the educational system (Karimiyan et al, 1390). The concept of quality in education is not easy to define the complexity and uncertainty of the quality of the education process and how this process is formed, it is difficult to define, experts believe that the concept of quality, without form and therefore not measurable.
On the other hand, to evaluate the quality, traditional attitudes, characteristics of the goods or services as defined quality criteria. However, based on new methods and approaches, define quality customer demands. Due to the fact that most of the knowledge management services and perceptions of consumers’ perceptions of their actual proportion does not exist and this would damage the quality of service, quality assessment from the perspective of the recipients of the services will be necessary. Obtain feedback from the consumers’ or customers helps logical that the need for continuous improvement is due to the limitations of time and resources prioritized (Chein & Pun, 2002)
Students who are the main clients are trained and have attracted the most attention. There are two views on the importance of students as clients: One view is that as the incoming and outgoing students involved in the learning process. Another view is that potential employers, students considered as primary customers and believe that the market should take into account the economic reality and the needs of employers and students consider appropriate for the content. In both views the students as customers are
important (Yeo, 2008). Now in the world the students about all aspects of education provided in educational institutions as a necessary check and monitor the quality of the university is considered to be (Hill & Lomas, 2003) have. Open these institutions has led to more competition between them, and each try to grow the quality of educational services so that they can attract more students. According to the description provided and the importance of assessing the quality of educational services from two aspects, one country’s need for quality educational services to train specialists and other competition among educational institutions in order to attract more customers, in this research seeks to assess the quality of educational services Complex of Technical Tehran (Tehran representation) as one of the institutions at the state level can be raised. For this purpose, the models used to evaluate the services of Servquel.
Research Methodology
The purpose of applied research and the method is descriptive-survey. The aim of this study was to evaluate the quality of educational services Technical Complex Tehran (Tehran representation) is based on SERVQUEL model. SERVQUEL model dimensions upon which the assessment is paid educational services are the tangible elements, reliability, responsiveness, assurance and empathy is. To collect the data, and library field were used. A use of a questionnaire and standard questionnaire Parasuraman (1994) was used. In this study, the validity of the number of professors and experts in the field of education planning and management training were used. And finally to determine the validity, the final questionnaire was given to a number of experts and after the discussion and resolution of ambiguities, was approved. The validity of the questionnaire was confirmed with high integration. Also, factor analysis was used for construct validity of the results obtained in the model are outlined below.
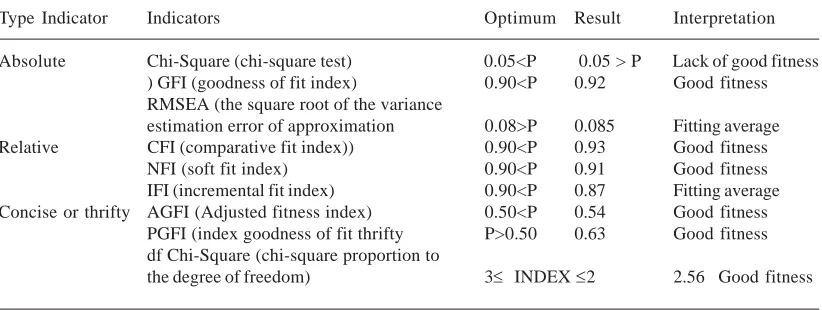
Table 1. Indices fit
Type Indicator Indicators Optimum Result Interpretation
Absolute Chi-Square (chi-square test) 0.05<P 0.05 > P Lack of good fitness ) GFI (goodness of fit index) 0.90<P 0.92 Good fitness RMSEA (the square root of the variance
estimation error of approximation 0.08>P 0.085 Fitting average Relative CFI (comparative fit index)) 0.90<P 0.93 Good fitness
NFI (soft fit index) 0.90<P 0.91 Good fitness IFI (incremental fit index) 0.90<P 0.87 Fitting average Concise or thrifty AGFI (Adjusted fitness index) 0.50<P 0.54 Good fitness
PGFI (index goodness of fit thrifty P>0.50 0.63 Good fitness df Chi-Square (chi-square proportion to
the degree of freedom) 3≤ INDEX ≤2 2.56 Good fitness
Table 2. Cronbach's alpha coefficient
Dimension Cronbach’s alpha coefficient
Tangible factors 0.823 Factors Reliability 0.824 Power of Accountability 0.822 Factors trust 0.709
Of empathy 0.824
Total Inventory 0.954
Table 3. Demographics
Sex Male 60.7% Female 39.3%
Age Less than 20-30 years 30-40 years 40-50 years 50and above
20 16.1% 42.1% 21.1% 19.3% 1.4%
Education Diploma or Diploma Bachelor MA PhD
less 0% 20.4% of 40.4% 29.5% 9.7%
acceptable indicators and overall showed a good fit to the data model. Fitting indicators obtained, data comply with the model and model to confirm the result.
The study also used to determine the reliability of the questionnaire, after collecting complete the questionnaire, Cronbach’s alpha reliability coefficient was evaluated with the following results have been reported. Cronbach’s alpha coefficient is 0.954 and the Cronbach’s alpha values results in Table 2 have been reported. As it is an all variables are acceptable reliability and Cronbach’s alpha of all variables after the completion of the questionnaires more than the standard 0.7
The population of the study consisted of
all students complexes of Tehran Branch of the Alborz province. For stratified random sampling method was performed. The classes consist of courses that the students are randomly selected to answer the questionnaire. To measure the sample size in this study used a formula based on the population of a community is limited to the following sample is used for this purpose.
n = N(zα2) 2. p(1 − p)
ε2(N − 1) + (zα
2) 2. p(1 − p)=
1100 (1.96)2. 0.5(1 − 0.5)
(0.05)2(1100 − 1) + (1.96)2. 0.5(1 − 0.5)= 284.9467 ≅ 285
The formula z_ (α / 2) of the normal value corresponding to 95 percent (z_ (α / 2) = 1.96); e: amount authorized is wrong with the self-diagnosis based on probability sampling error calculation is (ε = 0.05); N: the population size is around 1,100; P value of 0.5 is considered. Because in this case, n
is to find the maximum possible amount.
The study analyzed data from Kolmogorov - Smirnov and non Nrmval according to the data by the Wilcoxon test was used.
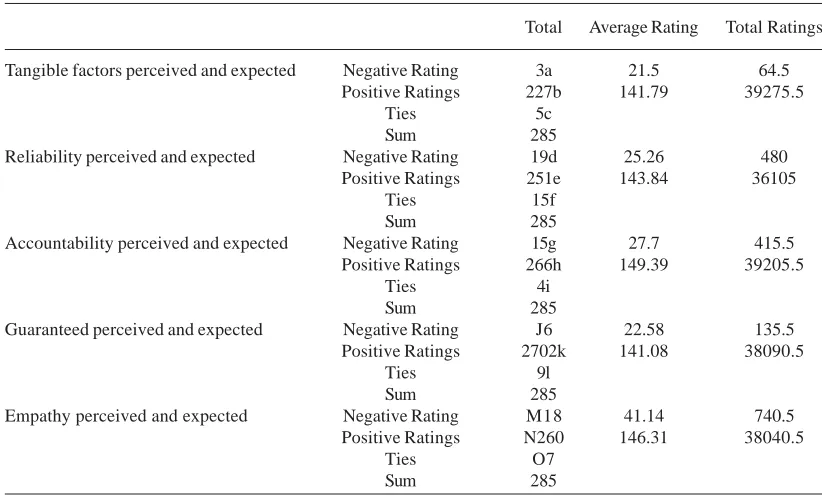
Table 4. Results of the Wilcoxon test
Total Average Rating Total Ratings
Tangible factors perceived and expected Negative Rating 3a 21.5 64.5 Positive Ratings 227b 141.79 39275.5
Ties 5c
Sum 285
Reliability perceived and expected Negative Rating 19d 25.26 480 Positive Ratings 251e 143.84 36105
Ties 15f
Sum 285
Accountability perceived and expected Negative Rating 15g 27.7 415.5 Positive Ratings 266h 149.39 39205.5
Ties 4i
Sum 285
Guaranteed perceived and expected Negative Rating J6 22.58 135.5 Positive Ratings 2702k 141.08 38090.5
Ties 9l
Sum 285
Empathy perceived and expected Negative Rating M18 41.14 740.5 Positive Ratings N260 146.31 38040.5
Ties O7
Sum 285
a) tangible factors expected <perceived tangible factors b) tangible factors expected> perceived tangible factors
c) tangible factors expected to understand the tangible factor d) expected Reliability> Reliability perceived
e) expected Reliability> Reliability perceived f) = the expected reliability perceived reliability
g) meet the expected <accountability perceived h) meet the expected> perceived accountability
i) meet the expected respondents perceived j) ensure the expected <guarantee perceived
k) ensure the expected> perceived guarantee l) = assurance perceived guarantee expected
m) empathy expected <empathy perceived n) empathy expected> perceived empathy
o) Expected = empathy perceived empathy
Table 5. z-statistics and the Wilcoxon test sig
Tangible Guaranteed Accountability Reliability Tangible Factors perceived perceived and perceived factors Perceived and expected expected and expected perceived
and expected and expected
-13.931* 14.321* 14.235 *- 13.882*- -14.464* Z
0 0 0 0 0 SIG
Based on negatives*
normal society. Given the non-normality of the community to test the hypotheses, nonparametric Wilcoxon test is a test that is used when the results are specified in the table below.
As in the above tables that are Wilcoxon test result is clear, according to statistics obtained z and a sig that is smaller than 0.05 every five hypothesis is confirmed. In other words, the results show that the dimensions of tangible, reliability, responsiveness, assurance and empathy perceived and expected there are gaps. According to Table 4,
and negative values of z statistics can be concluded that the students of this institution are understanding of what is expected of them located in the lower level. Depending on what the students have understood the situation and using the Friedman test to rank these five dimensions have been studied to determine what the institution is in a better position. The results are given in the following table:
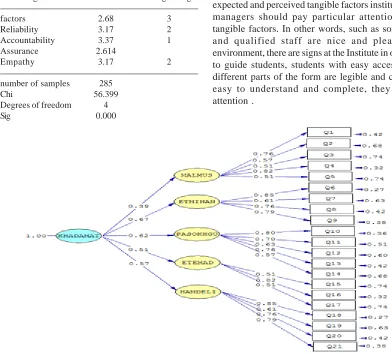
the first rank and two of reliability and empathy with an average rating of 3.17 in second place and so on tangible factors and ensure the third and fourth is in place.
DISCUSSION
The results of the research show that students from these five factors are perceived and what is expected of them there.
Because there is a difference between expected and perceived tangible factors institution managers should pay particular attention to tangible factors. In other words, such as sorting and qualified staff are nice and pleasant environment, there are signs at the Institute in order to guide students, students with easy access to different parts of the form are legible and clear, easy to understand and complete, they pay attention .
Fig. 3. Test the model in a standardized coefficients Table 6. Ranking of Servquel
IndexTangible Rank Rating average
factors 2.68 3
Reliability 3.17 2
Accountability 3.37 1 Assurance 2.614
Empathy 3.17 2
number of samples 285
Chi 56.399
Degrees of freedom 4
Sig 0.000
The result of this hypothesis with the results of the investigation Enayati Fard and others (2011), Rezaeian and others2011), Ghalavandi and others (2012), S. and Majidi (2013), Bradley (2006), Brachadv (2009),Abyly and others (2012) were consistent with the results Hunter was born (2011) and Tsynydv (2010) is not consistent.
Because there is a difference between expected and perceived reliability institution managers should pay particular attention to reliability. In other words, such as providing proper
service by the staff, especially at the time of presentation, serve in the time promised, enthusiastic staff and take responsibility and correct the mistakes and the ability staff and faculty and offer solutions heed.
and ABili and others (2012), is consistent. Because there is a difference between expected and perceived accountability of managers should pay particular attention to accountability. In other words, such as suitability of the staff and faculty at busy times, provide information on the previous and new services, guidance and proposals to clients and students, facilitate communication with the authorities and appropriate authorities and staff’s response time by telephone or written note.
The result of this hypothesis with the results of the investigation majesty (1384), Sir Molaei (2008), providential, oven and others (2011), Rezaeian and others (2011), Ghalavandi and others (2012), Bradley (2006), Brachadv ( 2009), Hunter M. (2011), Tsynydv (2010) and Byly and others (2012), is consistent with the results Sohrabi and Majidi (2013) is not consistent.
The result of this hypothesis with the results of the investigation majesty (2005), providential, Fard and others (2011), Rezaeian and others (2011), Ghalavandi and others (2012), Brachadv (2009), Hunter M. (2011), Tsynydv (2010) and Byly and others (2012), is consistent with the results Sohrabi and Majidi (2013), Sir Molaei (2008) and Bradley (2006) is not consistent.
Because there is a difference between empathy perceived and expected institution managers should pay particular attention to empathy. In other words, such as allocation of time to the student according to his request, help and compassion to students in case of a problem for him, offering services in weekends and listen to students, and to Him friendly relations.
The result of this hypothesis with the results of the investigation majesty (2005), Sir Molaei (2008), S. and Majidi (2013), providential, oven and others (1390), Rezaeian and others (2012), Ghalavandi and others (2013), Brachadv (2009), Hunter M. (2011), Tsynydv (2010) and Byly and others (2012), in line with the results of research and Bradley (2006) is not consistent.
The following suggestions are offered based on the results of the research.
Emphasis on tangible factors with an emphasis on orderliness and qualified staff, delightful and pleasant environment for visitors and students, the installation of signs to guide students, students with easy access to different
parts of the design and legible form of and sentences that can be easily understood.
Emphasis on reliability by providing proper service by the staff, especially in the first visit in order to attract clients, serving at the time promised to give the impression that to fulfill the obligations of the institution, positive, motivation the employees to take responsibility and correct the mistakes and empowerment of staff and selection of outstanding teachers in order to provide appropriate solutions to students.
Emphasis on accountability, with an emphasis on proper treatment of staff, especially at busy times, as well as teachers in the classroom, providing information on previous and new services in order to increase awareness of patrons and the Students for a proposal to the tips and accelerate the processes of learning, ease of communication with the authorities in order to receive comments, suggestions and suitability of staff and officials by telephone and a written response to address fast to the problems students Emphasis on creating space and culture in order to ensure a faithful and trusted confidant of the staff and officials of the Institute, provided clear answers to students by the directors and staff of the Institute for the loss of students and apprize questions and problems, students There are changes in order to avoid inconsistencies and earn the most interest from students.
Emphasis on empathy with appropriate time allocated to the student in accordance with his request, so that students feel important and he needs to fix the effort to help sympathy to the student at the time of problems him in order to to feel close to the student with the institution, providing services at weekends to increase the relevance and accessibility of students with and listening to the student and his friendly relations with students to reduce conflicts and relationship management.
REFERENCES
1 Abili Khodayar , Fatemeh Narenji Thani, Maryam Afarinandehbin, “Measuring university service quality by means of SERVQUAL method”, Asian Journal on Quality, 2012; 13( 3): 204 -211
Research and Training Center, 2003.
3. Chin K, Pun K. A proposed framework for implementation TQM in Chinese organizations International Journal of Quality and Reliability Management;2002; 19 (3): 272-94.
4. Dou glas, A. & Douglas J., Campus spies? Using mystery students to evaluate university performance. Education Research, 2006; 48(1): 111-9.
5. Enayati novin oven, Ali Yousefi Afrashtet, Majid, Siami, Leila, Javaheri Daneshmand, M. evaluating the quality of educational services Payam Noor University of Hamedan on Servqual, Research and Planning in Higher Education, 2011; 61.
6. Ghalavandi, faith, Beheshti Rudd, R., Qaleye, Ali R., check the status of Urmia quality educational services based on SERVQUAL model, Process Development Management, 2012; 25(3).
7 Karimiyan, Heydar, Naderi , Ezatolallah , Attaran, Mohammad Salehi, Keyvan, internal assessment approach to improve the quality of higher education, training, strategic Quarterly, 2011; 4(2): 24 -32
8. Hil l Y., Lomas L., Student’s perceptions of quality in higher education. Quality Assurance Education. 2003; 11(1): 15-20.
9. Man uel N., Customer perception of service quality at the business studies unit of the Durban University of Technology, Research project,
2008.
10. Rezaeian, Sajjad, Rezaeian, A., Hasan Zadeh, F, Rezaeian, M., restrictions on the use of SERVQUAL in the quality of academic centers: A Case Study of PNU, the fifth Conference of assessing the quality of the university system, Tehran, 2011.
11. Sahney S, Banwet DK & Karunes S., An integrated framework for quality in Education: application of quality function deployment, interpretive structural modeling and path analysis. Total Quality Management & Business Excellence; 2006; 17(2): 265-85.
12. Sohrabi, Zohre, Majidi, Z., The quality gap of educational services: education administrators, faculty members and medical students, health Payavard Journal, 2013; 7(5).
13. Shields, P. M.; “Zen and the Art of Higher Education Maintenance: Bridging Classic and Romantic Notions of Quality”; Journal of Higher Education Policy and Management, 1999; 21(2): 165-172.
14. Tsinidou Maria , Vassilis Gerogiannis, Panos Fitsilis, “Evaluation of the factors that determine quality in higher education: an empirical study”, Quality Assurance in Education, 2010; 18(3): 227 -244