How Elements of Corporate Culture Affect Overall
Firm Performance
Cenk Laçin ARIKAN1,Didem ENGİNOĞLU2
1
Asst. Prof., Department of Business Administration, Gediz University, Izmir, Turkey 2
Lecturer (PhD.), Program of Business Administration, Gediz University, Izmir, Turkey
Abstract:
This quantitative study examines the relationship between the dimensions of corporate culture and the two types of firm performance: quantitative and qualitative. Data were collected from 45 companies representing a vast portfolio of industries in Turkey. Results derived from the respondents, all of whom were executives from human resources departments, reveal the rich nature of the relationship between corporate culture and overall firm performance. The findings provide support for all three hypotheses studied. The results show that elements of corporate culture have significant positive effects on overall firm performance, both in terms of quantitative firm performance and qualitative firm performance. Thus, practitioners and researchers alike can benefit greatly from the findings and implications reached from this quantitative study conducted in the Turkish business environment.
Keywords: Corporate culture, elements of corporate culture, firm performance, quantitative performance, qualitative performance.
INTRODUCTION
Although organizational culture studies date back a long time, corporate culture and its effects have gained a lot of attention especially over the past two decades (Rashid et al., 2003). The reason for this is the immense effects that have been shown in the literature time after time linking corporate culture to organizational performance. Corporate culture is a significant component of organizational strategy and success. A strong corporate cultural structure provides certain competitive advantages to firms. In the literature, corporate culture has been defined by several authors in various ways. According to George et al. (1999) corporate culture is an integral component of organizations which influences employee behaviors and performance outcomes. In their seminal work, Kotter and Heskett (1992) emphasize especially the long-term effects corporate culture has on organizational performance.
Many researchers agree that the origin of organizational culture studies date back to the initial contributions by Pettigrew (1979) and Dandridge et al. (1980). The major focus in this beginning era can be said to discover hidden myths, figure symbolisms and artifacts, and to identify the informal groupings within organizations. All major studies in this era have tried to unlock the deep nature of this informal entity within firms.
A great majority of the studies conducted on the relationship between corporate culture and organizational performance can be traced back to Denison (1990). His classification has helped shape a vast majority of following studies. The importance of his original study was the findings that related high performing organizations to participative cultures in specific. Another emphasis on the firm performance and effectiveness has been made by Reichers and Schneider (1990). They tried to underline the lack of emphasis on the relationship between corporate culture and firm performance until that time. Due to the nature of corporate culture, all studies need to be repeated over time and in other cultural settings. This fact clearly highlights the situational characteristics of all cultural studies.
This particular study examines companies operating in Turkey. Thus, it can add significantly onto the already accumulated knowledge within the corporate culture literature by its focus and the refinement it provides. The paper first analyzes the literature by summarizing all major approaches already available in corporate culture. Then, the theoretical framework including the hypotheses and the methodology used are reported. Finally, the findings are presented and implications for both companies and professional managers are stated.
LITERATURE REVIEW
Corporate culture is how an organization perceives, evaluates, and reacts to the internal and external factors shaping the environment. Thus, it reflects the aggregate values and perceptions of the organizational members. Scholz (1987) asserts that corporate culture is unique and related closely with strategy. Furthermore he claims that corporate culture should not be confused with different but similar sounding concepts such as national culture, organizational climate, and corporate identity.
individualism/collectivism, 4) masculinity/femininity, and 5) short/long term orientation. Power distance dimension refers to the degree of hierarchy and communication between top management and employees in an organization. Uncertainty avoidance refers to the level of uncertainty and risk in the organization. Individualism and collectivism dimension emphasizes the degree to which employees are integrated into teams. Masculine cultures emphasize competitiveness and achievement orientation whereas feminine cultures prioritize feelings, empathy, and employee involvement. Short/long term orientation dimension focuses on how tasks are organized in order to maximize overall benefits.
According to Carmeli and Tishler (2004) both tangible and intangible elements have a crucial impact in creating organizational value. However, the importance of intangible resources of organizations is becoming increasingly more critical in creating a competitive advantage. Therefore, they classify six intangible elements. These intangible elements are 1) managerial capabilities, 2) human capital, 3) perceived organizational reputation, 4) internal auditing, 5) labor relations, and 6) corporate culture. They also report the strategic importance and positive effects of six intangible organizational elements and their interactions with organizational performance.
Schein (1992) states that corporate culture is a set of shared assumptions that help solve problems that arise within and outside the organization. These shared assumptions, in time, turn into strong values that can further be transferred to the newcomers. Thus, corporate culture replicates itself in different parts of the organization with different organizational members.
According to Van der Post et al. (1998) certain dimensions within organizational culture have significant positive effects on financial firm performance. Even though most researchers, by far, have preferred to look at the effects of corporate culture on quantitative performance, qualitative performance or “quality performance” (Prajogo and McDermott, 2011, p.714) has caught some attention (Oakland, 1995; Wilkinson et al., 1998; Stock et al. 2007) as well. Therefore, it can be said that for more comprehensive results an integrative approach combining both quantitative and qualitative aspects will naturally be more beneficial. This way, studies can provide richer content and provide safer suggestions for implications.
Rashid et al. (2003) show the relationship between corporate culture, organizational commitment, and financial performance. They claim that there is a link between the type of corporate culture such as entrepreneurial or competitive culture and the type of organizational commitment which motivates the employees. Thus, this link has an impact on organizational performance. Wilkins and Quchi (1983) claim that corporate culture is critical to firms’ efficiency. According to them if organizations develop cultures by the way of sharing social knowledge at the all levels of the organization, organizational efficiency increases.
In their study, Deshpande and Farley (1999) outline four main categories of corporate culture: 1) competitive corporate culture, 2) entrepreneurial corporate culture, 3) bureaucratic corporate culture, and 4)
consensual corporate culture. Competitive corporate culture refers to competitive advantage and market superiority. Entrepreneurial corporate culture refers to making innovation and risk taking. Bureaucratic corporate culture refers to formal structures and inter-organizational rules. Finally, consensual corporate culture refers to organizational commitment, values, and traditions.
According to Berson et al. (2008) there is a relationship between leaders’ values, organizational culture, and organizational outcomes. In their proposed model, they identify leaders’ values which influence organizational culture as self-direction, security, and benevolence. They indicate three broad types of organizational culture as innovation-oriented culture, bureaucratic culture, and supportive culture. They determine organizational outcomes as sales growth, corporate efficiency, and employee satisfaction, which can be subjective or objective by nature. They assert that leaders’ self-direction values are associated with innovation oriented corporate cultures, security values are related to bureaucratic corporate cultures, and benevolence values are related to supportive corporate cultures. They also report that these corporate cultural types are critical dimensions on firm performances.
Sadri and Lees (2001) claim that a strong corporate culture can be a source of competitiveness for the firm. This aspect of corporate culture makes it an even more significant construct in today’s highly competitive business environments where differentiating factors between firms tend to shift away from easy to imitate resources such as financial capabilities, machinery, buildings, hardware, etc.
The distinctive character of corporate culture makes it an ideal element of competitive advantage. More recent studies have focused on this aspect. Zohar and Luria (2004) claim that corporate culture directly affects collaborative actions of organizations and determines the sense-making mechanisms. Therefore culture presents itself in various organizational activities (Murphy et al., 2013).
Onken (1999) determines dimensions of corporate culture as polychronicity, speed, hypercompetition, and corporate performance. In her study, she examines the relationship between two temporal elements of corporate culture which are polychronicity and speed values and their effects on corporate performance in hypercompetitive marketplaces. In their literature review study, Byles et al. (1991) clarify both micro and macro cultural variables which are related to organizational performance as commitment, strategic planning, innovation, purpose and order, job satisfaction, task and authority relationships, turnover, coordination and directions of activities, and competitive advantages.
Another research which examines the relationship between corporate culture and organizational effectiveness belongs to Lee and Yu (2004). They have performed a study in three selected industries. These industries are high-manufacturing, hospitals, and insurance. One of their research instrument is organizational culture profile (OCP) which was developed by Chatman and Jehn (1994). The other research instrument is performance indicators such as financial ratios, net profitability, net returns of investments, and rate of growth. The results of their research show that cultural elements and cultural strength are related to organizational performance.
Tripathi and Tripathi (2009) categorize corporate culture in three main types. These corporate culture types are constructive corporate cultures, passive-defensive corporate cultures, and aggressive-defensive corporate cultures. Their study focuses on how corporate culture moderates the relationship between firms’ strategies and organizational effectiveness.
A seminal contribution to the corporate culture literature can be credited to Denison and the so called Denison model, which is an integrative way of assessing cultural traits. Denison (1990) defines corporate culture using four concepts. One of the assessments of this model has been made by Denison et al. (2004) where Asian, Japanese in particular, corporate culture has been compared with the European and the American corporate cultures. They report, despite all cross-cultural differences, very strong patterns between corporate culture and effectiveness. The four cultural traits of the Denison model is as follows: 1) Involvement which means that employees at all levels of the organization are engaged in their work and that each work is highly connected to the overall goals of the organization, in other words it refers to the level of attendance by members of organization in decision making processes, 2) Consistency which means that the culture evident in the organization is stable, strong, well-coordinated, and thoroughly integrated helps emphasize beliefs, values, and expectations that are believed/shared by the members 3) Adaptability refers to the degree of surviving in continuously changing environment conditions means that the organization is value oriented, continuously changing, and customer driven, and 4) Mission refers to an organization’s strategic purpose and goals and means that employees are motivated by a clear sense of direction. The relationship between these four corporate cultural concepts influence firms’ financial performance. Each of these four dimensions of the corporate culture construct have three sub-dimensions. Involvement dimension comprises of empowerment, team orientation, and capability development. Consistency dimension comprises of core values, agreement, and coordination and integration. Adaptability dimension comprises of creating change, customer focus, and organizational learning. Mission dimension comprises of strategic direction and intent, goals and objectives, and vision.
Flamholtz and Kannan-Narasimhan (2005) provide support as to how different elements of corporate culture affect financial performance. Their study is comprised of data from a vast number of people collected from a single medium sized industrial company. Their original hypothesized items (people scale, customer scale, performance and accountability scale, teamwork and communication, and corporate citizenship) have been revised through a factor analysis and the final factors have been outlined as: 1) Customer scale, 2) Human resource practices scale, 3) Identification with the company scale, 4) Performance and behavior standards scale, 5) Corporate citizenship scale, and 6) Communication scale. Among these factors, human resource practices scale and communication scale show indirect whereas all other factors show direct and significant effects on financial performance. In a previous study, Flamholtz (2001) asserts that corporate culture is at the pinnacle of organizational development pyramid and that it is composed of values, beliefs, and norms. According to this framework, corporate culture determines which management systems are going to be used in the organization. These management systems are then turned into operational systems. Operational systems are the means by which resource management is realized. Then, products and/or services of the company are identified and the kind of target markets and market niches are determined. Thus, it can be said that, all management and operations activities of organizations are heavily dependent upon overriding corporate cultures.
THEORETICAL FRAMEWORK
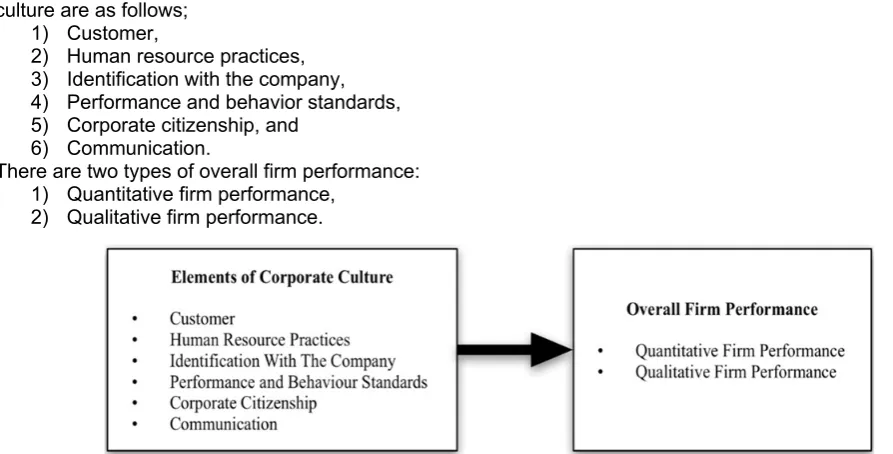
The theoretical framework of our study is shown in Figure 1. In this study, the elements of corporate culture were based on the work of Flamholtz and Kannan-Narasimhan (2005) and the overall firm performance and its quantitative and qualitative dimensions were adapted from Alpay et al. (2008). These elements of corporate culture are as follows;
1) Customer,
2) Human resource practices, 3) Identification with the company, 4) Performance and behavior standards, 5) Corporate citizenship, and
6) Communication.
There are two types of overall firm performance: 1) Quantitative firm performance,
2) Qualitative firm performance.
Figure 1. Theoretical framework on the relationship between the elements of corporate culture and overall firm performance
The conceptual model suggests that there is a relationship between elements of corporate culture and overall firm performance. Therefore, elements of corporate culture are also expected to affect both quantitative firm performance and qualitative firm performance separately.
HYPOTHESIS DEVELOPMENT
In the theoretical framework, variables in the corporate culture scale (customer, human resource practices, identification with the company, performance and behavior standards, corporate citizenship, and communication) represent significant determinants of overall firm performance. Our three hypotheses are based on the formulation presented above.
H1. Elements of corporate culture are positively related to overall firm performance. H2. Elements of corporate culture are positively related to quantitative firm performance. H3. Elements of corporate culture are positively related to qualitative firm performance.
METHODOLOGY
for firm performance, there was one item measuring overall firm performance, three items measuring quantitative firm performance, and three items measuring qualitative firm performance. The questionnaire ended with items measuring descriptive statistics showing the respondents’ company and industry information.
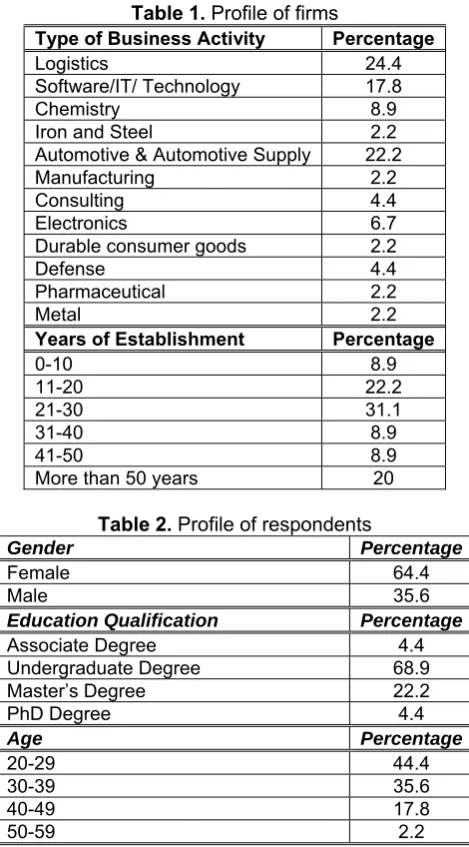
The final version of the questionnaire was converted to e-mail survey format for ease of use. A total of 105 companies, which represented a vast number of industries, were contacted through convenience sampling within Turkey in the spring months of 2016. Of those who responded back, a total of 45 questionnaires were found to be fully answered. Therefore the response rate is calculated to be roughly 43 percent, which is remarkably good considering the e-mail survey method used. The descriptive statistics depicting the profile of the firms and the respondents are presented in Table 1 and Table 2, respectively.
The collected data were analyzed using the SPSS software. The reliability test for the corporate culture construct was found to be 0.95. This figure suggests that the measurement scale used is highly reliable. The findings suggest significant effects the elements of corporate culture have on overall firm performance, both in terms of quantitative measures, and qualitative measures.
FINDINGS
Table 1 shows the distribution of the firms included in the study. The dispersion is due to the convenience sampling used. The three top major industries are 1) logistics, 2) automotive and automotive supply, and 3) software/IT/technology. This disperse nature of the industries included in the study help the generalizability of the results even though the number of companies is not extremely high. When we consider the profile of the respondents, as depicted in Table 2, education qualification, age, and job title categories all provide a wide dispersion as well. The profiles of the respondents do not show negative serious concentration in any of these categories which is a good indicator to the soundness of the results obtained.
Table 1. Profile of firms
Type of Business Activity Percentage
Logistics 24.4
Software/IT/ Technology 17.8
Chemistry 8.9
Iron and Steel 2.2
Automotive & Automotive Supply 22.2
Manufacturing 2.2 Consulting 4.4 Electronics 6.7
Durable consumer goods 2.2
Defense 4.4 Pharmaceutical 2.2
Metal 2.2
Years of Establishment Percentage
0-10 8.9 11-20 22.2 21-30 31.1 31-40 8.9 41-50 8.9
More than 50 years 20
Table 2. Profile of respondents
Gender Percentage
Female 64.4 Male 35.6
Education Qualification Percentage
Associate Degree 4.4
Undergraduate Degree 68.9
Master’s Degree 22.2
PhD Degree 4.4
Age Percentage
Job Title Percentage
HR Manager 35.6
HR Deputy Manager 2.2
HR Project Manager 2.2
HR Payroll supervisor 2.2
HR Development and training specialist 2.2
HR Specialist 46.7
HR Assistant specialist 6.7
HR Recruitment specialist 2.2
Table 3 presents scale reliabilities for all sub-dimensions used in the study. Cronbach’s alpha values suggest that all scales used are highly reliable. The only exception to this is the case for the performance and behavior standards scale. This scale is a two-item scale and therefore the reliability indicator is expected to show such an unhealthy figure. All other scales show very high levels of reliability and due to our sample size (N=45) we can safely presume that the data collected depict a normal distribution.
Table 3. Reliability of the scales used
Cronbach’s Alpha
Customer scale 0.74
Human resource practices scale 0.93
Identification with the company scale 0.78
Performance and behavior standards scale 0.20
Corporate citizenship scale 0.57
Communication scale 0.92
Quantitative performance scale 0.92
Qualitative performance scale 0.87
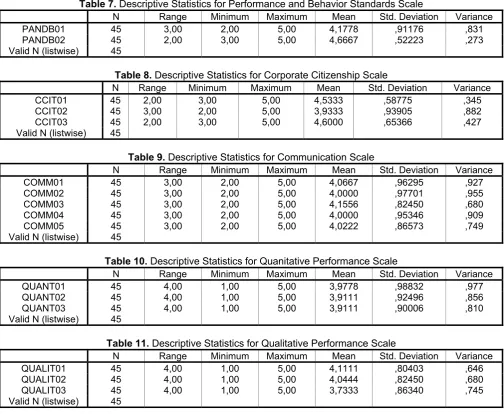
The descriptive statistics of the data collected reveal the information presented in the following tables. The tables 4 through 11 show, respectively, customer scale, human resource practices scale, identification with the company scale, performance and behavior standards scale, corporate citizenship scale, communication scale, quantitative performance scale, and qualitative performance scale.
Table 4. Descriptive Statistics for Customer Scale
N Range Minimum Maximum Mean Std. Deviation Variance
CUST01 45 1,00 4,00 5,00 4,8222 ,38665 ,149
CUST02 45 1,00 4,00 5,00 4,7778 ,42044 ,177
CUST03 45 2,00 3,00 5,00 4,5111 ,66134 ,437
CUST04 45 2,00 3,00 5,00 4,8222 ,49031 ,240
CUST05 45 2,00 3,00 5,00 4,8222 ,44153 ,195
CUST06 45 3,00 2,00 5,00 4,3333 ,73855 ,545
CUST07 45 3,00 2,00 5,00 4,4444 ,65905 ,434
CUST08 45 1,00 4,00 5,00 4,6889 ,46818 ,219
Valid N (listwise) 45
Table 5. Descriptive Statistics Human Resource Practices Scale
N Range Minimum Maximum Mean Std. Deviation Variance
HRPRAC01 45 3,00 2,00 5,00 3,9556 ,79646 ,634
HRPRAC02 45 3,00 2,00 5,00 4,1111 ,93474 ,874
HRPRAC03 45 4,00 1,00 5,00 3,4889 ,89499 ,801
HRPRAC04 45 3,00 2,00 5,00 4,1333 ,86865 ,755
HRPRAC05 45 3,00 2,00 5,00 4,1111 ,85870 ,737
HRPRAC06 45 4,00 1,00 5,00 3,8000 1,09959 1,209
HRPRAC07 45 4,00 1,00 5,00 3,9556 ,99899 ,998
HRPRAC08 45 4,00 1,00 5,00 3,8222 1,11373 1,240
Valid N (listwise) 45
Table 6. Descriptive Statistics for Identification with the Company Scale
N Range Minimum Maximum Mean Std. Deviation Variance
IDENT01 45 3,00 2,00 5,00 3,8889 ,80403 ,646
IDENT02 45 3,00 2,00 5,00 3,7333 ,86340 ,745
IDENT03 45 2,00 3,00 5,00 4,4444 ,58603 ,343
Table 7. Descriptive Statistics for Performance and Behavior Standards Scale
N Range Minimum Maximum Mean Std. Deviation Variance
PANDB01 45 3,00 2,00 5,00 4,1778 ,91176 ,831
PANDB02 45 2,00 3,00 5,00 4,6667 ,52223 ,273
Valid N (listwise) 45
Table 8. Descriptive Statistics for Corporate Citizenship Scale
N Range Minimum Maximum Mean Std. Deviation Variance
CCIT01 45 2,00 3,00 5,00 4,5333 ,58775 ,345
CCIT02 45 3,00 2,00 5,00 3,9333 ,93905 ,882
CCIT03 45 2,00 3,00 5,00 4,6000 ,65366 ,427
Valid N (listwise) 45
Table 9. Descriptive Statistics for Communication Scale
N Range Minimum Maximum Mean Std. Deviation Variance
COMM01 45 3,00 2,00 5,00 4,0667 ,96295 ,927
COMM02 45 3,00 2,00 5,00 4,0000 ,97701 ,955
COMM03 45 3,00 2,00 5,00 4,1556 ,82450 ,680
COMM04 45 3,00 2,00 5,00 4,0000 ,95346 ,909
COMM05 45 3,00 2,00 5,00 4,0222 ,86573 ,749
Valid N (listwise) 45
Table 10. Descriptive Statistics for Quanitative Performance Scale
N Range Minimum Maximum Mean Std. Deviation Variance
QUANT01 45 4,00 1,00 5,00 3,9778 ,98832 ,977
QUANT02 45 4,00 1,00 5,00 3,9111 ,92496 ,856
QUANT03 45 4,00 1,00 5,00 3,9111 ,90006 ,810
Valid N (listwise) 45
Table 11. Descriptive Statistics for Qualitative Performance Scale
N Range Minimum Maximum Mean Std. Deviation Variance
QUALIT01 45 4,00 1,00 5,00 4,1111 ,80403 ,646
QUALIT02 45 4,00 1,00 5,00 4,0444 ,82450 ,680
QUALIT03 45 4,00 1,00 5,00 3,7333 ,86340 ,745
Valid N (listwise) 45
Table 12 provides the Pearson correlations of all constructs studied in this quantitative research. The findings, as depicted on the table, provide support for all three hypotheses studied. Elements of corporate culture are significantly and positively related with overall firm performance. Elements of corporate culture are also significantly and positively related with the two sub-dimensions of overall firm performance, namely quantitative performance and qualitative performance. Furthermore, when the effects of the sub-dimensions of the corporate culture construct on overall firm performance are considered, we see that the customer scale shows a significant effect at the 0.05 level, whereas all the remaining five sub-dimensions show a significant effect at the 0.01 level. This finding suggests a very high success for the scale used.
When we consider the firm performance construct, we see that the soundness of this construct is very high, too. Overall firm performance is very significantly (at the 0.01 level) and positively related with the quantitative and qualitative performance. When we look inside the elements of corporate culture, we find that all six sub-dimensions of the construct contribute significantly and positively to the construct. Within these six items, human resource practices scale and communication scale seem to provide the highest contribution.
T
A
BL
E 12.
Correlations of Constructs
QU A L IT A T IVE QU A N TIT A IVE COMMUNIC A TION CORP OR A T E CITIZE NS HIP IDENTIFIC A TION WIT H C O M P A N Y P E R FORM A N CE A N D BE H A V IOR
HR PRA
C TIC ES CUS TOME R OVER A LL FIRM P E R FORM A N CE CORP OR A CULTURE ELEM EN TS U AL IT AT IV E Pearson Cor relat ion
Sig. (1-tailed) N
A N TIT A IV E Pearson Cor relat ion ,869(**) Sig. (1-tailed) ,000 N 45 NIC A T ION Pearson Cor relat ion ,556(**) ,553(**) Sig. (1-tailed) ,000 ,000 N 45 45 OR A T E CI TIZENSHIP Pearson Cor relat ion ,518(**) ,403(**) ,649(**) Sig. (1-tailed) ,000 ,003 ,000 N 45 45 45 EN T IFI C A TI ON WI T H A NY Pearson Cor relat ion ,412(**) ,286(*) ,697(**) ,571(**) Sig. (1-tailed) ,002 ,028 ,000 ,000 N 45 45 45 45 A N C E A N D A V IOR Pearson Cor relat ion ,557(**) ,491(**) ,769(**) ,623(**) ,621(**) Sig. (1-tailed) ,000 ,000 ,000 ,000 ,000 N 45 45 45 45 45 A C T ICES Pearson Cor relat ion ,486(**) ,443(**) ,825(**) ,711(**) ,755(**) ,730(**) Sig. (1-tailed) ,000 ,001 ,000 ,000 ,000 ,000 N 45 45 45 45 45 45 O MER Pearson Cor relat ion ,281(*) ,224 ,622(**) ,421(**) ,444(**) ,559(**) ,580(**) Sig. (1-tailed) ,031 ,069 ,000 ,002 ,001 ,000 ,000 N 45 45 45 45 45 45 45 A L
L FIRM A
NCE Pearson Cor relat ion ,927(**) ,868(**) ,594(**) ,483(**) ,414(**) ,510(**) ,497(**) ,337(*) Sig. (1-tailed) ,000 ,000 ,000 ,000 ,002 ,000 ,000 ,012 N 45 45 45 45 45 45 45 45 OR A T E C ULTU RE Pearson Cor relat ion ,538(**) ,475(**) ,922(**) ,756(**) ,804(**) ,819(**) ,947(**) ,728(**) ,554(**) Sig. (1-tailed) ,000 ,000 ,000 ,000 ,000 ,000 ,000 ,000 ,000 N 45 45 45 45 45 45 45 45 45 45 on i s signi fican t at t h
e 0.01 le
ve l (1 -t ailed ). on is signi fican t at th
e 0.05 le
IMPLICATIONS AND CONCLUSION
For companies and practitioners it is always very critical to find and sustain a competitive edge. For this end, a lot of investments are being made continuously. In the highly competitive and fast changing business environments, to obtain a competitive advantage is even more critical. In a time when almost all resources are relatively equally accessible, human resources and corporate culture seem to provide companies and professionals with a truly unique competitive advantage (Arıkan and Enginoğlu, 2016).
The findings of this quantitative study is important for companies and professional managers in various ways. Firstly, the study has been conducted within the Turkish business environment, which provides fresh and new perspectives since management studies usually focus on more Western cultures and companies. Secondly, the disperse nature of the industries studied provide a rich content. Even though the sample size is not extremely high, it is well enough for drawing conclusions and providing a normal distribution. Thirdly, this study has considered firm performance not only in terms of financial performance, as it is almost always the case in the literature, but also in terms of qualitative performance. This approach has provided this study with a more extensive perspective. In this regard, the findings also point out to the importance of the qualitative performance. In fact, qualitative performance is found to be a slightly more important effect of the overall firm performance. Thus, it can be said that future researchers are well advised to look more deeply into qualitative performance measures. Fourthly, communication scale stands out to be the most significant effect affecting the overall firm performance within all the elements of corporate culture. Therefore, for managers especially, it can be said that the effective communication is a critical issue to be considered between the superiors and subordinates. Maintaining a healthy communication and providing a cooperative work environment stand out to be important items within the communication scale. Furthermore, to create more viable communication, practitioners are highly recommended to take feedback from their workers more seriously. As for the company perspective in this communication issue, clear and concise way of sharing corporate values and policies seem to be integral parts of a well-functioning communication environment.
Lastly, another interesting finding of this study suggests that in order to improve qualitative performance, not only communication but also performance and behavior standards play a vital role. Performance and behavior standards elements within corporate culture emphasize the continuous improvements in all business processes as well as ethical behaviors and actions of all employees. Of course, all research studies come with certain limitations and ours is no exception. Our sample size can be improved in order to obtain more generalizable results. In such a case, industry specific analyses can add further to the richness of the findings. Also, the study can be repeated in different business and cultural environments and this can enhance the results obtained even more.
REFERENCES
Alpay, G., Bodur, M., Yılmaz, C., Çetinkaya, S., and Arıkan, L. (2008). Performance implications of institutionalization process in family-owned businesses: Evidence from an emerging economy. Journal of World Business. Vol: 43, 435-448.
Arıkan, C.L. and Enginoğlu, D. (2016). How to enhance corporate entrepreneurship? A Model Proposal. Tisk Akademi. Vol:11, No: 21, 160-171.
Berson, Y., Oreg, S. and Dvir, T. (2008). CEO Values, Organizational Culture and Firm Outcomes. Journal of Organizational Behavior, Vol. 29, No. 5, 615-633.
Byles, C. M., Aupperle, K. E. and Arogyaswamy, B. (1991). Organizational Culture and Performance Source. Journal of Managerial Issues, Vol. 3, No. 4, 512-527.
Carmeli, A. and Tishler, A. (2004). The Relationships between Intangible Organizational Elements and Organizational Performance. Strategic Management Journal, Vol. 25, No. 13, 1257-1278.
Chatman, J. and Jehn, K. (1994). Assessing the relationship between industry characteristics and organizational culture: How different can you be? Academy of Management Journal. Vol: 37, No: 3, 522-553.
Dandridge, T., Mitroff, I., and Joyce, W. (1980). Organizational symbolism: A topic to expand organizational analysis. Academy of Management Review. Vol: 5, 248-256.
Deal, T.E. and Kennedy, A. (1982). Corporate Cultures: The Rites and Rituals of Organizational Life. Addison-Wesley. Reading, MA.
Denison, D.R. (1990). Corporate Culture and Organizational Effectiveness. John Wiley, New York. NY.
Denison, D.R., Haaland, S., and Goelzer, P. (2004). Corporate culture and organizational effectiveness: Is Asia different from the rest of the world?
Deshpande, R. and Farley, J. U. (1999). Executive Insights: Corporate Culture and Market Orientation: Comparing Indian and Japanese Firms. Journal of International Marketing, Vol. 7, No. 4, 111-127.
Flamholtz, E. (2001). Corporate culture and the bottom line. European Management Journal. Vol: 19, No: 3. 268-275. Flamholtz, E. and Kannan-Narasimhan, R. (2005). Differential impact of cultural elements on financial performance.
George, G., Sleeth, R. G. and Siders, M. A. (1999). Organizing Culture: Leader Roles, Behaviors, and Reinforcement Mechanisms. Journal of Business and Psychology, Vol. 13, No. 4, 545-560.
Gregory, B.T., Harris, S.G., Armenakis, A.A., Shook, C.L. (2009). Organizational culture and effectiveness: A study of values, attitudes, and organizational outcomes. Journal of Business Research. Vol: 62, 673-679.
Hofstede, G. (1980), Culture’s Consequences, Sage, Beverly Hills, CA.
Kilmann, R. H., Saxton, M.J., Serpa, R., and Associates (1985). Gaining Control of the Corporate Culture. Jossey-Bass. San Francisco, CA.
Kotter, J. P. and Heskett, J. L. (1992). Corporate Culture and Performance. Free Press, New York, NY.
Lee, S. K. J. and Yu, K. (2004). Corporate culture and organizational performance. Journal of Managerial Psychology. Vol: 19, No: 4, 340-359.
Lim, B. (1995). Examining the organizational culture and organizational performance link, Leadership & Organization Development Journal, Vol. 16, No: 5, 16 – 21.
Murphy, P. J., Cooke, R. A., and Lopez, Y. (2013). Firm culture and performance: Intensity’s effects and limits. Management Decision. Vol: 51, No: 3, 661-679.
Oakland, J.S. (1995). Total Quality Management: The Route to Improving Performance. 2nd ed., Butterworth-Heinemann, Oxford.
Onken, M. H. (1999). Temporal elements of organizational culture and impact on firm performance. Journal of Managerial Psychology, Vol. 14, No: 3/4, 231 – 244.
Peters, T. and Waterman, R. (1982). In Search of Excellence. Harper and Row. New York, NY.
Pettigrew, A.M. (1979). On studying organizational cultures. Administrative Science Quarterly. Vol: 24, 570-581.
Prajogo, D.I. and McDermott, C.M. (2011). The relationship between multidimensional organizational culture and performance. International Journal of Operations and Product Management. Vol: 31, No: 7, 712-735.
Quinn, R.E. and Rohrbaugh, J. (1983). A spatial model of effectiveness criteria: Towards a competing values approach to organizational analysis. Management Science. Vol: 29, 363-377.
Rashid, Z.A., Sambasiva, M., and Johari, J. (2003). The influence of corporate culture and organisational commitment on performance. Journal of Management Development. Vol: 22, No: 8, 708-728.
Reichers, A. and Schneider, B. (1990). Organisational Climate and Culture. Josey-Bass, Sab Francisco, CA.
Sadri, G. and Lees, B. (2001). Developing corporate culture as a competitive advantage. Journal of Management Development. Vol: 20, No: 10, 853-859.
Schein, E. (1992). Organisational Culture and Leadership. Jossey-Bass, San Francisco, CA.
Scholz, C. (1987). Corporate culture and strategy: the problem of strategic fit. Long Range Planning. Vol: 20, No: 4, 78-87. Stock, G.N., McFadden, K.L., and Gowen, C.R. III (2007). Organizational culture, critical success factors, and the reduction
of hospital errors. International Journal of Production Economics. Vol: 106, No: 2, 368-392.
Tripathi, S. and Tripathi, N (2009). Influence Strategies & Organizational Success: Moderating Effect of Organizational Culture. Indian Journal of Industrial Relations, Vol. 45, No. 2, 213-228.
Van der Post, W.Z., de Coning, T.J., and Smit, E.V. (1998). The relationship between organizational culture and financial performance: Some South African evidence. South African Journal of Business Management. Vol: 29, No: 1. 30-41.
Wilkins, A. L. and Ouchi, W. G. (1983). Efficient Cultures: Exploring the Relationship Between Culture and Organizational Performance. Administrative Science Quarterly, Vol. 28, No. 3, 468-481
Wilkinson, A., Redman, T., Snape, E., and Marchington, M. (1998). Managing with Total Quality Management – Theory and Practice. Macmillan Business, Basingstoke.