Original Research Article
Drinking water hygiene practices in caregivers of under 6 year
children: a cross sectional study in urban Lucknow, India
Manish Kumar Manar
1, Shivendra Kumar Singh
1, Prashant Kumar Bajpai
2*, Shikhar Singh
1INTRODUCTION
Water borne diseases are a major cause of childhood mortality and growth retardation. Most of the time, the caregivers of these small children are neither aware of the water borne diseases nor their severity. Knowledge and practices regarding the clean drinking water are required for the physical development of children. Worldwide, there is about 66.3 crore people have no access to clean drinking water. Children among these people are at risk of waterborne diseases. Many deaths among under five children are caused by water related diseases. More than
800 child deaths occur due to diseases caused by poor quality of drinking water, and a lack of sanitation each day.1
Providing access to basic drinking water service could not ensure the provision of safe drinking water. Diarrhoea causes more than 3.5 lac deaths every year among under five children. It is well known that contaminated water and poor sanitation causes the transmission of water borne infections like cholera and typhoid.2
Our country has the big challenge for the provision of safe drinking water to more than 70% of its population
ABSTRACT
Background: Safe drinking water is the basic necessity for humans. Due to water borne diseases, most of the children get malnourished. The present study was conducted to know about knowledge and practices on drinking water hygiene and to find the association between knowledge and drinking water hygiene practices among caregivers of under 6 year children.
Methods: It is a community-based cross-sectional study conducted in the field practice area of a medical college in urban Lucknow. We included 250 respondents in our study. The data were analyzed using Institutional SPSS-24.0 (IBM Corp., Chicago, USA).
Results: The present study showed that about 91.6 percent of study participants showedconcern about safe drinking water hygiene. About 90.8 percent of study participants thought that water container needs cleaning and about 95.6 percent thought that water container needs covering. Surprisingly 65.6 percent of the participants did not use any type of water purification method. People thought that they should use drinking water purification methods, but in reality, much less percentage (34.4%) of people in the study uses any type of purification method (p<0.001).
Conclusions: Although most of the participants showed their concern about safe drinking water hygiene, purification, etc., most of them still do not use any purification methods putting their children are at risk of many diseases.
Keywords: Practices, Drinking water, Hygiene, Caregivers, Urban 1
Department of Community Medicine and Public Health, King Georges Medical University, Lucknow, Uttar Pradesh, India
2
Department of Community Medicine, UPUMS, Saifai, Etawah, Uttar Pradesh, India
Received: 06 July 2018
Revised: 23 July 2018
Accepted: 24 July 2018
*Correspondence:
Dr. Prashant Kumar Bajpai,
E-mail: [email protected]
Copyright: © the author(s), publisher and licensee Medip Academy. This is an open-access article distributed under the terms of the Creative Commons Attribution Non-Commercial License, which permits unrestricted non-commercial use, distribution, and reproduction in any medium, provided the original work is properly cited.
which resides in the rural area. The improvements in the area of rural water supply in the country became a national priority during the mid-1980s. We have achieved a lot in the improvement of rural water supply. By the year 2011, about ninety five percent of the rural population of India’s had access to basic water supply. But the rural water supply systems were made by state agencies with a small participation from local communities.3
The U.N. announced the years 2005 to 2015 as the International Decade for Action ‘Water for Life’ and modified the drive to achieve the MDGs of reduction of the fifty percent of the global population who lack sustainable access to safe drinking water by the year 2015.4
Objectives of the present study were to assess the sociodemographic profile, knowledge and practices on drinking water hygiene and to find an association between knowledge and drinking water hygiene practices among caregivers of preschool (under 6 years of age) children in the field practice area of a Medical College, Lucknow.
METHODS
The study was conducted through July 2016- June 2017, in the field practice area of a medical college of Lucknow, Uttar Pradesh. Cross sectional descriptive study design was used. After obtaining informed consent, each study participant was administered a pretested semi-structured questionnaire eliciting their sociodemographic profile, knowledge and practices about drinking water hygiene.
Inclusion and exclusion criteria
We included one adult person (more than 18 years of age) per family of under 6 year children, at the time of a visit to the house living more than 6 months in the house in the study. We excluded persons with hearing defects and persons above 70 years of age.
Statistical analysis
Sample size calculation
The sample size of 250 for the study was determined using formula for sample size determination; Using the formulae n=z2 pq/d2 (Cochran, 1977).5 Where n=the desired sample size, d=degree of precision, z=confidence limits of survey results- set at 1.96 at 95% confidence level, p=estimated proportion of the target population to have documentation of findings and q=1–p. For this Study, p=0.149, the estimated proportion of the target population.6
Therefore the desired sample size was calculated as follows:
n = (1.96)2 (0.149) (0.851)/0.0025= 195
Taking consideration of data loss (10%) n=195 + (195×10/100); n=214.4. The final sample size was rounded off to 250 respondents.
Data analysis
Data was analyzed using Statistical Package for Social Scientists version 24.0 (SPSS-24.0, IBM Corp., Chicago, USA).7 The socio-economic status was assessced by using modified Kuppuswamy scale updated for year 2018.8 The socio-demographic characteristics and other variables related to knowledge about drinking water hygiene practices were presented as percentages. Differences between the two groups, i.e. knowledge and practices about drinking water hygiene were compared using the Chi-Square test and Fisher’s exact test. P<0.05 was considered statistically significant.
RESULTS
In the present study, Table 1 showed that in 58.8 percent houses more than one under 6 year child was present. The age of respondents was between 18-49 years in 71.2 percent and about 64.4 percent were female respondents. The Educational status of the head of the family was up to primary school in 34.8 percent of families while no respondent was professional. In this study, about half (51.6%) of the head of the family were doing Craft & Related Trade and a significant proportion (5.2%) were unemployed. Upper lower class family was seen in 93.6 percent and only 2.4 percent belonged to lower Social class.
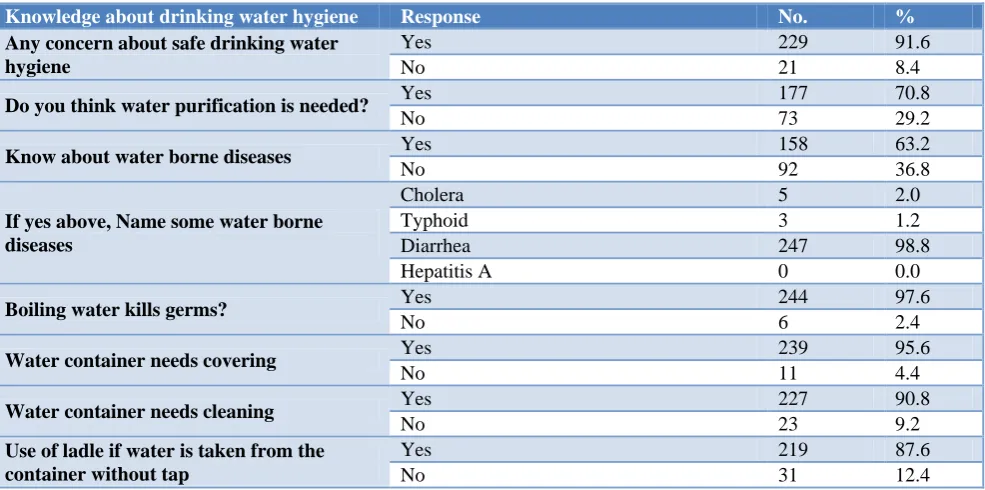
Table 2 showed that about 91.6 percent of respondents were concerned about safe drinking water hygiene in comparison to 8.4 percent who were not concerned and about 70.8 percent thought that water purification was needed. The respondents who know about waterborne diseases were only 63.2 percent. Diarrhea, cholera, and typhoid fever were heard in 98.8 percent, 2.0 percent, and 1.2 percent respondents respectively. Most of the respondents (97.6%) had knowledge that boiling water kills germs and only 2.4 percent were unaware. About 95.6 percent of respondents had knowledge that water container needs covering and 90.8% knew that water container needs cleaning. Most of the respondents (87.6%) had knowledge that ladles should be used if water is taken from the container without a tap.
Table 1: Distribution of study participants according to their socio-demographic characteristics (n=250).
Socio-demographic characteristics No. %
No. of under 6 year children in the house 1 103 41.2
More than 1 147 58.8
Age group of respondent 18-49 years 178 71.2
50-70 years 72 28.8
Gender respondent Male 89 35.6
Female 161 64.4
Educational status of head of family
Professional 0 0.0
Graduate 3 1.2
Intermediate or diploma 14 5.6
High school certificate 43 17.2
Middle school certificate 79 31.6
Primary school certificate 87 34.8
Illiterate 24 9.6
Occupation of head of family
Legislators, senior officials & managers 0 0.0
Professionals 0 0.0
Technicians and associate professionals 0 0.0
Clerks 0 0.0
Skilled workers and shop and market sales
workers 3 1.2
Skilled agricultural & fishery workers 0 0.0
Craft & related trade workers 129 51.6
Plant & machine operators and assemblers 46 18.4
Elementary occupation 59 23.6
Unemployed 13 5.2
Social class
Lower middle 10 4.0
Upper lower 234 93.6
Lower 6 2.4
Table 2: Distribution of study participants according to their knowledge about drinking water hygiene (n=250).
Knowledge about drinking water hygiene Response No. %
Any concern about safe drinking water hygiene
Yes 229 91.6
No 21 8.4
Do you think water purification is needed? Yes 177 70.8
No 73 29.2
Know about water borne diseases Yes 158 63.2
No 92 36.8
If yes above, Name some water borne diseases
Cholera 5 2.0
Typhoid 3 1.2
Diarrhea 247 98.8
Hepatitis A 0 0.0
Boiling water kills germs? Yes 244 97.6
No 6 2.4
Water container needs covering Yes 239 95.6
No 11 4.4
Water container needs cleaning Yes 227 90.8
No 23 9.2
Use of ladle if water is taken from the container without tap
Yes 219 87.6
Table 3: Distribution of study participants according to their practices on drinking water hygiene (n=250).
Response No. %
The container was clean Yes 238 95.2
No 12 4.8
The container was covered Yes 247 98.8
No 3 1.2
The ladle is used when the container is without tap
Yes 186 74.4
No 64 25.6
Method of purification of water
Boiling 3 1.2
Chlorination 0 0.0
Filter 83 33.2
No method 164 65.6
Table 4: Association of knowledge and practices about drinking water hygiene (n=250).
Water container needs cleaning
Chi square P value*
Yes No Total
The container was clean Yes 226 12 238 102.619 <0.001
No 1 11 12
Water container needs covering
The container was covered Yes 238 9 247 27.988 <0.001
No 1 2 3
Use of ladle if water is taken from the container without tap The ladle is used when the
container is without tap
Yes 172 14 186
15.884 <0.001
No 47 17 64
Do you think water purification is needed? Using any water purification
method
Yes 75 11 86
17.075 <0.001
No 102 62 164
*p<0.05 denotes significance.
Figure 1: Number of respondents using various water purification method (n=250).
Table 4 showed that a significant association was found between different variables of knowledge and practices about drinking water hygiene. Knowledge of clean container was significantly related to practice cleaning container (p<0.001). Similarly, knowledge regarding covered drinking water with the practice of covering the water container was found significant (p<0.001). The knowledge and the practice regarding the use of a ladle if water is taken from the container without tap were also found significantly associated (p<0.001). Surprisingly 177 (70.8%) of the respondents thought that drinking
water purification is needed, but only 73 (29.2%) in reality used any type of water purification method and it showed a significant association (p<0.001).
DISCUSSION
An important portion of the total burden of disease worldwide (about 10%) could be prevented by improving drinking-water, hygiene, sanitation, and water resource management. It may be an underestimate that the 9.1 percent of the disease burden which is because of unsafe water, inadequate sanitation or insufficient hygiene.9 Improvements in the quality of drinking-water appears to be of more significant benefit to the health when improvement is done near to the point of use i.e., in the household. Recently, studies have found increasing evidence that safe storage and household water treatment are associated with the significant health gains where the available water resources are contaminated.10
In our study, about 64.4 percent respondents were female, Francis et al in their study included 57.0 percent females while the rest were males.11 Other studies which were done by Kuberan et al, Mohd and Malik and Joshi et al included 71.0 percent, 68.1 percent and 73.0 percent female respondents respectively.12-14
0 20 40 60 80 100 120 140 160 180
Boiling Filter No Method
No
.
o
f
respo
ndents
Upper lower class family was seen in 93.6 percent and only 2.4 percent belonged to lower Social class. While in the study conducted by De and Taraphdar (who used modified B. G. Prasad scale 2014) included 21.33 percent as clas3, 35.33 percent as class 4 and 19.34 percent as class 5.15,16 A study done by Mohd and Malik in urban setting, taken upper lower 56.9 percent, lower middle 37.1 percent and upper middle 6.0 percent.13
Our study showed that about 91.6 percent of respondents were concerned about safe drinking water hygiene in comparison to 8.4 percent who were not concerned. A study done by Joshi et al. showed similar results, where 95.0 percent of the respondents were concerned that the quality of water affects human health.14 In the present study, the respondents who know about waterborne diseases were only 63.2 percent, which is in accordance with the study conducted by Kuberan et al that showed 71.0 percent of respondents know that water can affect health.12 In our study, diarrhea, cholera, and typhoid fever were heard in 98.8 percent, 2.0 percent, and 1.2 percent respondents respectively. About 95.6 percent of respondents had knowledge that water container needs covering. Similarly, in accordance with our study, a study done by Pachori et al showed that 96.3 percent of the respondents had knowledge about covering of water.17 A study done by Pachori et alshowed that 85.0 percent of respondents had knowledge about the cleaning of the container.17 The present study showed almost similar results, where 90.8 percent of respondents knew that water container needs cleaning. Most of the respondents (87.6%) in the present study had knowledge that ladles should be used if water is taken from the container without a tap. In our study, about 98.8 percent of respondents kept it covered. The study done by Pachori et al showed that in 94.7 percent of respondents, the container was found covered.17 These results are almost similar to the results found in our study.
In our study, the majority of the respondents (65.5%) were not using any method for water purification. A study conducted by De and Taraphdar showed that only 35.33 percent respondents use water purification method and not using any purification method were about 64.66 percent which was almost similar to our findings.15 Similar results were shown by studies conducted by A Kuberan et al and Mohd and Malik which showed 45.0 percent and 55.6 percent do not use any type of water purification methods respectively.12,13 The results of studies done by Joshi et al and Pachori et alfound that about 75 percent and 15.3 percent of respondents use nothing for water purification respectively showing some difference with the present study.14,17
Our study showed that use of the filter was seen in 33.2 percent, the results were in accordance with the study conducted by Mohd and Malik where 30.2% of the respondents used filtration of drinking water.13 The results of the present study showed discordance with the study done by Joshi et al. where 15.0 percent of
respondents found using filtration as a method of water purification.14
The present study showed that boiling of water was done only in 1.2 percent respondents. The studies conducted by Mohd and Malik and Joshi et alshowed that 14.1 percent and 10.0 percent of the respondents used boiling respectively, as a method of water purification.13,14 The results were almost similar to the present study. De D and Taraphdar and Pachori et alin their studies showed that a much higher percentage used boiling as a method of purification of water than the present study i.e., 47.17 percent and 45.3 percent respectively.15,17 Knowledge of clean container was significantly related to practice cleaning container (p<0.001). Similar findings were seen in a study done by Pachori et al.17 Our study showed that knowledge regarding covered drinking water with the practice of covering the water container was found significant (p<0.001). A study done by Pachori et alalso showed a significant relationship between the above variables.17 Surprisingly, in the present study 177 (70.8%) of the respondents thought that drinking water purification is needed, but only 73 (29.2%) in reality used some water purification method, and it showed a significant association (p<0.001).
CONCLUSION
The present study has shown that most of the respondents were concerned about drinking water hygiene and thought that purification of water is needed. About two third of the study participants knew about water borne diseases. Most of the respondents had knowledge that boiling kills microorganisms and water storage container needs cleaning and covering. Almost ninety percent of the respondents also knew that ladle should be used to take water out from the container. Although in most houses, we found that the container was clean and covered. But about one fourth of respondents were not using a ladle and about two third of the respondents were using no water purification method. So, our suggestion is to create a behavior change regarding the practices of safe and clean drinking water use.
Limitations
Present study has some limitations. We studied the caregivers of urban area rather than in both rural and urban communities. Hence, the study may not be the representative of the general population.
Funding: No funding sources Conflict of interest: None declared Ethical approval: Not required
REFERENCES
1. Water, Sanitation and Hygiene. UNICEF. 2018.
Available at: https://www.unicef.org/wash/.
2. 2.1 billion people lack safe drinking water at home, more than twice as many lack safe sanitation. World
Health Organization. 2018. Available at:
http://www.who.int/en/news-room/detail/12-07- 2017-2-1-billion-people-lack-safe-drinking-water- at-home-more-than-twice-as-many-lack-safe-sanitation. Accessed on 4 July 2018.
3. India: Bringing Clean Drinking Water to India’s Villages. World Bank. 2018. Available at: http://www.worldbank.org/en/results/2016/05/24/bri nging-clean-water-india-villages. Accessed on 4 July 2018.
4. Moe CL, Rheingans RD. Global challenges in water, sanitation and health. J Water Health. 2006;4(1):41–58.
5. Cochran WG. Sampling Techniques, 2nd Ed., New York: John Wiley and Sons, Inc., 1963.
6. Welcome to Official Web Site of Uttar Pradesh Government. Up.gov.in. 2018. Available at: http://up.gov.in/upstateglance.aspx. Accessed on 4 July 2018.
7. IBM Corp. Released. IBM SPSS Statistics for Windows, Version 24.0. Armonk, NY: IBM Corp., 2016.
8. Sheikh S. Modified Kuppuswamy scale updated for
year, 2018.
9. Apps.who.int. Available at: http://apps.who.int/ iris/bitstream/handle/10665/43840/9789241596435_ eng.pdf;jsessionid=545F7553FD4D2C8C847355C1 813CB1D4?sequence=1. Accessed on 4 July 2018. 10. Clasen T, Roberts I, Rabie T, Schmidt W,
Cairncross S. Interventions to improve water quality for preventing diarrhoea. Cochrane database Syst Rev. 2006;(3):CD004794.
11. Francis M, Nagarajan G, Sarkar R, Mohan V, Kang G, Balraj V. Perception of drinking water safety and
factors influencing acceptance and sustainability of a water quality intervention in rural southern India. BMC Public Health. 2015;15(1):731.
12. Surapaneni K, Kuberan A, Singh A, Kasav J, Prasad S, Upadhyay V, et al. Water and sanitation hygiene knowledge, attitude, and practices among household members living in rural setting of India. J Natural Sci Biol Med. 2015;6(3):69.
13. Mohd R, Malik I. Sanitation and Hygiene
Knowledge, Attitude and Practices in Urban Setting
of Bangalore: A Cross-Sectional Study. J
Community Med Health Edu. 2017;7(4):540. 14. Joshi A, Prasad S, Kasav J, Segan M, Singh A.
Water and Sanitation Hygiene Knowledge Attitude Practice in Urban Slum Settings. Global J Health Sci. 2013;6(2):23-34.
15. De D, Taraphdar D. A Study on Water Sanitation Hygiene & Hand Washing Practices among Mothers Of Under 5 Children Attending Tertiary Care Hospital In Kolkata, India. IOSR J Dent Med Sci. 2016;15(7):54-9.
16. Mangal A, Kumar V, Panesar S, Talwar R, Raut D, Singh S. Updated BG Prasad Socioeconomic Classification, 2014: A Commentary. Indian J Public Health. 2015;59(1):42 -4.
17. Pachori R. Drinking water and sanitation: household survey for knowledge and practice in rural area, Magudanchavadi, Salem district, India. Int J Community Med Public Health. 2016;3:1820-8.