Modeling and Optimization of Nano-bubble Generation
Process Using Response Surface Methodology
R. Ahmadi
*1, A. Khodadadi Darban
21- Mineral Processing Department, Faculty of Engineering, Tarbiat Modares University, Tehran, I. R. Iran
2- Civil- Environmental Engineering, Mineral Processing Department, Faculty of Engineering, Tarbiat
Modares University, Tehran, I. R. Iran
(*) Corresponding author: [email protected]
(Received:21 May 2013 and Accepted: 17 Aug. 2013)
Abstract:
In this paper, size distribution of nano-bubbles was measured by the reliable and fast method of laser diffraction technique. Nano-bubbles were produced using a nano-bubble generator designed and made based on hydrodynamic cavitation phenomenon in Venturi tubes. A Central Composite Design with Response Surface Methodology was used to conduct a five factor, five level factorial experimental design on the main process variables including frother concentration, solution temperature, pH, air flow rate and pressure drop in the cavitation tube nozzle. The statistical analysis used to develop a model for predicting the median size of nanobubbles (D50) showed that the frother concentration, solution temperature and air flow rate have the highest effect on the size of nanobubbles. Results demonstrated that with increasing the frother concentration and the air flow rate, the median nanobubble size (D50) decreased. The results also indicated that an addition of 20~ 40°C temperature, increased the median size of the nanobubbles formed in the solution. In the optimum condition, the frother concentration, solution temperature and air flow rate were found to be 69.5 mg/h-1, 20°C and 0.3 Lmin-1, respectively. In this study, the minimum median size of the nanobubbles produced in the laboratory and predicted by the prediction model was 130.75 and 129.83 nm, respectively, which showed that the model results properly fitted with experimental results.
Keywords: Nanobubbles, Hydrodynamic cavitation, Laser diffraction technique, Response surface
methodology.
Int. J. Nanosci. Nanotechnol., Vol. 9, No. 3, Sep. 2013, pp. 151-162
1. INTRODUCTION
Based on such characteristics of tiny (nano and micro) bubbles as charge, lower buoyancy and longer existence in water, nano and micro-bubbles
have potential applications in a number of fields,
and a great deal of research on nano-bubbles has been conducted in recent years [1].
Micro and nano-bubble technologies have attracted great attention due to their wide application range
in science and industry, such as mining industries, water treatment processes, biomedical engineering, food processing and nanomaterial industries [2]. In mining industries, nano-bubbles can be used in the
flotation process to effectively increase the process
performance.
Nano-bubbles generated by hydrodynamic cavitation have been found to increase the contact angle of solids and as a result the attachment
minimize slime coating, remove oxidation layers on particle surfaces and consequently reduce reagents consumption [3].
There are several ways to produce nano and micro-bubbles, including the use of venturi tube cavitation, pressure discharges, ultrasonic waves and swirl
flows [4].
In a number of recent researches, the use of micro-bubbles generated by venturi tube appears to be advantageous because this method is cost-effective, has a simple design and is capable of generating very small bubbles, providing for high performance [4]. Recent developments and understanding of cavitation and gas nucleation phenomena have
provided a scientific basis for cost-effective application of hydrodynamic cavitation to flotation
operations.
Considering the fact that bubble size plays a vital
role in flotation, designing a nano-bubble generator
capable of controlling the bubble size by changing process factors is of utmost importance. Therefore, in this study, a Nano-Bubble Generating System (NBGS) based on hydrodynamic cavitation in venturi tubes was designed and produced. This system is capable of large scale continuous generation of nano-bubbles.
For relatively large bubbles, size measurement is possible by image processing using an optical microscope and video camera, X-ray attenuation,
laser based techniques, fluid dynamics based
empirical or semi empirical correlations (including the Stokes’ Law), electro resistivity and image analysis [5-6].However, for bubbles to reach
diameter of up to a few μm, which is the focus of
great attention these days, measurement using an optical microscope and video camera is extremely
difficult. Image analysis has been reported as the
most widely used method; however, it has some disadvantages like requiring transparent walls for image acquisition, low bubble concentration and complicated experimental set-up. It is also time-consuming despite modern high-speed CCD cameras [7-8].
In this study, laser diffraction technique was used to measure the size of nano-bubbles. The laser
diffraction technique is classified as non-destructive
and non-intrusive, and relies on the fact that laser
diffraction angle is inversely proportional to particle size. Laser diffraction-based size distribution can be assessed in seconds, and a complete analysis runs in less than 1 min [9-10]. Laser diffraction results are calculated as the volume-equivalent spherical diameter (ESD).
In this method, Mei’s or Fraunhofer’s theory is used to perform calculations. Mie’s theory is more
convenient and accurate for measuring fine particles
[11-12]. The laser diffraction method has only been used to measure solid particles, colloidal particles and emulsions [13].
This work presents a new methodology for characterization of nano-bubble size in the specially designed NBGS by the laser diffraction technique. The availability of fast and reliable measurements of bubble size distribution enabled optimization of the nano-bubble generation process using Response Surface Methodology (RSM).
2. MATERIALS AND METHODS
2.1. Reagents
Methyl Isobutyl Carbinol (MIBC, MW=102.2 g/ mol) from Sigma-Aldrich was used as frother. Double distilled water, which was passed through Barnstead Easy pure UV-Compact ultrapure water system (18.3), was used to prepare the stock solutions.
2.2. Dissolved oxygen concentration and pH analysis
The dissolved oxygen concentration and pH were both determined at 22°C, using a dissolved oxygen meter (SG6, Mettler-Toledo GmbH) and a pH meter (MP230, Mettler-Toledo GmbH), respectively. Hydrochloric acid (HCl) and sodium hydroxide (NaOH), both obtained from Merck, were used to adjust the pH of the solutions.
2.3. Zeta potential measurement
2.4. Surface tension measurements
A Du Nouy Ring Tensiometer (Lauda model TD1-C) was used to measure the surface tension of aqueous solutions with varying frother concentration at 22± 1°C. The surface tension measurements involved preparation of a frother solution, which was stirred in a 16 l tank for 5 minutes before the measurements. Each measurement was replicated three times, and an averaged value was reported.
2.5. Generation and size measurement of nano-bubbles
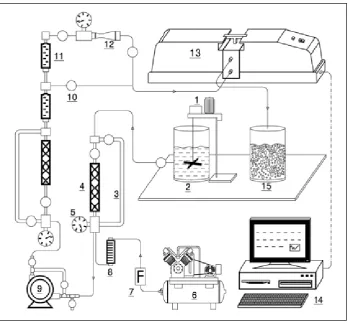
Nano-bubbles were produced using double distilled pure water in a nano-bubble generator designed and made based on hydrodynamic cavitation
phenomenon in venturi tubes (Figure 1). The solution prepared at pH=7 with a given concentration of frother (tank 2 in Figure 1) was pumped through a centrifugal pump (PM80, Pentax) into a venturi tube
with specified geometric dimensions. The pump
was free of leaks, and it was corrosion resistant. The gas used to produce nano-bubbles was air.
The air (after passing through the air filter) was
injected into the solution upstream of the pump with
a flow rate range of 0.1 to 0.3 Lmin-1. To increase
the solubility of air, two static mixers were installed on either side of the pump. Dissolution of air in the inlet of venturi tube was increased because of high static pressure (0.3 to 0.35 kPa). When the air-saturated solution reached the tip of venturi tube,
1-Agitator, 2-Conditioning tank, 3-Bypass, 4- Static mixer, 5-Pressure gauge, 6-Air compressor, 7-Air filter, 8- Air flow meter, 9- Pump, 10- Valve, 11- Water flow meter,
12- Cavitation tube, 13- Laser analyzer, 14- Computer, 15- Nano-bubble tank
Figure 1: Schematic diagram of Nano-bubble Generator System and Laser Particle Size
depressurization of the air-saturated water led to nano-bubble nucleation.
Before each measurement, 15ml of the solution prepared in tank 2 was gently injected into Laser Particle Size Analyzer (LPSA) 2000MS instrument (Malvern Company) cell using a 20 ml syringe to measure the background, and was left for thermal equilibrium. The instrument was automatically set so that the incident path of the laser was aligned with the optical arrays.
The cleanliness of the system was then checked, and a background was taken. This background information was subtracted from the sample measurement in order to clean the data. Immediately after measuring the background, nano-bubble generating device was started, and after 1 min stable state of nano-bubble production, the solution containing nano-bubble was directly transferred to LPSA instrument from the venturi
tube with a flow rate of 1.86 l.min-1 to measure the
size of nano-bubbles.
The measurements were performed based on Mie’s theory and refractive index of 1.0 for air nano-bubbles and 1.33 for water. Size measurements were conducted at 22ºC, and repeated at least 3 times for each individual sample. Each measurement was performed within 10 seconds.
D50, which represents the average dimension (50% by volume of the bubbles are smaller than this size), was used as instrument output to determine the nano-bubble size. After measuring the size distribution, the solution containing nano-bubbles was decanted into a storage tank (tank 15 in Figure 1).
2.6. Central Composite Design (CCD)
Central Composite, Box–Behnken and Doehlert designs are among the principal response surface methodologies used in the engineering design of experiments. The Central Composite Design (CCD), which is the most popular method, consists of the following steps: (1) a full factorial or fractional factorial design; (2) an additional design, often a star design in which experimental points are at a distance from its center, and (3) a central point [14–16].
Using these levels, enough information could be
generated to fit a second-order polynomial called
“quadratic”. In order to determine a critical point (maximum, minimum, or saddle), it is necessary for the polynomial function to contain quadratic terms according to the following equation:
where k, β0, βi, xi, βii, βij and represent the number
of variables, constant term, coefficient of the linear parameters, variables, coefficients of the quadratic parameters, coefficients of the interaction
parameters and residual associated with the experiments, respectively [18].
In this study, a five-factor five-level CCD was
used for nano-bubble generation tests using the Design-Expert software to optimize process parameters including frother concentration, solution
temperature, pH value, air flow rate, and the pressure
drop in the cavitation tube nozzle.
3. RESULTS AND DISCUSSION
3.1. Reproducibility of the nano-bubbles size measurements
To check the reproducibility of measurements, under the same conditions, mean size of a sample containing nano-bubble solution was measured
5 times. The coefficient of variation for these
measurements was obtained at 1.3%.
According to ISO13320 (2009) standard, for reproducibility of the measurements, the
coefficient of variation up to 3% is acceptable
for particles larger than 10 µm. Therefore,
according to the coefficient of variation obtained,
the measurement results are reliable. Under this standard, for particles below 10 microns,
coefficient of variation can be doubled. In addition,
the range of weighted residuals corresponding to different measurements was determined between 0.37% and 0.75%. Residual value represents
the fit of calculated values with measured ones. Residual value less than 1% indicated good fit.
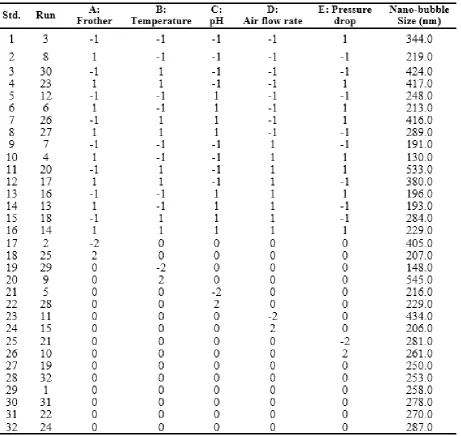
Table 2: Response values for different experimental conditions
3.2. Nano-bubble generation tests
The levels of selected control factors including frother concentration, solution temperature, pH value, air flow rate and pressure drop in venturi tube are shown in Table 1. Each factor varied in five levels, whereas the other operational parameters of flotation were kept constant. A total of 32 runs of the CCD tests shown in Table 2 were performed to search for the effect of five process variables on the median size of nano-bubbles (D50). Each measurement was repeated two times, and thus the values of D50 given in Table 2 represent the averages of two sets of experiments.
3.3. Model development
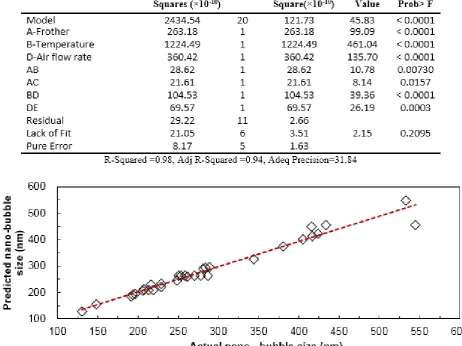
3.3.1. Analysis of variance (ANOVA)
Table 3 shows the analysis of variance (ANOVA) of regression parameters of the predicted response surface quadratic model for the median size of nano-bubbles. As can be seen from this Table, F-value of 45.83 and a low probability value (<0.0001) of
the model indicate its significance. Values of “Prob
> F” less than 0.05 indicate that model terms are
significant [18].
3.3.2. Diagnostic plots
Figure 2 shows the nano-bubble size predicted by the model versus actual nano-bubble size measured
Table3: ANOVA for analysis of variance and adequacy of the quadratic model
in the experiments. The value of correlation
coefficient (R2) obtained in the present study for
nano-bubble size was 0.98, indicating that only 2% of the total dissimilarity might not be explained by the empirical model.
Based on the results, the response surface model constructed in this study for predicting the median nano-bubbles size (D50) was considered to be reasonable. Empirical model was developed using process variables in terms of their coded factors, which is expressed in Equation 2.
Perturbation plot (Figure 3) shows the comparative effects of all independent variables on micro and nano-bubble size. In Figure 3, a sharp curvature in frother concentration (A), solution temperature
(B) and air flow rate (D) indicates that the response
nano-bubble size is very sensitive to these three process variables.
Figure 3: Perturbation plot for nano-bubble
generating process
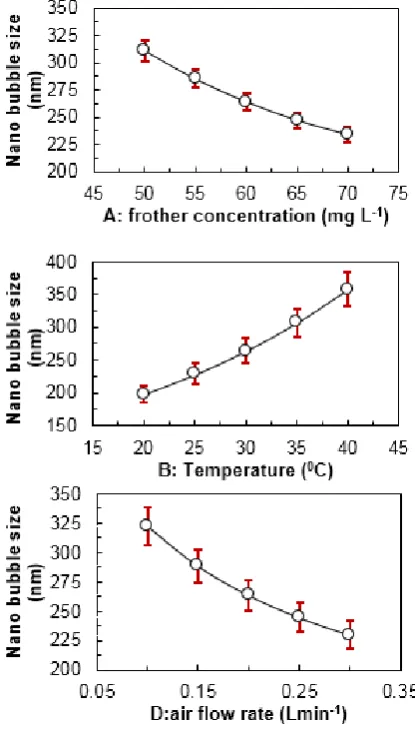
3.3.3. Effect of process variables on nano-bubble size The main effects of variables on response are
presented in Figure 4. According to Figure, with increasing temperature from 20 to 40 °C, the average size of nanobubbles increased from 200 nm to about 350 nm. Increasing concentration of frother from 50 to 70 mg L-1 reduced the average
size of nanobubbles from about 312 nm to 225 nm. Moreover, increasing the aeration rate from 0.1 to 0.3 Lmin-1 reduced the average size of nanobubbles
from 325 nm to 225 nm.
Figure 4: The main effects of variables on responses
parameters. According to the model, interactions
between variables also had significant effects
on responses and therefore the results have been presented and discussed in terms of interactions. These results have been reached in the mean point of other parameters.
Figure 5 indicates that at the high level of frother concentration, the median size of the nano-bubbles decreased. This is similar to the role of frother
in large bubbles in conventional flotation. With
increasing concentration of MIBC from 50 to 70 mg L-1 at 30oC, the median nano-bubble size decreased
from 311nm to 234 nm. Fundamentally, the role of frother can be understood by the Laplace -Young equation:
(3)
where P1, P2 and r are the pressure inside the bubble, the pressure outside the bubble and the radius of the bubble, respectively.
Figure 6 shows that with increasing the frother concentration, the surface tension of the bubble/ water interface decreased. Therefore, considering
the Laplace-Young equation, production of finer
bubbles at a high frother concentration can be related to reduction in surface tension by the frother. Even though frother and surfactant are known to reduce surface tension, their effect on bubble size and stability does not seem to be directly relevant [19-21].
The response surface suggests that the highest nano-bubble size was attained at the low level of frother concentration and high level of the temperature. Temperature is known to play an important role in
changing the dissolved gas content, fluid viscosity
and density of an aqueous solution. All these changes could have a considerable impact on bubble generation by hydrodynamic cavitation.
A change in temperature could also affect coalescence of the generated bubbles, which is also critical for generation of submicron size bubbles. Figure 5 also depicts that the median nano-bubble size increases with increase in temperature. This fact, which was also observed by Yang et al. [22], might be a result of coalescence of nano-bubbles with close proximity. Moreover, studies by Zhang et
al. [23] showed that the lateral size of nano-bubble increased when the temperature rose from 28 to 37° C. The main reason for the change of nano-bubble size might be due to the temperature dependence of gas solubility in water [24-26].
Measuring the oxygen dissolved (DO) in the solution showed that when temperature rose from 20°C to 40°C, the amount of oxygen dissolved in the solution was reduced from 10.5 mgL-1 to 2.5
mgL-1. Reducing dissolved oxygen concentration
increases the concentration gradient of gas in water and bubble interface.
Design-Expert® Software Original Scale (D(50))^-1.58
545 130 X1 = A: Frother X2 = B: Tempreture Actual Factors C: pH = 7.00 D: Air flow rate = 0.20 E: Pressure drop = 340.00
50 55
60 65
70
20 25 30 35 40 140 218 295 373 450
D
(5
0
)
A: Frother B: Tempreture
Figure 5: Nano-bubble size as a function of frother
concentration (mg L-1) and temperature (°C)
Figure 6: Variations of surface tension with
pH: 7.0, T=22 (°C)
At high temperatures, the oxygen in nano-bubbles is dissolved in water and is then released into the atmosphere. This reduces the internal pressure of nano-bubbles, and ultimately destroys them. With decreasing concentration of nano-bubbles, the ability of the device to record the size of this size range is reduced. Thus, the device can only measure the larger bubbles.
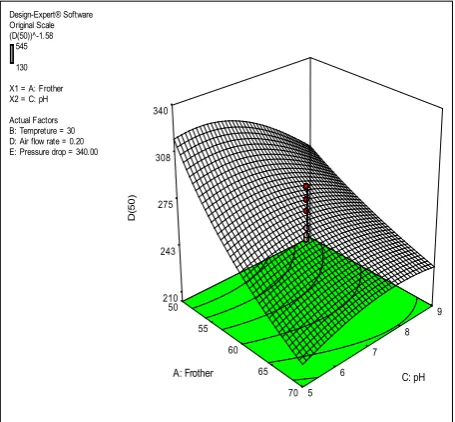
Figure 7 depicts the influence of pH and frother
concentration on the median size of nano-bubbles. Results indicated that the frother concentration had
a more significant effect on the nano-bubble size
at low level of the pH than high level of it. This is probably because the coalescence tendency of nano-bubbles decreases with rising pH value. Figure 8 shows the zeta-potential of nano-bubbles in aqueous solutions of different pHs. The
nano-bubbles were sufficiently stable with no significant
change of zeta-potential during the measurements. At low pH, the zeta potential was positive, but changed its sign at high pH. The point of zero zeta-potential (isoelectric point) was between pH 3.0 and 3.5. Design-Expert® Software Original Scale (D(50))^-1.58 545 130 X1 = A: Frother X2 = C: pH Actual Factors B: Tempreture = 30 D: Air flow rate = 0.20 E: Pressure drop = 340.00
50 55
60 65
70 5 6 7 8 9 210 243 275 308 340 D (5 0)
A: Frother C: pH
Figure7 : Nano-bubble size as a function of frother
concentration and pH
According to this Figure, the absolute value of zeta potential in this period increased from about 9 mV at pH=5 to about 27mV at pH=9. It is well
recog-nized that the electrokinetic property of interface
could be modified because of adsorption of anions
(OH−) and desorption of cations (H+). For pH values
greater than 6, zeta-potential value dropped to
be-low −20mV because of the adsorption of OH− ions.
Electrically charged particles in colloidal systems tend to repel each other in high zeta potential values. In the case of bubble dispersion, high zeta poten-tial of bubbles generates repulsive forces, prevent-ing bubble coalescence and allowprevent-ing for increased bubble stability. Therefore, increase in average size of nano-micro bubbles can be related to their co-alescence due to reducing surface zeta potential at a low level of pH.
Figure 8: Zeta potential of the nano-bubbles as a
function of pH
The effect of aeration rate and temperature on bubble size is shown graphically in Figure 9. As can be seen in this Figure, nano-bubble size decreased with rising aeration rate. The change in nano -bubble size with aeration rate was in accordance with the change in dissolved oxygen concentration. When aeration rate was increased from 0.1 to 0.3 1, the dissolved oxygen concentration in water rose .from 4 mg L-1 to approximately 10 mg L-1
The high level of dissolved oxygen concentration could keep a small gradient concentration of air between the nano-bubble interface and the bulk liquid, maintaining the bubbles stable, at a density high enough to be detected by the laser scattering sensor. Moreover, according to Figure 9, the highest nano-bubble size was attained at high level of
.temperature and low level of aeration rate
Figure 10 shows the influence of aeration rate and
It can be seen from the response surface of the nano-bubble size shown in Figure 10 that rising aeration rate (0.1~0.3 Lmin-1) had a slight effect on
the nano-bubble size at the low level of the pressure drop. However, at the high level of pressure drop,
increasing air flow rate significantly reduced the
nano-bubble size. Design-Expert® Software Original Scale (D(50))^-1.58 545 130
X1 = D: Air flow rate X2 = B: Tempreture
Actual Factors A: Frother = 60.00 C: pH = 7 E: Pressure drop = 340.00
0.10 0.15 0.20 0.25 0.30 20 25 30 35 40 140 210 280 350 420 D (5 0 )
D: Air flow rate B: Tempreture
Figure 9: Nano-bubble size as a function of
aeration rate and temperature
A certain saturation pressure is needed to generate a suitable amount of bubbles. More bubbles are usually generated at higher saturation
.pressures
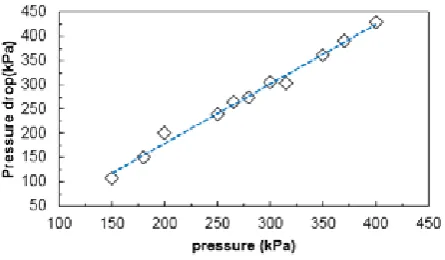
A linear relationship was obtained between the static pressure within the up-stream and absolute drop pressure at the tip of venturi tube (Figure 11). By increasing the up-stream pressure, the pressure drop within the tip of the venturi tube was enhanced. High pressure in up-stream of the venturi tube led to more dissolved air in the water. High air-saturated water generated smaller nano-bubbles.
Zhou et al. [27] demonstrated that higher saturation pressures (i.e., higher dissolved gas content in solution) would guarantee the production of more micro-bubbles and higher gas holdups. This observation indicates that the generation and stabilization of micro-bubbles are controlled by diffusion of dissolved gas molecules into
micro-bubbles. To prevent or minimize the immediate collapse of cavity bubbles generated by hydrodynamic cavitation ,at least a certain amount of dissolved gas should be present in water.
Design-Expert® Software Original Scale (D(50))^-1.58
545
130
X1 = D: Air flow rate X2 = E: Pressure drop
Actual Factors A: Frother = 60.00 B: Tempreture = 30.00 C: pH = 7.00
0.10 0.15 0.20 0.25 0.30 300 320 340 360 380 200 243 285 328 370 D (5 0)
D: Air flow rate E: Pressure drop
Figure10 : Nano-bubble size as a function of air
flow rate and pressure drop
Figure11: Variation of the pressure drop within the
tip with up-stream pressure in the venturi tube
3.3.4. Optimization of operational conditions Optimization process was carried out to determine the optimum value of nano-bubble size using the Design Expert v.7 software. According to the software optimization step, the desired goal for each operating condition was chosen “within the range”, while the response variable (median size of
nano-bubbles) was defined as “minimum” to achieve the
highest performance. The minimum nano-bubble size was predicted according to the model at a low
370
328
285
243
level of temperature (20°C) and pH (5) and high
levels of the frother concentration (, air flow rate
(0.3 Lmin-1) and pressure drop (380kPa) in the
venturi tube. The median size of nano-bubbles from the laboratory experiment was 130.75 nm, which is in agreement with the predicted response value (129.83nm).
4. CONCLUSIONS
In this study, a new Nano-bubble Generating System (NBGS) based on hydrodynamic cavitation phenomena was used to produce nano-bubbles in laboratory scale. The nano-bubble size distribution was measured by the laser diffraction technique. The measured size of nano-bubbles was in the range of 130–545 nm.
A five-factor five level Central Composite
Design (CCD) combined with response surface methodology (RSM) was employed to model and
optimize five operation parameters of the
nano-bubbles generation process. The variables studied were frother concentration, temperature, pH value, aeration rate and pressure drop. A quadratic model was obtained by statistical analysis of the experimental data, which can precisely predict the nano-bubble size. Predicted values obtained using the model equations were in very good agreement with the observed values (See Figure 3; R2 value
of 0.98). Some of the most important conclusions derived from optimization studies are as follows:
• Frother concentration, solution temperature and aeration rate were the factors with the most
statistically significant effect on nanobubbles size.
• Frother was found to reduce the nano-bubble size by lowering the surface tension of the aqueous phase and protecting the generated nano-bubbles from coalescence. This is similar to its effect on large bubbles.
• The median nano-bubble size increased with rising temperature. Temperature is known to play an important role in changing the dissolved gas content of an aqueous solution. A change in temperature could also affect coalescence of the generated bubbles, which is also critical to the generation of submicron size bubbles.
• The average diameter of the nano-bubbles
decreased when the air flow rate was increased
from 0.1 to 0.3 Lmin-1. The reduced size of
nano-bubbles with increasing aeration rate was attributed to the increased gas content in
solution with rising air flow rate.
• Results showed that frother concentration had a
more significant effect on the nano-bubble size
at lower levels of the temperature and pH than at high levels of them.
5. ACKNOWLEDGEMENT
The authors wish to acknowledge the Tarbiat Modares University (TMU), the Iran Mineral Processing Research Center (IMPRC) and the
IMIDRO for the technical assistance and financial
support.
REFERENCES
1. Sato, K.: Rec. Pat. Mecha. Eng., Vol. 4, No. 3,
(2011), pp.202-211.
2. Agarwal, A., Ng WJ and Liu Y. : Chemosphere, Vol.
84, No. 9, (2011), pp.1175-80.
3. Zhou, Z. A., Xu Zhenghe, Finch, J. A., Masliyah,
J. H. and Chow, R.S.:Miner. Eng., Vol. 22, (2009), pp. 419–433.
4. Ohnari, H., Fine-bubble generator, US6382601. (2002).
5. Rodrigues, R. T. and Rubio, J.: Miner. Eng., Vol. 16, No. 8, (2003), pp. 757–765.
6. Caicedo, G. R., Prieto, J. J., Garcia Ruiz, M. M. and Soler, J. G., :Chem. Eng. Process., Vol. 2, No. 1, (2003), pp. 9–14.
7. Zhou, Z. A., Egiebor, N. O.and Plitt, L. R.: Miner. Eng., Vol.6, No. 1, (1993), pp. 55–67
8. Han, M. Y., Park, Y. H., Yu, T. J.: Water Supply, Vol. 2, No.2, (2002), pp.77–83.
9. Rawle, A.: Adv. Color. Sci. Technol., Vol.5, No. 1, (2002), pp. 1–12.
10. Xu, R., Particle Technology Series, Kluwer
Academic Publishers, Vol.13, (2002), p. 397.
12. Edzwald, J. K.: Water Sci. Technol., Vol. 31, No.3– 4, (1995), pp. 1–23.
13. ISO 13320-1, Particle Size Analysis- Laser
diffraction methods: Part 1, General Principals. (1999).
14. Montgomery, D. C., New York, John Wiley & Sons. (2001).
15. R.H. Myers, D.C. Montgomery, New York, John
Wiley & Sons.(2002).
16. M.J. Anderson, P.J. Whitcomb, DOE simplified: Practical tools for effective experimentation, Productivity Inc., (2000).
17. Operations guide, Malvern Instruments Ltd.,
Appendix A, page: A.1., United Kingdom, (1998-1999).
18. Korbahti B.K., Tanyolac, A: J. Hazard. Mater., Vol. 151, (2008), pp. 422–431.
19. Finch, J. A., Nesset, J. Eand Acuña, C.: Miner. Eng., Vol. 21, (2008), pp. 949-957.
20. C. Aldrich e D. Feng: Miner. Eng., Vol.13, No.10-11, (2000), pp. 1049-1057.
21. Grau, R.A. and Laskowski, J.S.:Can. J. Chem. Eng., Vol. 84, (2006), pp. 170-182.
22. Yang, S., Dammer, S. M., Bremond, N., Zandvliet,
H. J. W., Kooij, E. S. and Lohse, D., : Langmuir, Vol.23, (2007), pp.7072-7077.
23. Z. Xue Hue, L. Gang, W. Zhi-Hua, Z. Xio- Dong
and H. Jun, :Chin. Phys., Vol.14, Vol.9, (2005), pp. 1774-1778.
24. Dean J A, New York, McGraw-Hill. (1973).
25. Pollack G L, Science. Vol. 251, No. 4999, (1991), pp. 1323-1330.
26. S. Garde, A. E. García, L. R. Pratt, and G. Hummer: Biophys. Chem., Vol. 78, (1999), pp. 21-32.
27. Zhou, Z. A., Xu, Zhenghe and Finch, J.A. (1995).