The uptake and usage of a national higher education
libraries statistics database in South Africa
Elisha Chiware
1and Deborah Becker
2[email protected] ORCID: orcid.org/0000-0002-8375-9156
[email protected] ORCID: orcid.org/0000-0001-9974-8622
Received: 5 March 2015 Accepted: 22 June 2015
This article discusses a preliminary study into the uptake and usage of collective statistics in South Africa with valuable lessons for other African countries and the developing world. It presents the results of a survey conducted among twenty-three South African universities that are members of The Committee of Higher Education Libraries of South Africa (CHELSA), the sponsor of the shared platform for the storage and sharing of library statistics. The purpose of the study was to investigate the extent to which the community of users understands the uses of collected statistics and how it interprets them, as well as how far these interpretations are being used for internal and external management purposes and for advocacy at institutional level. The results of the survey show that there is consensus amongst academic libraries in South Africa that statistics should be collected and made available nationally for various purposes. The survey also shows that the majority of university libraries in the country have started using the shared statistics database platform and that there is room for further development.
Keywords: South Africa, academic libraries, CHELSA, library statistics, statistics database
1 Introduction
The cooperative collection of library statistics within national boundaries among academic and research libraries has been a long-standing tradition in many western countries such as Australia, Canada, the Netherlands, Sweden, the United Kingdom, the United States of America (USA), in some countries in south-east Asia and in parts of Latin America and dates back as far as the 1800s. Such cooperative efforts provide users of the information with sets of data that are essential for the strategic planning, decision making and operational management of the library as well as the general improvement of library services. They are also an important source of information for library advocacy at institutional level, for inter-institutional benchmarking, when library leaders need to make the case for more resources, and when identifying gaps in collections (Mundt 2004).
The International Federation of Library Associations (IFLA) has been promoting the collection and use of library statistics in all types of libraries through its IFLA Library Statistics Manifesto. In 2008, through its then-president, Claudia Lux, at the IFLA Statistics and Evaluation Section conference in Montreal, the manifesto was launched. The idea behind the manifesto was “to have a certified document about the importance of library statistics, as they demonstrate the value that libraries provide to their users and to society” (IFLA Section on Statistics and Evaluation 2008). The manifesto states that:
statistical data are indispensable for the internal management of libraries, but they can do more. When presented to policy makers, funding institutions or the general public, they will influence the strategic planning, and they can create and maintain confidence in libraries (IFLA Section on Statistics and Evaluation 2008).
Efforts to create ‘global statistics’ indicators date back to 2005 when the same IFLA Section on Statistics and Evaluation, together with UNESCO and the International Organisation for Standardisation (ISO), set out to establish these indicators allowing for the comparison of library statistics in countries across the world (Heaney 2009).
There is no record of a shared collection of library statistics in African countries (Chiware & Mbambo-Thata 2009), with the exception of South Africa, where efforts were undertaken prior to 2004 through the South African Post-Secondary Education Information System (SAPSE). SAPSE was established in 1978 to collect standardized sets of unambiguous data on all aspects of South African universities on an annual basis with library statistics forming a small part of the process. Compliance was not consistent at some of the institutions (De Jager 2007). Work is now in progress to develop and sustain a national library database for university libraries for The Committee of Higher Education Libraries of South Africa (CHELSA). The current uptake and usage of a recently-developed statistics database is the subject of this paper.
2 Literature review
The use of library statistics in academic libraries is essential to demonstrate value to the institution, especially in presenting budget plans and facilitating resource allocation. Statistics further assist in publicising the role of libraries (Mundt 2004) and show levels of operation. They also give an indication for areas that need further improvement. Usage statistics are crucial for librarians’ daily work (Boukacem-Zeghmouri & Schopfel 2012), although they alone do not represent value (Wiegand 2013). Mundt (2004: 107) points out that:
statistical needs have two perspectives and that is at national or international level (to demonstrate input and output factors to external stakeholders) and an internal management perspective (for resource planning and spending, or staffing, for example).
In order to achieve these statistical needs Mundt (2004:107) further asserts that “there is need for statistical data standardization in terminology, classification, attributes, products, processes or systems, methods of measurement or testing”.
Collective data collection and use are being practiced in both academic and public libraries worldwide. Liu (2001:193) provides a comparative view of the use of library statistics in public libraries by library directors in China and in the USA. The conclusion of the study shows wide use of statistics for various purposes. Economic and cultural backgrounds also determined the degree and extent of library statistics use. Characteristics of statistical programmes – statistical reporting time, statistical presentation, data element comprehensiveness, data manipulation and data accessibility (Liu 2001) – also determined their usage. Poll (2007) gives an international perspective on the effectiveness of benchmarking with quality indicators through various national projects. As indicated by Liu (2001), Poll (2007) also shows that indicators for benchmarking differ between libraries and countries.
In Germany, the Deutsche Bibliotheksstatistik (DBS, or German Library Statistics) has been reporting on library statistics since 1974. The DBS (2014) reports that “around 9,000 libraries (both public and academic libraries) file data on facilities, equipment, holdings, usage, budget and staff”. It further states that “data collection, evaluation, and presentation today are carried out online only and that its aim is the formation of a national data pool containing statistical data on all types of libraries” (DBS 2014). The Association of Research Libraries (ARL) in the USA has been collecting and publishing statistical data for its members since 1961/62. Before then, James Gerould collected annual library statistics, now called the Gerould Statistics, covering the period 1907/8 to 1961/62. Today, the ARL Statistics forms a collection of annual publications covering collections, expenditures, staffing, and service activities for member libraries (Kyrillidou 2001; ARL 2013). In Australia and New Zealand, the Council of Australian University Librarians (CAUL) agreed in 2004 to the development of an online statistics website for member libraries. This site is modelled on the ARL online statistics site (Jilovsky 2009) and to date remains the main source of statistics for academic libraries in the region. Jilovsky (2011) reports on a pilot project (The Asian Online Statistics Pilot Project) for the benchmarking of library statistics for twenty-two Asian academic libraries (in Hong Kong, Malaysia, Singapore and Thailand). The project, which was managed by CAVAL, an Australian library consortium, had several positive outcomes. Most importantly, “it provided library staff from participating institutions with practical experiences and awareness of the need for a critical mass of centralised data in order to begin benchmarking” in their region and countries (Jilovsky 2011). In Latin America, efforts in countries like Argentina, at the National University of La Plata, to create a cooperative national library statistics database have met with some measure of success (Fushimi et al. 2009). In Africa, like in Asia, the use of cumulative statistical collections is not standard practice (Jilovsky 2011; Chiware and Mbambo-Thata 2009). As the Asian Online Statistics Pilot project has demonstrated, awareness must be raised of the need for centralised statistics databases for benchmarking in African academic libraries.
2.1 South African higher education libraries and statistics collection and use
In South Africa, ever since its inception, CHELSA recognised the need for and potential usefulness of a common set of standards that should guide libraries in the quantitative and qualitative assessment of their services. Various national bodies and institutions like the National Research Foundation (NRF), Department of Higher Education and Training (DHET) and universities have robust Management Information Systems (MIS) which contain data on students and research – but there is a missing link in that this wealth of information is not readily and easily shared; in addition, library data is not collected by the MIS. Rudimentary academic library data was collected nationally under the old SAPSE system until SAPSE was discontinued in 2004 in favour of the Higher Education Management Information Services (HEMIS). HEMIS does not mandate the national collection of any library data. The early history of the national collection of library data in South Africa is briefly discussed in ’Towards establishing an integrated system of Quality Assurance in South African Higher Education Libraries’ (De Jager 2007).
University libraries proceeded to develop a list of CHELSA indicators which set the standard to be used by member libraries for the collection of national statistics. These indicators were discussed extensively at a CHELSA workshop in May 2005 and eventually accepted and published. It was proposed that library activities be measured according to the prescriptions outlined in the document, ‘Measures for quality in SA HEI libraries’ (2005).
2.2 CHELSA: Measures for quality in SA HEI libraries
electronic and continuing resources; study places and facilities; number of libraries; hours open per year; clientele; library staff; use of library services; and expenditure.
Along with the list of indicators, definitions were developed for each. Both the indicators and definitions were largely based on measures collected by the ARL, CAUL and SCONUL. With Kyrillidou’s (2008) statement – that “measuring the size of library collections cannot be what it used to be” – in mind, in 2014, CHELSA started a process of reviewing the 2005 indicators with a view to adding indicators for new developments within libraries, such as the move from print to electronic journals and e-books and the measuring of online access.
2.3 The library statistical database
In 2010 the library at the Cape Peninsula University of Technology (CPUT) took the initiative to create a shared platform of library statistics for eventual use by all higher education libraries in the country. While some open source platforms like LibStats are readily available for use by academic libraries, the development team at CPUT opted for a new platform to enable future controlled developments. The database was designed using MySQL (a structured query language used for managing relational database systems) and PHP (a scripting language used for web development as well as general programming). It consists of two main levels of access, namely, that of Global Administrator and Institutional. The Global Administrator has the ability to add institutions and institutional administrators as well as update the forms for the collecting of CHELSA data. The database is designed so that all changes made at a global level are automatically visible to all member libraries. Institutional access includes administration functions assigned to the Institutional Administrator, as well as data entry and retrieval functions (Becker 2014). This functionality is available only at institutional level and allows library staff to input data for their own institution and to view both data relevant to their institution and data necessary for benchmarking across selected participating libraries. The division of the database allows for the integrity of the data to be maintained and for confidentiality of institutional-specific data. Access control and reports were identified as essential to such a database. All reports can be downloaded into Microsoft Excel allowing for the development of graphic representations of selected data which can then be incorporated into reports.
The purposes of the database are thus benchmarking with one or more selected institutions, and trend analysis. In the context of the higher education sector libraries, the advantages of the database include:
an automated system for collecting statistics at regular intervals; simplifying the preparation for quality assurance reviews;
the provision of accurate and current data to assist library managers with decision making, strategic planning, library research and budgeting
The database is currently hosted and maintained by staff of CPUT Libraries at no cost to CHELSA until such a time as CHELSA has its own capacity to host and maintain the structure. Current enhancements to the database are paid for by CHELSA. In 2014 the rollout of the database to all members of CHELSA began to take effect and, in order to enable universities to fully utilise the platform, a number of training sessions have been held with follow-up workshops planned for the future.
3 CHELSA Statistics Database survey project
The project can be divided into four different phases. After the development of the database at CPUT (which can be seen as Phase one), the challenge was to reach further consensus among member libraries to start using the platform and to share statistics in various ways (Phase two). Phase two included advocating to library directors and, once they agreed to use this database as a shared resource, training library staff in use of the database. Training was done using various methods (such as Skype sessions, for example). However, the main focus was two workshops held in 2014, one held at the University of the Witwatersrand (WITS) and the other at the Nelson Mandela Metropolitan University (NMMU). Phase three included the collecting and inputting of data by the libraries. The purpose of this research paper is an analysis of Phase three to determine the extent of the uptake and current use of the platform by various member libraries. Phase four, which falls outside the scope of this paper, is the usage of the database for the collecting of institutional data. Two institutions, CPUT and WITS, have already set up the database for this purpose and interest has been received from another institution that is investigating introducing the database for institutional use.
3.1 Aims and objectives of the survey
The survey of university libraries in South Africa sought to answer the following questions:
What is the current level of uptake of the statistics database among higher education libraries in South Africa?
What types of statistics are being recorded?
What level of interpretation is being done on the collected statistics? What is the use of the recorded statistics both internally and externally?
3.2 Methodology
survey was distributed, fourteen (61%) responded. As CPUT had developed the database and was running the survey, it was debated whether or not it should respond to the survey. Eventually it was decided to include its responses to the survey for the sake of a comprehensive overview. The survey consisted of four sections dealing with: uptake of the database, recording of the statistics, interpretation, and use.
The section about the uptake of the database attempted to determine the amount of importance each institution gave to the project, and its level of commitment to the project. A key factor was whether or not the library supported the idea of a national database and the sharing of information on an open platform. ‘Open’ here refers to access to the data entered by academic institutions involved based on level of access granted to individual staff members. The second section looks at the collecting and recording of the statistics in the database based on the CHELSA requirements. These questions were closely linked to those in the next section which emphasises the interpretation of the statistics. These sections both provided an opportunity for libraries to indicate their understanding of the CHELSA requirements or to raise their concerns with collecting, recording and interpreting the data elements and definitions provided for such elements.
The final section on the use of the database is possibly somewhat premature as most libraries are still trying to get to grips with the collecting and inputting of data. However, responses underline the attitude of the libraries towards the usefulness of the data collected.
4 Results and discussion
At the time of the survey, fifteen of the twenty-three university libraries in South Africa had contributed some data to the database and two of the libraries (including CPUT) were using the database to collect institutional statistics. Thirteen institutions had contributed data from 2013 and two had contributed from 2014.
Figure 1 Use of the statistics database at South African university libraries
0 1 2 3 4 5 6 7
Gauteng KwaZulu Natal
Eastern Cape Western Cape
Limpopo Free State North West
CHELSA libraries
No. of universities No. of universities using the statistics database
Twelve of the institutions (including CPUT) who were inputting data to the database and two of the institutions not inputting data responded to the survey. One institution responded that it was still investigating the database and did not answer any of the questions; however it had added some data to the database while attending one of the training workshops. Six of the institutions which had not responded to the survey were not contributing to the database at the time of the survey.
4.1 Part one: The statistical database
the idea of a national statistics database for academic libraries in South Africa, and the other two had indicated that they were still in the process of organising their data.
The institutions that indicated “yes and no” based their answers on the interpretation of the CHELSA definitions for the various data elements. They felt that the value of the data would be undermined by the vagueness of the descriptions and definitions provided. Although Wiegand (2013) stated that statistics alone do not add value, their value is determined by their internal and national usage (Mundt, 2004), making it important that there is a clear understanding of the descriptions and definitions of the data elements.
4.2 Part two: Recording statistics
Part two provided libraries with the list of CHELSA data elements to be collected. One institution indicated that, because of a lack of staff and because of their institutional culture, they were not collecting data on clientele, library hours, study spaces, or the use of library services. All other institutions indicated that they were collecting the data stipulated by CHELSA. One institution further indicated that additional elements could be collected on an institutional level, thus agreeing with Mundt (2004) that statistical data should be used for internal management as well as at a national level. Four institutions indicated that they were not always sure what data exactly was required for input; the key reasons given were around the interpretation and ambiguity of the definitions provided. It was felt that some definitions needed clarification in order to ensure future benchmarking. It is seen as important that all institutions share the same understanding of the required data elements. While six institutions indicated that they did not have a problem with understanding what to input, four institutions did not select an answer.
The definitions of the data elements on the database are recorded as they are stated in the CHELSA document ‘Measures for quality in SA HEI libraries’ (CHELSA 2005). Poll (2007) indicated that quality indicators are the basis for effective benchmarking. As benchmarking is one of the key reasons for the collecting of data nationally (Heaney 2009), the definitions need attention. Mundt (2004) supported the need for standardisation of, among other things, elements and terminology. If libraries find that there is little or no value in the recorded data due to different interpretations of the data elements, they may withdraw their support of the project. It is therefore suggested that the current definitions are revised with the assistance of relevant library staff in order to simplify and clarify them.
4.3 Part three: Interpretation of collected statistics
Of the ten institutions which answered the question “Do you find the statistical elements recorded on the database easy to understand?”, two indicated that the interpretation of the definitions was the cause of their lack of understanding. One institution indicated that information related to budgets and costs was confidential and did not think this information should be included for benchmarking purposes.
Once again, interpretation of the definitions was shown to be a problem. As stated by the IFLA Section on Statistics and Evaluation (2008), library statistics can be used to demonstrate the value provided by the library to its users and other stakeholders. However, in order to use the statistics effectively, library staff must be able to interpret them and do so with understanding. This state can only be achieved if all parties have a clear understanding of what the statistics represent. Liu (2001) and Poll (2007) pointed out that indicators may differ between libraries; however CHELSA sought to provide definitions of the indicators for South African academic libraries that were clear and easy to understand, so that libraries could interpret the data recorded in the database with confidence.
4.4 Part four: Use of the statistics recorded in the database
Part four of the survey was rather optimistic as libraries only received training and began inputting data in 2014. However, six institutions indicated that they are using the data recorded in the statistics database and five indicated that they are not. Three institutions did not select an answer, but they all indicated that they would be making use of the statistics as soon as they started contributing to the database. One institution indicated that it was using the database to compare collections and another thought that it would be useful in motivating for funds, additional staff and resource fund applications, based on ratio studies.
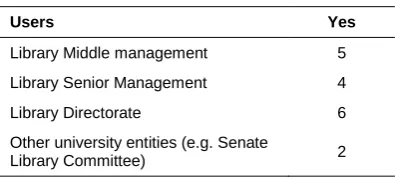
Six institutions answered the question “Which of the following [levels of staff] are using the database for retrieving and using statistics?”. One institution indicated that they were not using the statistics at all. As reflected in Table 1, at five institutions, staff at middle management level are using the database. Six indicated that library directorate-level staff are using the statistics, while only four indicated use by senior library management. Statistics are being used by staff outside the library at two institutions.
Table 1 Users of database
Users Yes
Library Middle management 5
Library Senior Management 4
Library Directorate 6
Other university entities (e.g. Senate
Although Boukacem-Zeghmouri (2012) stated that statistics are a crucial element of a librarian’s daily work, not one of the respondents elaborated on how the statistics were being used by completing the “Type of use” column. However, one institution indicated that it does not know for what the statistics are being used.
Mundt (2004) reported that collected statistics are important for advocacy within the institution and for benchmarking with other institutions. Four institutions indicated they are using the statistics for advocacy at institutional level and seven indicated that they are not. Three of the institutions who answered “no”, indicated that, although they are not doing so yet, they do intend using the collected statistics in future. Three institutions indicated that they are using the statistics database to view data of other institutions and two indicated that they would be doing so in the future. In some cases, the libraries with which a library would like to benchmark had not yet added data to the database. As more libraries input their data, it is possible that more libraries will be using the database to view data from other institutions.
Not one library indicated that they would like to use the statistics for internal trend analysis which could be the basis for strategic planning (IFLA 2008) although two institutions had, at the time of the survey, entered data for 2012 and 2013. At CPUT, data has been entered for the period 2006-2014 and has been used for trend analysis.
The final question of the survey was: “What further improvements would you like to see done on the database?” Most of the comments were about the revision of the CHELSA definitions for ease of interpretation to ensure that benchmarking would be accurate, and about the need for the statistics database to be updated to include a “Campus” option. This option would allow institutions to link input data to a campus which may include multiple branch libraries. Another comment was around ensuring that only relevant statistics are collected. Two institutions commented that they will only be able to comment once they have started using the database. There was also a comment suggesting that institutions be allowed to add their own parameters and requirements to the database so that they are able to document relevant statistics for their institution. The use of the institutional aspect of the statistics database allows for this function; however it is up to the institutional administrators to set up the parameters and definitions for the data to be collected by the institution. Based on the comments received, there was also some misunderstanding about the different access possibilities for the institutional and the CHELSA sections of the database. Some comments referring to the collecting of statistics at institutional level were also received.
5 Conclusion
At the time of the survey, fifteen institutions had entered data into the statistics database. Only two institutions that had not yet started doing so responded to the survey. Two of the institutions which indicated that they had not added data, did so during the survey period. At least one institution indicated that it was waiting for the inclusion of a “Campus” option on the statistics database before inputting data. One institution indicated the need for training on the use of the statistics database.
The survey has highlighted two main concerns by respondents, both of which are addressed by Mundt (2004):
understanding and interpretation of definitions ensuring that only relevant statistics are collected
There seems to be consensus among academic libraries in South Africa that statistics have to be collected and made available nationally. The majority of these institutions have started using the statistics database. Development of the database to accommodate the need for a “Campus” option will enable more libraries to input their data. It is also noted that further developments of the database would be necessary to ensure a user-friendly interface, especially at institutional level, and that training needs on both the use of the database and the interpretation of the definitions for the CHELSA data elements should be addressed. Further support can possibly be provided by an online working group of the staff responsible for collecting and inputting data at each institution under guidance of a CHELSA library director. This group would also give feedback into the development of the database.
References
Association of Research Libraries (ARL). 2013. ARL statistics: annual library statistics. [Online]. http://arlstatistics.org/home (January 2015).
Becker, D.A. 2014. Developing an ISO 2789 compliant database for South African academic library statistics. Innovation, 48: 5-19.
Boukacem-Zeghmouri, C. and Schopfel, J. 2012. Statistics usage by French academic libraries: a survey. Learned Publishing, 25(4): 271-278.
Chiware, E.R.T. and Mbambo-Thata, B. 2009. Current trends in the collection and use of statistics in academic and public libraries in Africa. In Library statistics for the twenty-first century world: proceedings of the conference held in
Montréal on 18-19 August 2008 reporting on the global library statistics project. M. Heaney, Ed. Munchen: K.G. Saur. 71-87.
The Committee of Higher Education Libraries of South Africa (CHELSA). 2005. Measures for quality in SA HEI libraries. (Unpublished).
Deutsche Bibliotheksstatistik. 2014. Deutsche Bibliotheksstatistik (German Library Statistics). [Online]. http://www.bibliotheksstatistik.de (January 2015).
Fushimi, M., Mangiaterra, N., Pichinini, M. and Gustavo Archuby. 2009. Library statistics database of the National University of La Plata (Argentina): a cooperative experience.In Library statistics for the twenty-first century world: proceedings of the conference held in Montréal on 18-19 August 2008 reporting on the global library statistics project. M. Heaney, Ed. Munchen: K.G. Saur.198-210
Heaney, M. Ed. 2009. Library statistics for the twenty-first century world: proceedings of the conference held in Montréal on 18-19 August 2008 reporting on the global library statistics project. Munchen: K.G. Saur.
IFLA. 2010. IFLA Library Statistics Manifesto. [Online]. http://www.ifla.org/files/assets/statistics-and-evaluation/publications/library-statistics-manifesto-en.pdf(January 2015).
IFLA Section on Statistics and Evaluation. 2008. Statistics and evaluation section. [Online]. http://www.ifla.org/statistics-and-evaluation (January 2015).
Jilovsky, C. 2009. Online statistics for Australian, New Zealand and Asian academic libraries.In Library statistics for the twenty-first century world: proceedings of the conference held in Montréal on 18-19 August 2008 reporting on the global library statistics project. M. Heaney, Ed. Munchen: K.G. Saur. 211-220.
Jilovsky, C. 2011. Singing in harmony: statistical benchmarking for academic libraries. Library Management, 32(1/2): 48-61.
Kyrillidou, M. 2001. To describe and measure the performance of North American research libraries. IFLA Journal, 27(40): 257-263.
Kyrillidou, M. 2008. Statistics & measurement. ARL, 256: 9-11. [Online].
http://www.libqual.org/documents/admin/Kyrillidou_2008_ReshapingARLstatistics.pdf(January 2015).
Liu, Y. Q. 2001. The use of statistics in the managerial process by public libraries in China and USA: a cross-country survey. Library Management, 22 (4/5): 187-194.
Mundt, S. 2004. Standardizing statistics of the hybrid library: issues and perspectives. Vine, 34(3): 107-112.
Poll, R. 2007. Benchmarking with quality indicators: national projects. Performance Measurement and Metrics, 8(1): 41-53. [Online]. http://www.emeraldinsight.com/doi/abs/10.1108/14678040710748076?journalCode=pmm (January 2015).